


The known: Cerebral palsy is a lifelong motor disorder caused by maldevelopment of or an insult to the developing brain.
The new: During 1995–2016, the birth prevalence of cerebral palsy declined in Australia from 2.1 to 1.5 cases per 1000 live births, with declines evident in all gestational age groups except 32–36 weeks. The proportion of children who used wheelchairs for mobility was larger in remote areas than in major cities or regional areas (31% v 26%).
The implications: The declining birth prevalence of cerebral palsy reflects the effects of advances in maternal and perinatal care and other public health interventions. Equity of access to disability services across Australia should be a priority.
Cerebral palsy is a lifelong disorder of movement and posture that results from maldevelopment of or an insult to the developing brain.1 In Australia, 60% of 5‐year‐old children with cerebral palsy are able to walk and 75% will have at least one associated impairment (eg, epilepsy; intellectual, speech, hearing, or vision impairment).2 While many risk factors for cerebral palsy are known (pre‐term birth, congenital infection, multiple birth, congenital anomalies, perinatal hypoxic–ischaemic brain injury, genetic and chromosomal syndromes), the aetiological pathways to brain injury and subsequent motor disorder for an individual child are often poorly understood.3 The reported birth prevalence of cerebral palsy differs between world regions, reflecting differences in socio‐demographic characteristics, public health practices, and access to high quality antenatal, intrapartum, and neonatal care.4,5
Cerebral palsy registers that regularly report the birth cohort prevalence and severity of disability at the population level are vital for assessing the cumulative impact of health initiatives and medical interventions.6 Recent register studies have found that the prevalence of cerebral palsy is declining.7,8,9 A recent international collaborative study that examined register data to birth year 2014 reported declines in eleven of fourteen participating high income countries (including Australia) and an estimated combined prevalence for the most recent birth cohort of 1.6 per 1000 live births.10 As more recent Australian Cerebral Palsy Register (ACPR) data are now available, it is important to investigate whether this decline in prevalence has continued in Australia.
As the ACPR dataset includes the residential location of people with cerebral palsy, it can also provide insights into health and disability service accessibility needs. This is particularly important in Australia, where a relatively small population is spread across a vast area. Health outcomes are generally poorer for Australians who do not live in urban centres, but it is not known whether this applies to the severity of functional motor limitations in children with cerebral palsy.11 Knowing more about the profile of children with cerebral palsy in Australia can assist with health, disability, and education service planning.
We therefore examined recent changes in the birth prevalence of cerebral palsy in Australia, overall, by time of brain injury (pre‐ or perinatal, post‐neonatal), and by gestational age group for children with cerebral palsy acquired pre‐ or perinatally. We also examined the level of gross motor function of children with cerebral palsy by their residential remoteness.
Methods
For our population‐based observational study, we analysed data for children registered with the ACPR. Established in 2008, the ACPR is a data repository for cerebral palsy research, a collaboration between the researchers and custodian organisations of cerebral palsy registers in each Australian state and territory (the ACPR Group), that aims to provide a total population register. Contributing registers collect data for all children with cerebral palsy born in their state or territory and apply definitions of cerebral palsy that include five key elements listed by Surveillance of Cerebral Palsy in Europe (SCPE):
- it is an umbrella term for a group of disorders;
- it is a condition that is permanent but not unchanging;
- it involves a disorder of movement or posture and of motor function;
- it is caused by a non‐progressive interference, lesion, or abnormality; and
- the interference, lesion, or abnormality is in the immature brain.12
To maximise data accuracy and completeness, contributing registers ascertain data from a range of sources, including hospital records, disability service providers, clinician and family referrals, and linkage with other registers. All children are included in the registers after their initial diagnosis; however, to reduce the risk of misdiagnosis (eg, later identification of degenerative conditions, or the resolution of neurological signs that indicated cerebral palsy), the cerebral palsy description for each child is verified and their clinical information updated at five years of age. This means that cerebral palsy prevalence estimates for a birth year are not reported until at least five years later. Data for children who die before their fifth birthday are included if their cerebral palsy description has been confirmed. We report our study in accordance with the Strengthening the Reporting of Observational Studies in Epidemiology statement.13
Study cohort
The study cohort included all children with cerebral palsy born in Australia during 1 January 1995 – 31 December 2016 and included in the ACPR at the time of the most recent state/territory data provision (31 July 2022). Birth prevalence analyses included data for all children with cerebral palsy born in states with long standing state registers (South Australia, Victoria, Western Australia), where data custodians were confident that cases of cerebral palsy were consistently and as completely ascertained as possible for all included birth years. This confidence was established by the finding that no or very few further cases could be identified for the included birth years. The registers in these three states (including 42% of the Australian population14) are defined as having complete population ascertainment. Data from all state and territory registers were included in the descriptive analyses of the residential geographic remoteness of people with cerebral palsy.
Study variables and data sources
We extracted information for each child from the ACPR dataset: mother's age at the time of birth (younger than 20, 20–29, 30–39, 40 years or older), sex (male, female), gestational age (less than 28, 28–31, 32–36, 37 or more completed weeks), birthweight (under 1000 g, 1000–1499 g, 1500–1999 g, 2000–2499 g, 2500 g or more), and plurality (singleton, multiple births). Children with cerebral palsy for whom a post‐neonatal cause of brain injury was known (eg, bacterial or viral infections, accidental and non‐accidental traumatic head injuries, cerebrovascular accidents after 28 days and before two years of age) were classified as having post‐neonatally acquired cerebral palsy. In the absence of an identified post‐neonatal cause, children were classified as having pre‐ or perinatally acquired cerebral palsy (injury or maldevelopment in utero, during birth, or during the first 28 days of life). Gross Motor Function Classification System (GMFCS) categories were dichotomised as levels I–III or IV and V. Children in GMFCS levels I or II can walk independently, those in GMFCS level III use handheld mobility devices and may use wheeled mobility equipment for longer distances, and children in GMFCS levels IV or V use wheeled mobility equipment in some or all situations.15 The residential remoteness of children was classified according to the Australian Statistical Geography Standard remoteness structure (major city, inner regional, outer regional, remote, very remote),16 based on their residential postcode at the time of birth or, if this was unavailable, at age five years. Aggregate data are reported for eleven two‐year birth year epochs. National Perinatal Data Collection live births data17 (1995–2016) were provided by the Australian Institute of Health and Welfare.
Statistical analyses
The combined birth prevalence was calculated for complete case ascertainment states (South Australia, Victoria, Western Australia) for the birth years 1995–2016. Data for the most recent birth epoch (2015–2016) are reported as provisional prevalence estimates, as case ascertainment is typically changed slightly by subsequent data provision; that is, a very small number of cases are added or removed. The numerator was the number of eligible children with cerebral palsy born in these states by two‐year epoch and included in their registers; the denominator was the number of live births in these states.17 Birth prevalence is reported as the number of cases per 1000 live births, with 95% confidence intervals (CIs). Temporal changes in the birth prevalence of cerebral palsy, overall and by time of brain injury, were assessed in quasi‐Poisson regression models adjusted for overdispersion, with the number of cases as the outcome variable, and including an offset term to account for differences between registers in the denominators. Similar Poisson regression models with offset terms were used to assess differences in the proportions of children with cerebral palsy by gestational age group over time (no evidence for overdispersion detected).
We summarise the residential remoteness of children with cerebral palsy as descriptive statistics and compared their distribution with Australian total population reference data.11 Statistical analyses were undertaken in R 4.3.1 (R Foundation for Statistical Computing).
Ethics approval
Each state and territory cerebral palsy register has ethics approval to supply non‐identified data to the ACPR database every two years.2 Ethics oversight for the ACPR is provided by the University of Sydney Human Research Ethics Committee (2020/463) and the Aboriginal Health and Medical Research Council of New South Wales Human Research Ethics Committee (1388/18).
Results
Data for 10 855 children with cerebral palsy born during 1995–2016 were included in the ACPR, 6258 of whom were boys (57.7%); 5649 children with cerebral palsy were born at 37 weeks’ gestation or later (58.1%), and 8691 were singletons (88.5%) (Box 1).
Prevalence of cerebral palsy, overall and by time of brain injury
Of 10 855 children with cerebral palsy, 5014 (46.2%) were born in states with registers with complete case ascertainment for the period 1995–2016 (Box 1). In these three states, the prevalence declined by 37.5%, from a peak of 2.4 (95% CI, 2.1–2.7) cases per 1000 live births in 1997–1998 to 1.5 (95% CI, 1.3–1.7) cases per 1000 live births in 2015–2016 (Box 2).
Of the 5014 children with cerebral palsy born in the three states with complete case ascertainment, the disorder was acquired pre‐ or perinatally in 4728 cases (94.3%) and post‐neonatally in 286 cases (5.7%). The prevalence of pre‐ or perinatally acquired cerebral palsy declined significantly between 1995–1996 and 2015–2016, from 2.0 (95% CI, 1.7–2.3) to 1.4 (95% CI, 1.2–1.6) cases per 1000 live births (P = 0.015). The prevalence of post‐neonatally acquired cerebral palsy also declined across this period, from 0.15 (95% CI, 0.11–0.21) to 0.08 (95% CI, 0.05–0.12) cases per 1000 live births, but the difference was not statistically significant (P = 0.08) (Box 2).
Prevalence of pre‐ or perinatally acquired cerebral palsy, by gestational age group
In states with complete case ascertainment, 551 of 4675 children (11.8%) with pre‐ or perinatally acquired cerebral palsy (and known gestational age) were born extremely pre‐term (before 28 weeks’ gestation). The birth prevalence of pre‐ or perinatally acquired cerebral palsy declined significantly between 1995–1996 and 2015–2016, from 63.5 (95% CI, 49.5–81.2) to 36.9 (95% CI, 27.3–49.6) cases per 1000 live births (P = 0.019), despite rising in 2013–2014 and 2015–2016 (Box 3).
A total of 643 children (13.8%) with pre‐ or perinatally acquired cerebral palsy were born very pre‐term (28–31 weeks’ gestation). In this group, the birth prevalence declined significantly between 1995–1996 and 2015–2016, from 39.3 (95% CI, 30.6–50.5) to 19.6 (95% CI, 14.3–26.9) cases per 1000 live births (P = 0.004) (Box 3).
A total of 768 children (16.4%) with pre‐ or perinatally acquired cerebral palsy were born moderately to late pre‐term (32–36 weeks’ gestation). In this group, the birth prevalence declined between 1995–1996 and 2015–2016, from 4.7 (95% CI, 3.3–6.0) to 3.5 (95% CI, 2.7–4.4) cases per 1000 live births, but the decline was not statistically significant (P = 0.11). The greatest decline was for the most recent reporting period, for which only provisional data are available (Box 3).
A total of 2713 children (58.0%) with pre‐ operinatally acquired cerebral palsy were born at term (37 weeks’ gestation or later). In this group, the birth prevalence declined significantly between 1995–1996 and 2015–2016, from 1.2 (95% CI, 1.1–1.4) to 1.0 (95% CI, 0.9–1.1) cases per 1000 live births (P = 0.006); a small increase in the most recent reporting period was noted (Box 3).
Residential remoteness of children with cerebral palsy
During 1995–2016 (all states and territories), 6467 of 9182 children with known residential postcode‐based remoteness category lived in major cities (70.4%), 2408 in inner or outer regional areas (26.2%), and 307 in remote or very remote areas (3.4%) (Box 1, Box 4). The corresponding proportions for all Australians in 2022 were 72.0% living in major cities, 26.1% in inner or outer regional areas, and 2.0% in remote or very remote areas.11 The proportions of pre‐term births were similar for children with cerebral palsy in major cities (2635, 41.8%), inner and outer regional areas (951, 41.1%), and remote or very remote areas (121, 40.5%). The proportion of children with cerebral palsy living in remote or very remote areas who required wheelchairs (GMFCS levels IV or V; 89 of 284, 31.3%) was larger than for those living in major cities (1608 of 6160, 26.1%) or in regional areas (586 of 2244, 26.1%).
Discussion
Our analysis indicates that, after a peak in 1997–1998, the birth prevalence of cerebral palsy in Australia declined substantially during 1995–2016. The prevalence of pre‐ or perinatally acquired cerebral palsy declined significantly for children in all gestational age groups, except those born moderately to late pre‐term (32–36 weeks’ gestation). Our findings are encouraging and probably reflect the effects of refinements to maternal and neonatal care, such as neonatal emergency transfer services, administration of magnesium sulphate or corticosteroids to mothers when pre‐term birth is anticipated, and therapeutic hypothermia for term neonates with hypoxic–ischaemic encephalopathy.4 The cumulative impact of these and other clinical and public health interventions is that an increasing number of babies at risk of cerebral palsy now survive without disability.4
In contrast to findings in Europe,18 the decline in birth prevalence of cerebral palsy among babies born moderately to late pre‐term was not statistically significant. These babies are not eligible for neuroprotective therapeutic hypothermia nor their mothers for magnesium sulphate treatment, although in the future the latter may be provided up to 34 weeks’ gestation.19,20,21 In addition, only 19% of all moderately to late pre‐term babies are admitted to neonatal intensive care and receive the quality improvement and follow‐up programs that accompany admission to these specialist services.22 Growth restriction (particularly when brain anomalies are present), antepartum haemorrhage, and fetal distress and inflammation are important risk factors for cerebral palsy for babies in this gestational age group.23 Further investigation of the pathways to cerebral palsy in moderately to late pre‐term babies is needed to develop new interventions that support their development (eg, melatonin therapy to reduce inflammation associated with growth restriction) and follow‐up programs that improve their outcomes.24
We also investigated the prevalence of post‐neonatally acquired cerebral palsy, the result of brain injury (eg, infection, traumatic head injury, cerebrovascular accident) sustained after 28 days but before two years of age. Its prevalence was somewhat volatile, but generally declined across the study period. The reasons for the decline are unclear, but probably include public health interventions (eg, vaccinations) and improved surgical techniques and peri‐surgical care, which are the focus of a new ACPR study. Another important risk factor for post‐neonatal cerebral palsy is living in regional or remote areas.25 In collaboration with both Aboriginal and non‐Indigenous researchers in regional and remote areas, the ACPR Group has increasingly focused on residential remoteness as a risk factor for cerebral palsy that also influences the severity of disability associated with the motor disorder.26
Almost one‐third of Australians do not live in major cities. They generally have poorer health outcomes, are more likely to experience socio‐economic disadvantage, and have less access to health services than people in major cities.11 We found that the proportion of children with cerebral palsy who lived in remote or very remote areas (3.4%) was larger than the overall population proportion living in these areas (2.0%). Further, the proportion of children with cerebral palsy who required wheelchairs for mobility was larger for those living in remote or very remote areas than for children living in major cities or regional areas. Possible explanations include exposure to cerebral palsy risk factors associated with remoteness; for example, a larger proportion of women living in rural and remote areas are teenage mothers, and the likelihood of pre‐term birth and low birthweight babies is higher.27 Further, women living outside of urban areas have less access to health services for managing chronic diseases that can affect maternal health during pregnancy, including hypertension and diabetes.27 The difference in severity of disability may in part reflect greater rates of socio‐demographic disadvantage or more limited access to antenatal and early intervention services in remote areas.28 These findings highlight the need to further investigate the role of remoteness and to strive for equitable and culturally safe access across Australia to antenatal services for women, and to health and disability services for people with cerebral palsy. The ACPR Group is currently planning an analysis of cerebral palsy birth prevalence, aetiology, and severity of disability by level of residential remoteness.
Limitations
For our birth prevalence analyses, we included data from only three states (including 42% of the Australian population). Population‐level cerebral palsy data from birth year 2001 onwards will soon be available from the Australian Capital Territory and New South Wales Cerebral Palsy Register, increasing the population proportion covered by future analyses to 76%. The Australian Institute of Health and Welfare can provide National Perinatal Data Collection remoteness data, but they were not available to the ACPR Group at the time of writing; we therefore report a descriptive analysis of residential remoteness of children with cerebral palsy in Australia. This initial exploration provides a baseline upon which to build further research, including investigation of cerebral palsy birth prevalence by residential remoteness.
Conclusion
The birth prevalence of cerebral palsy in Australia has declined by almost 40% over the two decades to 2015–2016, reflecting the effects of advances in maternal and perinatal care and other public health interventions. About 30% of children with cerebral palsy did not live in major cities, and the proportion who lived in remote or very remote areas was larger than the population proportion of all Australians in these areas. The ACPR Group will continue to report cerebral palsy population trends as part of our collaboration with clinicians, researchers, and public health officials working to improve outcomes for children across Australia. The causal mechanisms of cerebral palsy should be further investigated, as should risk factors for children born moderately to late pre‐term, the influence of residential remoteness on cerebral palsy severity, and access to disability services for people with cerebral palsy.
Box 1 – Demographic and clinical characteristics of children with cerebral palsy, Australia, birth years 1995–2016*
|
|
Children with cerebral palsy |
||||||||||||||
|
Characteristic |
All states and territories |
States with complete case ascertainment† |
|||||||||||||
|
|
|||||||||||||||
|
Children with cerebral palsy |
10 855 |
5014 |
|||||||||||||
|
Geographic remoteness‡ |
|
|
|||||||||||||
|
Major city |
6467 (70.4%) |
3737 (75.2%) |
|||||||||||||
|
Inner/outer regional |
2408 (26.2%) |
1042 (21.0%) |
|||||||||||||
|
Remote/very remote |
307 (3.4%) |
190 (3.8%) |
|||||||||||||
|
Unknown |
1673 [15.4%] |
45 [0.9%] |
|||||||||||||
|
Mother's age at birth (years) |
|
|
|||||||||||||
|
Younger than 20 |
454 (5.4%) |
264 (5.6%) |
|||||||||||||
|
20–29 |
3579 (42.2%) |
1996 (42.1%) |
|||||||||||||
|
30–39 |
4092 (48.3%) |
2296 (48.5%) |
|||||||||||||
|
40 or older |
351 (4.1%) |
182 (3.8%) |
|||||||||||||
|
Unknown |
2379 [21.9%] |
276 [5.5%] |
|||||||||||||
|
Sex |
|
|
|||||||||||||
|
Female |
4597 (42.3%) |
2136 (42.6%) |
|||||||||||||
|
Male |
6258 (57.7%) |
2878 (57.4%) |
|||||||||||||
|
Gestational age at delivery (weeks) |
|
|
|||||||||||||
|
20–27 |
1101 (11.3%) |
554 (11.2%) |
|||||||||||||
|
28–31 |
1332 (13.7%) |
648 (13.1%) |
|||||||||||||
|
32–36 |
1639 (16.9%) |
805 (16.3%) |
|||||||||||||
|
37 or more |
5649 (58.1%) |
2943 (59.5%) |
|||||||||||||
|
Unknown |
1134 [10.4%] |
64 [1.3%] |
|||||||||||||
|
Birthweight (g) |
|
|
|||||||||||||
|
Under 1000 |
993 (11.0%) |
529 (11.1%) |
|||||||||||||
|
1000–1499 |
991 (11.0%) |
486 (10.2%) |
|||||||||||||
|
1500–1999 |
879 (9.7%) |
463 (9.7%) |
|||||||||||||
|
2000–2499 |
906 (10.0%) |
457 (9.6%) |
|||||||||||||
|
2500 or more |
5277 (58.3%) |
2840 (59.5%) |
|||||||||||||
|
Unknown |
1809 [16.7%] |
239 [4.8%] |
|||||||||||||
|
Plurality |
|
|
|||||||||||||
|
Singleton births |
8691 (88.5%) |
4471 (89.7%) |
|||||||||||||
|
Multiple births |
1129 (11.5%) |
514 (10.3%) |
|||||||||||||
|
Unknown |
1035 [9.5%] |
29 [0.6%] |
|||||||||||||
|
|
|||||||||||||||
|
* Reported category proportions exclude “unknown” responses. † South Australia, Victoria, Western Australia. ‡ Australian Statistical Geography Standard remoteness structure.16 |
|||||||||||||||
Box 2 – Prevalence of cerebral palsy, Australia, birth years 1995–2016, overall and by time of brain injury: number of cases per 1000 live births, with 95% confidence intervals*
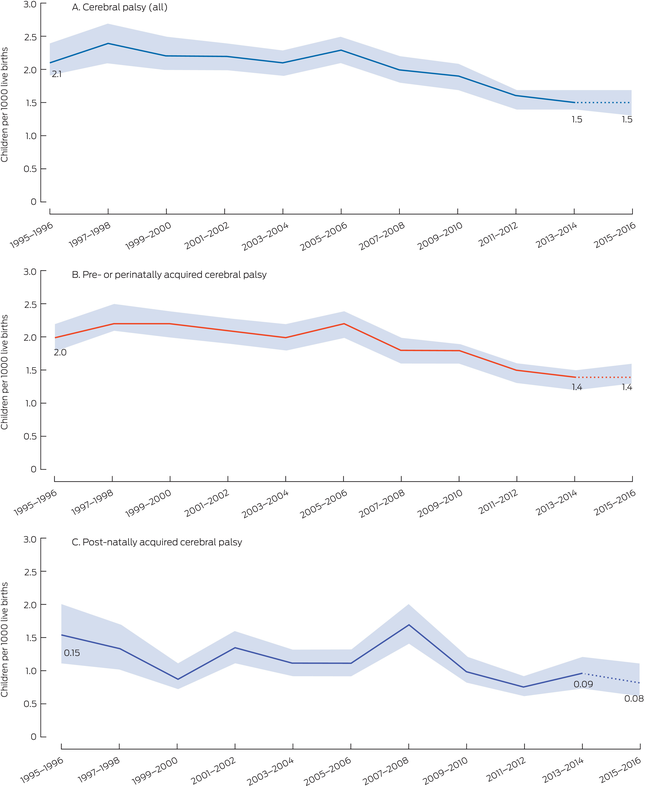
* The data for these graphs are included in the Supporting Information, table 1. The data for 2015–2016 are provisional.
Box 3 – Prevalence of pre‐ or perinatally cerebral palsy, Australia, birth years 1995–2016, by gestational age group: number of cases per 1000 live births, with 95% confidence intervals*
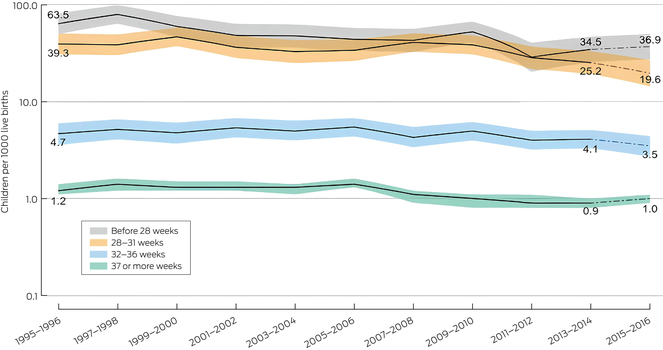
* The data for these graphs are included in the Supporting Information, table 2. The data for 2015–2016 are provisional.
Box 4 – Children in Australia with cerebral palsy, birth years 1995–2016, by geographic location and postcode‐based residential remoteness category*

* Australian Statistical Geography Standard remoteness structure.16
Received 30 October 2023, accepted 25 March 2024
- Hayley Smithers‐Sheedy1
- Emma Waight1
- Shona Goldsmith1
- Sue Reid2
- Catherine Gibson3
- Heather Scott3
- Linda Watson4
- Megan Auld5
- Fiona Kay6
- Clare Wiltshire7
- Gina Hinwood2
- Annabel Webb1
- Tanya Martin1
- Nadia Badawi1,8
- Sarah McIntyre1
- the ACPR Group
- 1 Cerebral Palsy Alliance Research Institute, the University of Sydney, Sydney, NSW
- 2 Murdoch Children's Research Institute, the Royal Children's Hospital, Melbourne, VIC
- 3 SA Birth Defects and Cerebral Palsy Registers, Women's and Children's Health Network, Adelaide, SA
- 4 WA Register of Developmental Anomalies, Western Australian Department of Health, Perth, WA
- 5 Queensland Cerebral Palsy Register: Choice, Passion, Life, Brisbane, QLD
- 6 Northern Territory Top End Health Service, Darwin, NT
- 7 Royal Hobart Hospital, Hobart, TAS
- 8 Children's Hospital at Westmead, Sydney, NSW
Data Sharing:
The authors had access to all raw data, statistical reports, and tables. The de‐identified data are not publicly available, but requests to the corresponding author will be considered on a case‐by‐case basis.
The Australian Capital Territory, New South Wales, and Australian cerebral palsy registers are funded by the Cerebral Palsy Alliance Research Foundation, the Northern Territory register by Women, Children and Youth, Royal Darwin Hospital, the Queensland register by Choice, Passion, Life, the South Australian register by the Women's and Children's Health Network (with additional support from Novita), and the Tasmanian register by St Giles and the Tasmanian Department of Health. The Victorian register received funding from the Victorian Department of Health and Human Services and the Cerebral Palsy Alliance Research Foundation, and infrastructure support from the Victorian Government Operational Infrastructure Support Program. The Western Australian Register of Developmental Anomalies: Cerebral Palsy is funded by the Western Australian Department of Health. The funding sources support the work of the cerebral palsy registers, which included the preparation of this report.
The ACPR Group acknowledge all the children with cerebral palsy and their families, and the clinicians who support them. We thank the Consultative Council on Obstetric and Paediatric Mortality and Morbidity (CCOPMM) for providing access to Victorian denominator data for this analysis and for the assistance of Safer Care Victoria staff. The conclusions, findings, opinions, and views or recommendations expressed in this article are those of the authors, and do not necessarily reflect those of CCOPMM.
No relevant disclosures.
- 1. Rosenbaum P, Paneth N, Leviton A, et al. A report: the definition and classification of cerebral palsy April 2006. Dev Med Child Neurol Suppl 2007; 49: 8‐14.
- 2. Australian Cerebral Palsy Register. Australian Cerebral Palsy Register report 2023: birth years 1995–2016. Jan 2023. https://cpregister.wpengine.com/wp‐content/uploads/2023/01/2023‐ACPR‐Report.pdf (viewed Jan 2024).
- 3. Blair E, Watson L. Epidemiology of cerebral palsy. Semin Fetal Neonatal Med 2006; 11: 117‐125.
- 4. Badawi N, McIntyre S, Hunt RW. Perinatal care with a view to preventing cerebral palsy. Dev Med Child Neurol 2021; 63: 156‐161.
- 5. McIntyre S, Goldsmith S, Webb A, et al. Global prevalence of cerebral palsy: a systematic analysis. Dev Med Child Neurol 2022; 64: 1494‐1506.
- 6. Arnaud C, Ehlinger V, Perraud A, et al. Public health indicators for cerebral palsy: a European collaborative study of the Surveillance of Cerebral Palsy in Europe network. Paediatr Perinat Epidemiol 2023; 37: 404‐412.
- 7. Kim GH, Lee G, Ha S, et al. Declining incidence of cerebral palsy in South Korea. Sci Rep 2023; 13: 10496.
- 8. Himmelmann K, Påhlman M. The panorama of cerebral palsy in Sweden part XIII shows declining prevalence in birth‐years 2011–2014. Acta Paediatrica 2023; 112: 124‐131.
- 9. Smithers‐Sheedy H, Waight E, Goldsmith S, et al; Australian Cerebral Palsy Register Group. Declining trends in birth prevalence and severity of singletons with cerebral palsy of prenatal or perinatal origin in Australia: a population‐based observational study. Dev Med Child Neurol 2022; 64: 1114‐1122.
- 10. McIntyre S, Goldsmith S, Webb A, et al; Global CP Prevalence Group. Global prevalence of cerebral palsy: a systematic analysis. Dev Med Child Neurol 2022; 64: 1494‐1506.
- 11. Australian Institute of Health and Welfare. Rural and remote health. Updated 30 Apr 2024. https://www.aihw.gov.au/reports/rural‐remote‐australians/rural‐and‐remote‐health (viewed Jan 2024).
- 12. Surveillance of Cerebral Palsy in Europe. Surveillance of cerebral palsy in Europe: a collaboration of cerebral palsy surveys and registers. Dev Med Child Neurol 2000; 42: 816‐824.
- 13. von Elm E, Altman DG, Egger M, et al; STROBE Initiative. The Strengthening the Reporting of Observational Studies in Epidemiology (STROBE) statement: guidelines for reporting observational studies. J Clin Epidemiol 2008; 61: 344‐349.
- 14. Australian Bureau of Statistics. Births, Australia, 2016 (3301.0). 13 Dec 2017. https://www.abs.gov.au/ausstats/abs@.nsf/Previousproducts/3301.0Main%20Features52016?opendocument&tabname=Summary&prodno=3301.0&issue=2016&num=&view= (viewed Jan 2024).
- 15. Palisano R, Rosenbaum P, Walter S, et al. Development and reliability of a system to classify gross motor function in children with cerebral palsy. Dev Med Child Neurol 1997; 39: 214‐223..
- 16. Australian Bureau of Statistics, Remoteness structure, July 2021 – June 2026. Australian Statistical Geography Standard (ASGS), edition 3. 20 July 2023. https://www.abs.gov.au/statistics/standards/australian‐statistical‐geography‐standard‐asgs‐edition‐3/jul2021‐jun2026/remoteness‐structure (viewed Jan 2024).
- 17. Australian Institute of Health and Welfare. National Perinatal Data Collection. Updated 12 July 2024. https://www.aihw.gov.au/about‐our‐data/our‐data‐collections/national‐perinatal‐data‐collection (viewed July 2024).
- 18. Arnaud C, Elhlinger V, Delobel‐Ayoub M, et al. Trends in prevalence and severity of pre/perinatal cerebral palsy among children born preterm from 2004 to 2010: a SCPE collaboration study. Front Neurol 2021; 12: 624884.
- 19. Crowther CA, Ashwood P, Middleton P, et al; MAGENTA Study Group. Prenatal intravenous magnesium at 30–34 weeks’ gestation and neurodevelopmental outcomes in offspring: the MAGENTA randomized clinical trial. JAMA 2023; 330: 603‐614.
- 20. Shepherd E, Salam R, Middleton P, et al. Neonatal interventions for preventing cerebral palsy: an overview of Cochrane Systematic Reviews. Cochrane Database Syst Rev 2018; 6: CD012409.
- 21. Shepherd E, Salam RA, Middleton P, et al. Antenatal and intrapartum interventions for preventing cerebral palsy: an overview of Cochrane systematic reviews. Cochrane Database Syst Rev 2017; 8: CD012077.
- 22. Chow S, Creighton, P, Holberton, JR, et al. 2021 Report of the Australian and New Zealand Neonatal Network. 2023. https://anznn.net/Portals/0/AnnualReports/Report%20of%20the%20Australian%20and%20New%20Zealand%20Neonatal%20Network%202021%20amended2.pdf (viewed Jan 2024).
- 23. McIntyre S, Blair E, Badawi N, et al. Antecedents of cerebral palsy and perinatal death in term and late preterm singletons. Obstet Gynecol 2013; 122: 869‐877.
- 24. Palmer K, Mockler J, Davies‐Tuck M, et al. Protect‐me: a parallel‐group, triple blinded, placebo‐controlled randomised clinical trial protocol assessing antenatal maternal melatonin supplementation for fetal neuroprotection in early‐onset fetal growth restriction. BMJ Open 2019; 9: e028243
- 25. Waight E, McIntyre S, Woolfenden S, et al; Australian Cerebral Palsy Register Group. Temporal trends, clinical characteristics, and sociodemographic profile of post‐neonatally acquired cerebral palsy in Australia, 1973–2012: a population‐based observational study. Dev Med Child Neurol. 2023; 65: 107‐116
- 26. Martin T, McIntyre S, Waight E, et al; ACPR Birds‐Eye View Group. Prevalence and trends for Aboriginal and Torres Strait Islander children living with cerebral palsy: a birds‐eye view. Dev Med Child Neurol 2023; 65: 1475‐1485
- 27. Bizuayehu HM, Harris ML, Chojenta C, et al. Maternal residential area effects on preterm birth, low birth weight and caesarean section in Australia: a systematic review. Midwifery 2023; 123: 103704.
- 28. Woolfenden S, Galea C, Smithers‐Sheedy H, et al; Australian Cerebral Palsy Register Group; CP Quest. Impact of social disadvantage on cerebral palsy severity. Dev Med Child Neurol 2019; 61: 586‐592.
Abstract
Objective: To examine recent changes in the birth prevalence of cerebral palsy in Australia; to examine the functional mobility of children with cerebral palsy by residential remoteness.
Study design: Population‐based register study; analysis of Australian Cerebral Palsy Register (ACPR) data.
Setting, participants: Children with cerebral palsy born in Australia, 1995–2016, and included in the ACPR at the time of the most recent state/territory data provision (31 July 2022).
Main outcome measures: Change in birth prevalence of cerebral palsy, of cerebral palsy acquired pre‐ or perinatally (in utero to day 28 after birth), both overall and by gestational age group (less than 28, 28–31, 32–36, 37 or more weeks), and of cerebral palsy acquired post‐neonatally (day 29 to two years of age); gross motor function classification by residential remoteness.
Results: Data for 10 855 children with cerebral palsy born during 1995–2016 were available, 6258 of whom were boys (57.7%). The birth prevalence of cerebral palsy in the three states with complete case ascertainment (South Australia, Victoria, Western Australia) declined from 2.1 (95% confidence interval [CI], 1.9–2.4) cases per 1000 live births in 1995–1996 to 1.5 (95% CI, 1.3–1.7) cases per 1000 live births in 2015–2016. The birth prevalence of pre‐ or perinatally acquired cerebral palsy declined from 2.0 (95% CI, 1.7–2.3) to 1.4 (95% CI, 1.2–1.6) cases per 1000 live births; statistically significant declines were noted for all gestational ages except 32–36 weeks. The decline in birth prevalence of post‐neonatally acquired cerebral palsy, from 0.15 (95% CI, 0.11–0.21) to 0.08 (95% CI, 0.05–0.12) cases per 1000 live births, was not statistically significant. Overall, 3.4% of children with cerebral palsy (307 children) lived in remote or very remote areas, a larger proportion than for all Australians (2.0%); the proportion of children in these areas who required wheelchairs for mobility was larger (31.3%) than that of children with cerebral palsy in major cities or regional areas (each 26.1%).
Conclusions: The birth prevalence of cerebral palsy declined markedly in Australia during 1995–2016, reflecting the effects of advances in maternal and perinatal care. Our findings highlight the need to provide equitable, culturally safe access to antenatal services for women, and to health and disability services for people with cerebral palsy, across Australia.