


The known: Heart failure is a frequent cause of hospitalisation, and the risk of re‐admission after discharge is high. The direct cost of unplanned re‐admissions has not been assessed in Australia.
The new: During 2013–2017, unplanned re‐admissions within 30 days of hospitalisation with heart failure cost the health system $604 million, equivalent to one‐third of costs for the initial hospitalisations. Most of these costs were for re‐admissions with possibly hospital‐acquired conditions (40.1%) or heart failure recurrence (35.6%).
The implications: Unplanned re‐admissions are expensive, and a large proportion may be preventable. Minimising the risk of re‐admission after hospitalisation with heart failure could improve outcomes, both for people with heart failure and the hospitals that treat them.
Heart failure is among the most frequent causes of hospital admission in Australia.1 Each year, about 144 000 Australian adults1 or 1–2% of the population2 experience heart failure, including 4% of those aged 45 years or older;3 60 000 new cases are diagnosed each year.4 The prevalence of heart failure in Australia is projected to reach nearly 750 000 cases by 2030, and the annual health care cost $3.8 billion,4 much of which is for hospital care, as heart failure is characterised by frequent hospitalisations, particularly for older people. Moreover, the risk of hospital re‐admission is high; almost one‐quarter of people hospitalised with heart failure in Australia are re‐admitted to hospital within 30 days of discharge.5
Reducing the number of hospital re‐admissions, often cited as a clinical and policy priority, provides an impetus for improving care and reducing avoidable hospital costs. Re‐admissions are distressing for patients and their families, expose people to iatrogenic risks (eg, hospital‐acquired infections), and divert scarce resources from acute care services. While some re‐admissions are unavoidable because of the progressive deterioration of heart failure despite optimal care, they may also be the result of suboptimal inpatient care, such as failure to adhere to guideline‐recommended therapy, or the care transition from the hospital to the community.6 A systematic review of studies published during 1966–2010 (primarily in the United States and the United Kingdom) found that about 27% of hospital re‐admissions (any cause) were avoidable;7 a United States analysis of Medicare data found that re‐admissions were a major contributor to avoidable hospital costs.8 While the risk of re‐admission for people with heart failure is recognised, the direct costs to the Australian health system associated with unplanned re‐admissions, and the proportion attributable to preventable causes, have not been examined.9 This information is crucial for health services and governments when developing and implementing policies for averting avoidable re‐admissions.
We therefore analysed national data to estimate the direct costs of unplanned re‐admissions within 30 days of hospitalisations with heart failure in Australia. Our secondary aim was to estimate the proportion of these costs attributable to potentially preventable re‐admissions.
Methods
In our national retrospective cohort study, we analysed hospitalisations data in the admitted patient data collections of each Australian state and territory. Admitted patient collections include data for inpatient and day‐only admissions to all public and private hospitals, including demographic characteristics, primary and secondary diagnoses, all procedures, and patient status at discharge. Diagnoses and procedures are coded according to the International Classification of Diseases, tenth revision, Australian modification (ICD‐10‐AM) and the Australian Classification of Health Interventions (ACHI); coding accuracy exceeds 85%.10
Admitted patient collection records were linked to records for subsequent hospitalisations to identify re‐admissions to any hospital; local data linkage units used probabilistic matching, the reported accuracy of which exceeds 99%.11 Private hospitals data for South Australia, the Northern Territory, and Tasmania are not available for research purposes and were therefore not included in our analysis.
Costs data were obtained from the National Hospital Cost Data Collection.12 The mean costs for hospitalisations for conditions defined by Australian Refined Diagnostic‐Related Group (DRG)13 are based on data collected annually from more than 400 public and private hospitals.
Study cohort
We included data for adults (18 years or older) who had been hospitalised during 1 January 2013 – 31 December 2017 with a principal diagnosis of heart failure, defined by ICD‐10‐AM diagnosis codes (Supporting Information, table 1). We excluded people who were discharged against medical advice, died during their index hospitalisation, were admitted during December 2017 (because 30‐day follow‐up data were not available), were transferred to other hospitals, had elective (planned) admissions with heart failure (ie, possibly not acute hospitalisations), or had been admitted to hospital with heart failure in the 30 days preceding the hospitalisation (ie, the hospitalisation was itself a re‐admission). When more than one qualifying hospitalisation was recorded during the study period for an individual patient, each was considered a new index admission if they were more than 30 days apart.
Outcomes
To estimate the cost of unplanned re‐admissions, we classified all re‐admissions as acute or elective, and acute re‐admissions were in turn defined as unplanned re‐admissions. The DRG for the re‐admission was matched with its mean cost according to the National Hospital Cost Data Collection. To estimate the mean cost for private hospitals, we used the mean DRG cost based on public hospitals data for the corresponding year, and the ratio of the cost weight per DRG for private and public hospitals. As the National Hospital Cost Data Collection did not publish private hospital costs data for 2014–15, we estimated costs for this year as the mean of those for 2013–14 and 2015–16. When several unplanned re‐admissions within 30 days were recorded for an individual, the costs were summed as the total re‐admission cost. We also estimated the cost of planned re‐admissions (summed cost of one or more elective re‐admissions) and the cost of all re‐admissions (summed cost of all acute and elective re‐admissions) within 30 days of discharge. To express re‐admission costs as a proportion of the costs for the index heart failure hospitalisation, we estimated the admission cost by matching the DRG for the index admission with National Hospital Cost Data Collection costs data.
To estimate the proportion of total re‐admissions costs that might be preventable, we used an approach for identifying re‐admissions potentially related to hospital care14 (details: Supporting Information, part 2). Briefly, two clinicians independently assessed re‐admission diagnoses and allocated them to one of four degrees of potential preventability; disagreements were resolved by a third clinician. Group 1 (most preventable) included diagnoses that may be potential complications of the index hospitalisation; it comprised those in the list of hospital‐acquired complications published by the Australian Commission on Safety and Quality in Healthcare (ACSQH),15 except that admission to the intensive care unit and admission with heart failure were omitted. The ACSQH list was developed to identify complications during hospitalisation rather than re‐admissions, but we assumed that unexpected re‐admission with a hospital‐acquired complication diagnosis soon after discharge was linked with a hospital‐acquired condition. Re‐admissions with the same condition (heart failure) and re‐admissions with conditions clinically related to the initial heart failure admission were respectively allocated to groups 2 and 3. Group 4 received all other re‐admission diagnoses, deemed the least preventable re‐admissions.
Statistical analysis
We summarise categorical data as frequencies and proportions, and continuous variable data as means with standard deviations (SDs) or as medians with interquartile ranges (IQRs). The statistical significance of differences between groups was assessed in χ2 or Mann–Whitney U tests, as appropriate. For some patients, DRGs were unmatched or missing, or demographic characteristics such as insurance status were missing. To ensure cost estimates included the entire study population, we used multiple imputation to replace missing values,16 applying the chained equations method in Stata.17 As costs are all equal to or greater than zero, the predictive mean matching imputation method with twenty imputations and five nearest neighbours was used to estimate imputed values.18 Differences in costs by age group, sex, and state/territory were estimated in a two‐part model19 adjusted for characteristics that may influence hospital costs: year of re‐admission, private health insurance status, requirement for treatment in an intensive care unit, need for mechanical ventilation, required surgery or other procedure, primary diagnoses and DRG for the re‐admission, other medical conditions (Condition Category classification20), and hospital length of stay (further details: Supporting Information, part 3). All costs were converted to 2021 Australian dollars using health index deflators. Statistical analyses were performed in Stata 16.1; P < 0.05 (two‐sided) was deemed statistically significant.
Ethics approval
The study was approved by the human research ethics committees of New South Wales Population and Health Services (2015/06/591), the Australian Capital Territory Health Department (ETH.7.15.143), Calvary ACT (20‐2015), the South Australia Department of Health and Aged Care (HREC/15/SAH/102), the Western Australia Department of Health (2016/47), the Tasmanian Department of Health (H0016011), the Northern Territory Department of Health and Menzies School of Health Research (2017‐2944), and the Metro North Hospital and Health Service (Brisbane; project 61694), and by Queensland Health (Public Health Act approval RD008025). The Victorian Department of Health accepted the NSW Population and Health Services Research Ethics Committee approval. A waiver of individual consent was granted by all committees for the analysis of de‐identified patient data. We report our study according to the STROBE guidelines for reporting observational studies.21
Results
Of 260 833 hospitalisations of adults with primary diagnoses of heart failure during 1 January 2013 – 31 December 2017, 165 612 met our inclusion criteria (Box 1). Missing costs data were imputed for 9865 hospitalisations (6.2%); costs data were missing more frequently for private (17.2% of admissions) than public hospital admissions (4.2%), and for admissions in New South Wales/Australian Capital Territory (8.2% of admissions) and Queensland (8.3%) than for other states and territories (Supporting Information, table 2). Patient characteristics and the distribution of estimated costs before and after imputing missing data were similar (Supporting Information, table 2 and figure 1).
Cohort characteristics
The mean age of patients at admission was 79 years (SD, 12 years), 85 964 were men (51.9%), and 75 396 had previously experienced heart failure (46%); 142 914 people were admitted to public hospitals (86.3%). The most frequently reported medical conditions (other than heart failure) were diabetes (41.8% of admissions), hypertension (37.6%), and dialysis or renal failure (30.0%). The proportions of people re‐admitted to hospital who had previously experienced heart failure (53.9% v 42.8%) or had dialysis or renal failure (39.2% v 27.0%), chronic lung disease (25.4% v 19.7%), or malnutrition (18.5% v 13.6%), were larger than for people who were not re‐admitted (Box 2).
Cost of the index hospitalisations
The total cost of the index heart failure hospitalisations during 2013–2017 was $1881.4 million, or $376.2 million per year and $11 360 per patient (Box 3).
Incidence and estimated cost of unplanned re‐admissions
A total of 86 320 re‐admissions for any cause within 30 days of discharge from the index admission were recorded for 49 878 people, including 58 977 unplanned re‐admissions (68.3%) of 41 125 patients, yielding an incidence of at least one unplanned re‐admission within 30 days of 24.8% (Box 3).
The total estimated cost of unplanned re‐admissions was $604.4 million (95% confidence interval [CI], $598.2–610.5 million), or $120.9 million (95% CI, $119.6–122.1 million) per year, equivalent to 32% of the cost of the index heart failure hospitalisations (Box 3). The mean cost of unplanned re‐admissions was $14 695 (95% CI, $14 535–14 856) per patient and $10 247 (95% CI, $10 143–10 352) per re‐admission.
After adjustment for factors that may influence hospital costs, the mean cost per re‐admission was similar for male ($11 124; 95% CI, $10 884–11 364) and female patients ($11 275; 95% CI, $11 032–11 519). The adjusted cost of re‐admissions varied slightly by age group and state/territory (Box 4; Supporting Information, table 5).
Costs of re‐admissions, by potentially preventable category
The total cost of 21 641 group 1 re‐admissions (most preventable) was $242.1 million (40.1% of re‐admission costs); the most frequent re‐admission diagnoses were pneumonia (1534 re‐admissions), other sepsis (724 re‐admissions), and acute kidney failure (959 re‐admissions). Group 2 re‐admissions (18 666 re‐admissions) incurred $215.5 million in costs (35.6% of unplanned re‐admission costs), group 3 re‐admissions (6641 re‐admissions) $77.8 million (12.9%) and group 4 re‐admissions (least preventable; 12 029 re‐admissions) $68.8 million (11.4%) (Box 5).
Discussion
We estimate that the initial hospitalisations of people with heart failure in Australia during 2013–2017 incurred costs of $1.88 billion. Within 30 days of discharge from hospital, almost one in four patients had one or more unplanned re‐admissions at a total cost of $604 million, equivalent to 32% of the initial hospitalisation costs. Unplanned re‐admissions with diagnoses considered to be hospital‐acquired and potentially preventable conditions when they develop within 30 days of hospital discharge, such as pneumonia, sepsis, and acute kidney failure, accounted for 40.1% of unplanned re‐admission costs. About 35% of costs were for re‐hospitalisations with heart failure, which can potentially be averted by effective interventions. Our findings collectively suggest that unplanned re‐admissions after hospitalisation with heart failure are expensive for the health care system, and that a large proportion of this cost is preventable.
We report the first national assessment in Australia of the direct hospital costs of unplanned re‐admissions of people who had been admitted to hospital with heart failure (or, indeed, with any condition). Similar analyses have been reported only in the United States, where re‐admissions of people treated in hospital for heart failure cost the health care system an estimated US$13 74022 to US$14 222 per re‐admission.23 We found that the mean cost of unplanned re‐admissions ($14 695 per patient) exceeded that of the initial heart failure hospitalisation ($11 360 per patient), and that some people were re‐admitted to hospital more than once during the 30 days following their initial discharge. Consequently, the total re‐admission costs as a proportion of index admission costs were larger (32%) than indicated by the re‐admission rate (24.8%).
We also found that a large proportion of these costs may be preventable. As there is no consensus definition of preventable re‐admissions, nor a validated standard for assessing them, definitions of preventability are somewhat heterogenous. Further, people with heart failure tend to be older, and multimorbidity and longer hospital stays are typical.5 Hospital‐acquired infection rates are high for this group,24 and they are more likely than younger people to receive treatments associated with complications, such as renal failure after intravenous diuretic therapy. Factors other than their medical condition, such as socio‐economic disadvantage, and systemic factors, such as poorly coordinated discharge practices, also increase the risk of re‐admission. Nevertheless, in a Canadian study about 23% of people discharged from hospital experienced adverse events, 50% of which were preventable.25 irrespective of the data source or definition used, about one‐quarter of hospital re‐admissions are generally deemed preventable.7 Finally, it is difficult to identify the exact reasons for re‐admissions from coded hospital data. Our approach provides a reasonable framework for determining the extent to which re‐admission costs are potentially preventable.
Transitional care interventions that facilitate safe discharge from home to the community, such as home visits by health professionals and early follow‐up in multidisciplinary heart failure clinics, reduce the numbers of all‐cause and heart failure‐related re‐admissions.26,27,28,29 Home visits, structured telephone calls, and telemonitoring also reduce the risk of heart failure‐specific re‐admissions.29 These interventions are generally associated with net cost savings; a 2017 systematic review estimated a net saving to the health system of $US975 per patient with heart failure.30 In a United States randomised trial, broader, hospital‐wide transitional care interventions reduced the numbers of 30‐day re‐admissions and emergency department visits by 30%, saving US$412 per person, a 33.9% reduction;31 a smaller American study found a similar effect for people hospitalised with heart failure, saving US$1453 per person.32 In addition, premature discharge, persistent clinical features of congestion, and failure to initiate guideline‐directed therapy are associated with greater risk of re‐admission for people with heart failure.33,34 In Australia, the extent to which hospitals use supportive strategies for people at discharge is uncertain, but the provision of guideline‐directed therapy is suboptimal.35 Nevertheless, programs for averting hospital admissions of people with chronic diseases, including heart failure, are effective for reducing the number of re‐admissions;36 for example, the Hospital Admission Risk Program reduced the total monthly hospital cost per person with heart failure by $1293.37 Broader implementation of similar evidence‐based strategies could reduce the number and costs of re‐admissions.
From a policy perspective, public reporting of hospital re‐admission rates and financial penalties for hospitals with high rates have been used to encourage interventions for their reduction.38 While these policies, particularly financial penalties, can reduce re‐admission rates,39 clinicians and researchers have raised concerns about inadvertent effects, such as increased mortality caused by inappropriate implementation of hospital‐avoidance strategies. For example, a United States study40 found that lower 30‐day re‐admission rates were associated with lower one‐year re‐admission rates and costs, but one‐year mortality rates rose. Financial penalties for certain re‐admission types have recently been introduced in Australia,41 where 30‐day mortality after hospitalisations for heart failure declined during 2010–15.5 Such policy measures must be introduced cautiously to avoid inadvertent harm.
Limitations
We used the mean costs associated with each DRG to estimate direct hospital costs, but the costs incurred by individual hospitals will vary. In private hospitals, patients can be charged additional, out‐of‐pocket costs that were not included in our analysis, as we considered only those costs borne by government agencies. However, in our study only 13.7% of patients were treated in private hospitals, and the National Hospital Cost Data Collection is the only national dataset including hospitalisation costs. In addition, no private hospital data were available from South Australia, the Northern Territory, and Tasmania, which may have led to us underestimating total costs. However, these regions accounted for only 10% of the Australian population, and most people in our study (86.3%) were treated in public hospitals. Costs data were more frequently missing for admissions to private hospitals and to hospitals in New South Wales/Australian Capital Territory and Queensland. However, the overall proportion of missing records was small, and the characteristics of patients with or without missing costs data were similar, as were the distributions of costs before and after imputing missing data. We used the ACSQH hospital‐acquired complications list to identify re‐admissions for potentially hospitalisation‐related complications, but the list is validated only for use in hospitals. Nevertheless, it is reasonable to assume that an adverse event such as pneumonia is probably hospital‐acquired if it develops soon after discharge, and this assumption is consistent with how such re‐admissions are managed in practice. We considered only direct hospital costs for re‐admissions, not indirect costs, such as lost productivity, lost wages, family expenses, and intangible costs, including increased pain and reduced quality of life; we have therefore underestimated the societal costs of hospital re‐admissions.
Conclusion
Unplanned re‐admissions of people discharged after hospitalisations with heart failure are expensive, incurring direct hospital costs equivalent to 32% of those for the initial hospitalisations. A considerable proportion of these costs are for potentially preventable re‐admissions. Policy and practice changes for reducing the number of unplanned re‐admissions could improve outcomes for people with heart failure and reduce hospital costs.
Box 1 – Selection of hospitalisations of people with heart failure, Australia, 2013–2017, for inclusion in our analysis
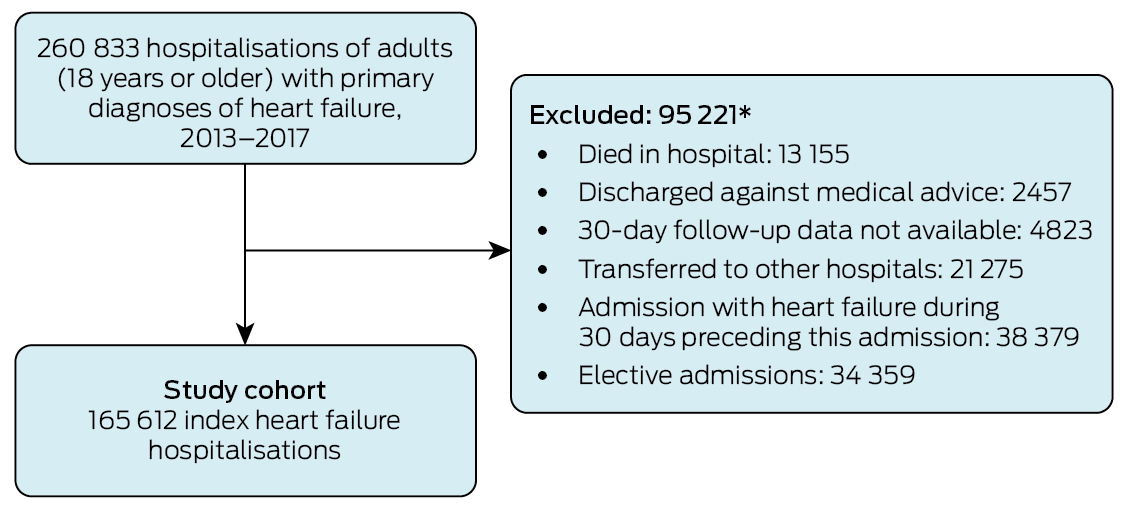
* Multiple reasons for exclusion possible.
Box 2 – Characteristics of 165 612 people admitted to hospital with heart failure, Australia, 2013–2017, by number of re‐admissions within 30 days of discharge from the index admission
|
Characteristic |
All admissions |
One or more unplanned re‐admissions |
No unplanned re‐admissions |
||||||||||||
|
|
|||||||||||||||
|
Admissions |
165 612 |
41 125 |
124 487 |
||||||||||||
|
Age (years), mean (SD) |
78.6 (12.0) |
78.5 (12.0) |
78.6 (12.1) |
||||||||||||
|
Sex |
|
|
|
||||||||||||
|
Men |
85 964 (51.9%) |
22 002 (53.5%) |
63 962 (51.4%) |
||||||||||||
|
Women |
79 648 (48.1%) |
19 123 (46.5%) |
60 525 (48.6%) |
||||||||||||
|
Hospital type |
|
|
|
||||||||||||
|
Public |
142 914 (86.3%) |
36 254 (88.2%) |
106 660 (85.7%) |
||||||||||||
|
Private |
22 698 (13.7%) |
4871 (11.8%) |
17 827 (14.3%) |
||||||||||||
|
State/territory |
|
|
|
||||||||||||
|
New South Wales/Australian Capital Territory |
55 487 (33.5%) |
13 789 (33.5%) |
41 698 (33.5%) |
||||||||||||
|
Victoria |
43 331 (26.2%) |
9668 (23.5%) |
33 663 (27.0%) |
||||||||||||
|
Queensland |
32 944 (19.9%) |
9304 (22.6%) |
23 640 (19.0%) |
||||||||||||
|
Western Australia |
16 802 (10.1%) |
4302 (10.5%) |
12 500 (10.0%) |
||||||||||||
|
South Australia/Northern Territory |
13 477 (8.1%) |
3281 (8.0%) |
10 196 (8.2%) |
||||||||||||
|
Tasmania |
3571 (2.2%) |
781 (1.9%) |
2790 (2.2%) |
||||||||||||
|
Prior cardiac history* |
|
|
|
||||||||||||
|
Congestive heart failure |
75 396 (45.5%) |
22 160 (53.9%) |
53 236 (42.8%) |
||||||||||||
|
Hypertension |
62 321 (37.6%) |
16 584 (42.0%) |
45 737 (36.3%) |
||||||||||||
|
Arrhythmia or conduction system disorder |
45 621 (27.5%) |
13 018 (32.9%) |
32 603 (25.9%) |
||||||||||||
|
Ischaemic heart disease |
31 664 (19.1%) |
8666 (21.9%) |
22 998 (18.2%) |
||||||||||||
|
Valvular and rheumatic heart disease |
21 149 (12.8%) |
5578 (14.1%) |
15 571 (12.3%) |
||||||||||||
|
Acute coronary syndrome |
18 547 (11.2%) |
5701 (14.4%) |
12 846 (10.2%) |
||||||||||||
|
Vascular disease |
9492 (5.7%) |
2856 (7.2%) |
6636 (5.3%) |
||||||||||||
|
Cerebrovascular diseases |
5144 (3.1%) |
1461 (3.7%) |
3683 (2.9%) |
||||||||||||
|
Other medical conditions* |
|
|
|
||||||||||||
|
Diabetes |
69 233 (41.8%) |
17 613 (44.6%) |
51 620 (40.9%) |
||||||||||||
|
Dialysis or renal failure |
49 704 (30.0%) |
15 359 (38.9%) |
34 345 (27.2%) |
||||||||||||
|
Fluid and electrolyte disorders |
46 031 (27.8%) |
14 210 (36.0%) |
31 821 (25.2%) |
||||||||||||
|
Anaemia and other haematological disorders |
45 136 (27.3%) |
12 933 (32.7%) |
32 203 (25.%) |
||||||||||||
|
Chronic lung disease |
34 995 (21.1%) |
10 456 (25.4%) |
24 539 (19.7%) |
||||||||||||
|
Pneumonia |
33 763 (20.4%) |
9882 (24.0%) |
23 881 (19.2%) |
||||||||||||
|
Psychiatric disorders |
11 913 (7.2%) |
3909 (9.5%) |
8004 (6.4%) |
||||||||||||
|
Major and metastatic cancer |
5365 (3.2%) |
1802 (4.4%) |
3563 (2.9%) |
||||||||||||
|
Chronic liver disease and cirrhosis |
2886 (1.7%) |
977 (2.4%) |
1909 (1.5%) |
||||||||||||
|
Geriatric syndromes* |
|
|
|
||||||||||||
|
Incontinence, urinary tract infection, other urinary tract disorders |
33 768 (20.4%) |
9975 (24.3%) |
23 793 (19.1%) |
||||||||||||
|
Protein–calorie malnutrition |
24 567 (14.8%) |
7610 (18.5%) |
16 957 (13.6%) |
||||||||||||
|
Hemiplegia, paraplegia, paralysis, functional disability |
10 400 (6.3%) |
3302 (8.0%) |
7098 (5.7%) |
||||||||||||
|
Dementia and senility |
9130 (5.5%) |
2436 (5.9%) |
6690 (5.4%) |
||||||||||||
|
Chronic ulcers |
7635 (4.6%) |
2467 (6.0%) |
5168 (4.2%) |
||||||||||||
|
|
|||||||||||||||
|
SD = standard deviation. * Condition Categories for defining medical conditions are included in the Supporting Information, table 3. |
|||||||||||||||
Box 3 – Number and estimated costs of re‐admissions to hospital within 30 days of discharge from index admissions for 165 612 people admitted to hospital with heart failure, Australia, 2013–2017
|
|
|
|
Costs (millions), 2013–2017 (95% CI) |
Mean costs, 2013–2017 (95% CI) |
|||||||||||
|
Characteristic |
Patients |
Re‐admissions |
Total cost |
Mean annual costs |
Mean cost per patient* |
Mean cost per re‐admission |
|||||||||
|
|
|||||||||||||||
|
Index heart failure hospitalisations |
165 612 |
— |
$1881.4 ($1872.5–1890.2) |
$376.3 ($374.5–378.1) |
$11 360 (11 312–11 408) |
— |
|||||||||
|
Primary outcome |
|
|
|
|
|
|
|||||||||
|
Unplanned re‐admissions |
41 125 (24.8%) |
58 977 |
$604.4 ($598.2–610.5) |
$120.9 ($119.6–122.1) |
$14 695 ($14 535–14 856) |
$10 247 ($10 143–10 352) |
|||||||||
|
Secondary outcomes |
|
|
|
|
|
|
|||||||||
|
Planned re‐admissions |
13 596 (8.2%) |
27 343 |
$182.9 ($178.0–187.9) |
$36.6 ($35.6–37.6) |
$13 454 ($13 101–13 806) |
$6690 ($6508–6872) |
|||||||||
|
Any re‐admission |
49 878 (30.1%) |
86 320 |
$787.3 ($779.3–795.3) |
$157.5 ($155.6–159.1) |
$15 784 ($15 616–15 952) |
$9120 ($9028–9213) |
|||||||||
|
|
|||||||||||||||
|
CI = confidence interval. * For all re‐admissions within 30 days of discharge from index admission. |
|||||||||||||||
Box 4 – Crude and adjusted unplanned re‐admission costs, by age group, sex and state/territory*
|
|
Mean re‐admission costs, millions (95% CI) |
||||||||||||||
|
Characteristic |
Crude |
Adjusted* |
|||||||||||||
|
|
|||||||||||||||
|
Age group (years) |
|
|
|||||||||||||
|
Under 55 |
$9344 ($8635–10 052) |
$10 646 ($10 225–11 066) |
|||||||||||||
|
55 to under 65 |
$10 074 ($9530–10 619) |
$10 576 ($10 226–10 926) |
|||||||||||||
|
65 to under 75 |
$10 570 ($10 297–10 843) |
$11 218 ($10 907–11 528) |
|||||||||||||
|
75 to under 85 |
$10 439 ($10 285–10 592) |
$11 162 ($10 906–11 419) |
|||||||||||||
|
85 or older |
$10 090 ($9984–10 197) |
$11 228 ($10 995–11 462) |
|||||||||||||
|
Sex |
|
|
|||||||||||||
|
Men |
$10 441 ($10 290–10 592) |
$11 124 ($10 884–11 364) |
|||||||||||||
|
Women |
$10 019 ($9877–10 161) |
$11 275 ($11 032–11 519) |
|||||||||||||
|
State/territory |
|
|
|||||||||||||
|
New South Wales/Australian Capital Territory† |
$11 055 ($10 846–11 265) |
$11 765 ($11 468–12 062) |
|||||||||||||
|
Queensland |
$8439 ($8296–8582) |
$11 415 ($11 155–11 676) |
|||||||||||||
|
South Australia/Northern Territory† |
$7784 ($7496–8072) |
$10 305 ($9999–10 611) |
|||||||||||||
|
Tasmania |
$10 769 ($10 057–11 481) |
$10 777 ($10 291–11 263) |
|||||||||||||
|
Victoria |
$12 045 ($11 804–12 286) |
$11 268 ($11 001–11 534) |
|||||||||||||
|
Western Australia |
$11 304 ($10 888–11 721) |
$10 794 ($10 519–11 070) |
|||||||||||||
|
|
|||||||||||||||
|
CI = confidence interval. * The outputs of the two‐part model underlying these results are provided in the Supporting Information, table 4. † Combined because of the small numbers of hospitals in the Australian Capital Territory and the Northern Territory. |
|||||||||||||||
Box 5 – The most frequent diagnoses for unplanned re‐admissions within 30 days of discharge from index admissions of people with heart failure, Australia, 2013–2017, by potentially preventable category
|
Preventability group diagnosis (ICD‐10‐AM codes) |
Re‐admissions |
Total costs, millions (95% CI) |
|||||||||||||
|
|
|||||||||||||||
|
(1) Re‐admission for actual OR potential complication/adverse event of the index hospital care |
21 641 |
$242.2 (40.1%) |
|||||||||||||
|
Pneumonia, organism unspecified (J18) |
1534 |
$17.7 (16.9–18.6) |
|||||||||||||
|
Other sepsis (A41) |
724 |
$17.9 (17.2–18.7) |
|||||||||||||
|
Atrial fibrillation and flutter (I48) |
1222 |
$10.8 (10.2–11.5) |
|||||||||||||
|
Acute kidney failure (N17) |
959 |
$14.7 (14.1–15.2) |
|||||||||||||
|
Acute myocardial infarction (I21) |
1027 |
$13.1 (12.1–14.1) |
|||||||||||||
|
(2) Re‐admission with heart failure |
18 666 |
$215.5 (35.6%) |
|||||||||||||
|
Heart failure (I50) |
18 311 |
$211.0 (207.7–214.2) |
|||||||||||||
|
Pleural effusion, not elsewhere classified (J90) |
297 |
$3.91 (3.58–4.24) |
|||||||||||||
|
Pulmonary oedema (J81) |
58 |
$0.56 (0.49–0.63) |
|||||||||||||
|
(3) Re‐admission with a potentially related diagnosis |
6641 |
$77.8 (12.9%) |
|||||||||||||
|
Bronchitis, not specified as acute or chronic (J44) |
2308 |
$22.5 (21.87–23.2) |
|||||||||||||
|
Nonrheumatic aortic valve disorders (I35) |
277 |
$6.43 (5.46–7.40) |
|||||||||||||
|
Chronic ischaemic heart disease (I25) |
261 |
$5.32 (3.78–6.86) |
|||||||||||||
|
Cardiomyopathy (I42) |
255 |
$6.97 (5.16–8.79) |
|||||||||||||
|
Pain in throat and chest (R07) |
1309 |
$7.93 (7.65–8.20) |
|||||||||||||
|
(4) Re‐admission with other diagnosis |
12 029 |
$68.8 (11.4%) |
|||||||||||||
|
Care involving dialysis (Z49) |
4836 |
$3.53 (3.44–3.62) |
|||||||||||||
|
Care involving use of rehabilitation procedures (Z50) |
589 |
$5.37 (5.14–5.60) |
|||||||||||||
|
Problems related to medical facilities and other health care (Z75) |
954 |
$4.50 (4.40–4.60) |
|||||||||||||
|
Paralytic ileus and intestinal obstruction without hernia (K56) |
160 |
$2.26 (1.86–2.66) |
|||||||||||||
|
Other functional intestinal disorders (K59) |
353 |
$2.16 (2.05–2.27) |
|||||||||||||
|
|
|||||||||||||||
|
CI = confidence interval; ICD‐10‐AM = International Classification of Diseases, tenth revision, Australian modification. |
|||||||||||||||
Received 5 June 2023, accepted 22 January 2024
- Trang Dang1,2
- Wandy Chan1,2
- Sunnya Khawaja1,2
- James Fryar1,2
- Brenda Gannon1
- Sanjeewa Kularatna3,4
- William Parsonage3,5
- Isuru Ranasinghe1,2
- 1 The University of Queensland, Brisbane, QLD
- 2 The Prince Charles Hospital, Brisbane, QLD
- 3 Australian Centre for Health Services Innovation, Queensland University of Technology, Brisbane, QLD
- 4 Duke–NUS Medical School, Singapore, Singapore
- 5 Royal Brisbane and Women's Hospital, Brisbane, QLD
Open access:
Open access publishing facilitated by the University of Queensland, as part of the Wiley – the University of Queensland agreement via the Council of Australian University Librarians.
Data sharing:
Under our agreements with data custodians and state governments, we cannot share the data underlying this report. Applications for data access should be directed to the respective data custodians.
This study was supported by the Heart Foundation. We thank the following data linkage units for their assistance: the Centre for Health Record Linkage (NSW/ACT); SA‐NT DataLink; the Statistical Services Branch, Queensland Department of Health; the Tasmanian Data Linkage Unit; the Centre for Victorian Data Linkages, Victorian Department of Health; WA Data Linkage Services, Western Australian Department of Health. We also thank the custodians of the data collections we used (deaths registrations, hospital morbidity data collections).
No relevant disclosures.
- 1. Australian Institute of Health Welfare. Heart, stroke and vascular disease: Australian facts. Updated 17 June 2024. https://www.aihw.gov.au/reports/heart‐stroke‐vascular‐diseases/hsvd‐facts (viewed July 2024).
- 2. Sahle BW, Owen AJ, Mutowo MP, et al. Prevalence of heart failure in Australia: a systematic review. BMC Cardiovasc Disord 2016; 16: 32.
- 3. Australian Institute of Health and Welfare. Heart failure… what of the future? 26 June 2003. https://www.aihw.gov.au/reports/heart‐stroke‐vascular‐diseases/heart‐failure‐future (viewed Apr 2023).
- 4. Chan YK, Tuttle C, Ball J, et al. Current and projected burden of heart failure in the Australian adult population: a substantive but still ill‐defined major health issue. BMC Health Serv Res 2016; 16: 501.
- 5. Labrosciano C, Horton D, Air T, et al. Frequency, trends and institutional variation in 30‐day all‐cause mortality and unplanned readmissions following hospitalisation for heart failure in Australia and New Zealand. Eur J Heart Fail 2021; 23: 31‐40.
- 6. Massey D, Aitken LM, Wendy C. What factors influence suboptimal ward care in the acutely ill ward patient? Aust Crit Care 2008; 21: 127‐140.
- 7. van Walraven C, Bennett C, Jennings A, et al. Proportion of hospital readmissions deemed avoidable: a systematic review. CMAJ 2011; 183: E391‐E402.
- 8. Jencks SF, Williams MV, Coleman EA. Rehospitalizations among patients in the Medicare fee‐for‐service program. N Engl J Med 2009; 360: 1418‐1428.
- 9. Labrosciano C, Air T, Tavella R, et al. Readmissions following hospitalisations for cardiovascular disease: a scoping review of the Australian literature. Aust Health Rev 2020; 44: 93‐103.
- 10. Henderson T, Shepheard J, Sundararajan V. Quality of diagnosis and procedure coding in ICD‐10 administrative data. Med Care 2006; 44: 1011‐1019.
- 11. Boyd JH, Randall SM, Ferrante AM, et al. Accuracy and completeness of patient pathways: the benefits of national data linkage in Australia. BMC Health Serv Res 2015; 15: 312.
- 12. Independent Health and Aged Care Pricing Authority. National Hospital Cost Data Collection. 2024. https://www.ihacpa.gov.au/health‐care/costing/national‐hospital‐cost‐data‐collection (viewed July 2024).
- 13. Independent Health and Aged Care Pricing Authority. AR‐DRGs. 2024. https://www.ihacpa.gov.au/health‐care/classification/admitted‐acute‐care/ar‐drgs (viewed July 2024).
- 14. Bureau of Health Information (NSW). Spotlight on measurement. Return to acute care following hospitalisation: spotlight on readmissions. Sydney: BHI, 2015. https://www.bhi.nsw.gov.au/__data/assets/pdf_file/0006/275271/0065_Readmission_Spotlight_web2.pdf (viewed Apr 2023).
- 15. Australian Commission on Safety and Quality in Healthcare. Hospital‐acquired complications (HACs) list; version 3.1. Mar 2021. https://www.safetyandquality.gov.au/our‐work/indicators/hospital‐acquired‐complications (viewed Apr 2023).
- 16. Vroomen JM, Eekhout I, Dijkgraaf MG, et al. Multiple imputation strategies for zero‐inflated cost data in economic evaluations: which method works best? Eur J Health Econ 2016; 17: 939‐950.
- 17. Azur MJ, Stuart EA, Frangakis C, Leaf PJ. Multiple imputation by chained equations: what is it and how does it work? Int J Methods Psychiatr Res 2011; 20: 40‐49.
- 18. Sterne JAC, White IR, Carlin JB, et al. Multiple imputation for missing data in epidemiological and clinical research: potential and pitfalls. BMJ 2009; 338: b2393.
- 19. Ciminata G, Geue C, Langhorne P, Wu O. A two‐part model to estimate inpatient, outpatient, prescribing and care home costs associated with atrial fibrillation in Scotland. BMJ Open 2020; 10: e028575.
- 20. Pope GC, Kautter J, Ellis RP, et al. Risk adjustment of Medicare capitation payments using the CMS‐HCC model. Health Care Financ Rev 2004; 25(4): 119‐141.
- 21. von Elm E, Altman DG, Egger M, et al; STROBE Initiative. The Strengthening the Reporting of Observational Studies in Epidemiology (STROBE) statement: guidelines for reporting observational studies. Lancet 2007; 370: 1453‐1457.
- 22. Lahewala S, Arora S, Tripathi B, et al. Heart failure: same‐hospital vs. different‐hospital readmission outcomes. Int J Cardiol 2019; 278: 186‐191.
- 23. Kwok CS, Abramov D, Parwani P, et al. Cost of inpatient heart failure care and 30‐day readmissions in the United States. Int J Cardiol 2021; 329: 115‐122.
- 24. Alvarez PA, Briasoulis A, Malik AH. Frequency and impact of infectious disease conditions diagnosed during decompensated heart failure hospitalizations in the United States. Am J Cardiol 2023; 191: 1‐7.
- 25. Forster AJ, Clark HD, Menard A, et al. Adverse events among medical patients after discharge from hospital. CMAJ 2004; 170: 345‐349.
- 26. Hansen LO, Young RS, Hinami K, et al. Interventions to reduce 30‐day rehospitalization: a systematic review. Ann Intern Med 2011; 155: 520‐528.
- 27. Leppin AL, Gionfriddo MR, Kessler M, et al. Preventing 30‐day hospital readmissions: a systematic review and meta‐analysis of randomized trials. JAMA Intern Med 2014; 174: 1095‐1107.
- 28. Bradley EH, Curry L, Horwitz LI, et al. Hospital strategies associated with 30‐day readmission rates for patients with heart failure. Circ Cardiovasc Qual Outcomes 2013; 6: 444‐450.
- 29. Inglis SC, Clark RA, Dierckx R, et al. Structured telephone support or non‐invasive telemonitoring for patients with heart failure. Cochrane Database Syst Rev 2015; CD007228.
- 30. Nuckols TK, Keeler E, Morton S, et al. Economic evaluation of quality improvement interventions designed to prevent hospital readmission: a systematic review and meta‐analysis. JAMA Intern Med 2017; 177: 975‐985.
- 31. Jack BW, Chetty VK, Anthony D, et al. A reengineered hospital discharge program to decrease rehospitalization: a randomized trial. Ann Intern Med 2009; 150: 178‐187.
- 32. Patel PH, Dickerson KW. Impact of the Implementation of project re‐engineered discharge for heart failure patients at a Veterans affairs hospital at the central Arkansas Veterans healthcare system. Hosp Pharm 2018; 53: 266‐271.
- 33. Lala A, McNulty SE, Mentz RJ, et al. Relief and recurrence of congestion during and after hospitalization for acute heart failure: insights from Diuretic Optimization Strategy Evaluation in Acute Decompensated Heart Failure (DOSE‐AHF) and Cardiorenal Rescue Study in Acute Decompensated Heart Failure (CARESS‐HF). Circ Heart Fail 2015; 8: 741‐748.
- 34. Cox ZL, Nandkeolyar S, Johnson AJ, et al. In‐hospital initiation and up‐titration of guideline‐directed medical therapies for heart failure with reduced ejection fraction. Card Fail Rev 2022; 8: e21.
- 35. Newton PJ, Davidson PM, Reid CM, et al. Acute heart failure admissions in New South Wales and the Australian Capital Territory: the NSW HF Snapshot Study. Med J Aust 2016; 204: 113. https://www.mja.com.au/journal/2016/204/3/acute‐heart‐failure‐admissions‐new‐south‐wales‐and‐australian‐capital‐territory
- 36. Howard R, Sanders R, Lydall‐Smith SM. The implementation of Restoring Health: a chronic disease model of care to decrease acute health care utilization. Chron Respir Dis 2008; 5: 133‐141.
- 37. Wan CS, Mitchell J, Maier AB. A multidisciplinary, community‐based program to reduce unplanned hospital admissions. J Am Med Dir Assoc 2021; 22: 1331.
- 38. McIlvennan CK, Eapen ZJ, Allen LA. Hospital readmissions reduction program. Circulation 2015; 131: 1796‐1803.
- 39. Desai NR, Ross JS, Kwon JY, et al. Association between hospital penalty status under the hospital readmission reduction program and readmission rates for target and nontarget conditions. JAMA 2016; 316: 2647‐2656.
- 40. Pandey A, Golwala H, Xu H, et al. Association of 30‐day readmission metric for heart failure under the hospital readmissions reduction program with quality of care and outcomes. JACC Heart Fail 2016; 4: 935‐946.
- 41. Independent Hospital Pricing Authority. Pricing and funding for safety and quality. Risk adjusted model for avoidable hospital readmissions: national efficient price determination 2022–23. 23 Mar 2022. https://www.ihacpa.gov.au/resources/national‐efficient‐price‐determination‐2022‐23 (viewed Aug 2024).
Abstract
Objectives: To assess the direct hospital costs for unplanned re‐admissions within 30 days of hospitalisations with heart failure in Australia; to estimate the proportion of these costs attributable to potentially preventable re‐admissions.
Study design: Retrospective cohort study; analysis of linked admitted patient data collections data.
Setting, participants: People admitted to hospital (all public and most private hospitals in Australia) with primary diagnoses of heart failure, 1 January 2013 – 31 December 2017, who were discharged alive and re‐admitted to hospital at least once (any cause) within 30 days of discharge.
Main outcome measures: Estimated re‐admission costs based on National Hospital Cost Data Collection, by unplanned re‐admission category based on the primary re‐admission diagnosis: potentially hospital‐acquired condition; recurrence of heart failure; other diagnoses related to heart failure; all other diagnoses. The first two groups were deemed the most preventable.
Results: The 165 612 eligible hospitalisations of people with heart failure during 2013–2017 (mean age, 79 years [standard deviation, 12 years]; 85 964 men [51.9%]) incurred direct hospital costs of $1881.4 million (95% confidence interval [CI], $1872.5–1890.2 million), or $376.3 million per year (95% CI, $374.5–378.1 million per year) and $11 360 per patient (95% CI, $11 312–11 408 per patient). A total of 41 125 people (24.8%) experienced a total of 58 977 unplanned re‐admissions within 30 days of discharge from index admissions; these re‐admissions incurred direct hospital costs of $604.4 million (95% CI, $598.2–610.5 million), or 32% of total index admission costs; that is, $120.9 million per year (95% CI, $119.6–122.1 million per year), and $14 695 per patient (95% CI, $14 535–14 856 per patient). Re‐admissions with potentially hospital‐acquired conditions (21 641 re‐admissions) accounted for 40.1% of unplanned re‐admission costs, recurrence of heart failure (18 666 re‐admissions) for 35.6% of re‐admission costs.
Conclusion: Unplanned re‐admissions after hospitalisations with heart failure are expensive, incurring costs equivalent to 32% of those for the initial hospitalisations; a large proportion of these costs are associated with potentially preventable re‐admissions. Reducing the number of unplanned re‐admissions could improve outcomes for people with heart failure and reduce hospital costs.