


The known: Public health campaigns were initiated more than 40 years ago to reduce the risk of melanoma in Australia. Recent declines in melanoma incidence among young Australians have been interpreted as evidence of success, but the declines could be explained by the increasing population proportion of migrants at low risk of melanoma.
The new: Our modelling indicates that the incidence of melanoma may be falling among people under 35 years of age in Australia, including those with high ancestral risk of melanoma.
The implications: Migration may have had an impact on the incidence of melanoma among younger Australians, but social changes may also have contributed to its decline.
Cutaneous melanoma, an invasive cancer of the pigment‐producing cells of the skin, is caused by ultraviolet radiation, chiefly from sunlight. Its incidence varies widely across the world. Rates of cutaneous melanoma in populations with majority African, Asian, Pacific Islander, or native American ancestry are an order of magnitude lower than among people with majority European ancestry, despite their exposure to higher intensity solar radiation,1 because of the photo‐protective effects of melanin distributed in the epidermis.2
The incidence of melanoma is extremely high in Australia.3,4,5 In response to the growing death toll of the disease,6 a series of public health campaigns for reducing sun exposure, launched in the 1980s,7 increased both public awareness and sun‐protective behaviour.8 It was followed by more targeted educational, recreational, and occupational interventions to further reduce sun exposure harms.9
The melanoma incidence rate has recently plateaued in Australia, although trends differ by age group;10 it rose steeply in older people but steadily fell among younger Australians during 1997–2016.11 Public health practitioners view these changes as evidence of the success of the campaigns that commenced decades ago,8 but their assessments do not take into account population changes in melanoma risk. As more than half of all people now living in Australia were either born overseas or have at least one parent who was born overseas,12 a much larger proportion than in previous generations have ancestry that places them at lower risk of melanoma than people whose ancestry is traced to the British Isles or northern Europe. It has therefore been proposed that the falling melanoma incidence among younger Australians reflects the growing proportion of people with inherently low ancestral risk,13 and that its incidence among those at highest ancestry‐based risk may have continued to rise.14 While evidence for and against these propositions has been proffered, earlier investigators could not determine the ancestral composition of each age group over time, and consequently failed to resolve the question.15,16,17
To examine whether declining melanoma incidence among younger people in Australia could be explained by declining numbers at high risk of melanoma, we modelled changes in melanoma incidence by age group among people with ancestry associated with high, moderate, or low risk of melanoma.
Methods
The key objectives of our study were:
- to compare changes in the incidence of invasive melanoma in Australia with estimates for other countries;
- to estimate the incidence of melanoma in Australia among people with ancestry associated with low, moderate, or high risk of melanoma, by 5‐year age group; and
- to establish whether age‐specific incidence rates by ancestry risk group had changed over time.
We estimated the proportions of Australian residents in each age group with ancestry corresponding to low, moderate, or high risk of melanoma from census data. We applied melanoma incidence rates reported for representative ancestral populations to the moderate and low risk ancestry groups, and then deduced the incidence in the high risk group from the overall population incidence rate for each age group. We then assessed changes over time in melanoma incidence rate by ancestral risk group.
Data sources
To compare changes in age‐specific melanoma incidence rates in different countries, we obtained age‐specific melanoma incidence rates (by sex, as defined by the respective registry) during 1 January 2000 – 31 December 2018 from the Australian Institute of Health and Welfare, the New Zealand Cancer Registry, the United States National Cancer Institute SEER registry (white population only: selected as appropriate comparison for Australians at high risk), the NORDCAN registry (Sweden and Norway), and the National Cancer Registration and Analysis Service (England) (details: Supporting Information, section 1).
To estimate melanoma incidence rates in Australia by ancestry‐based risk group, we obtained the numbers of people newly diagnosed with melanoma and melanoma incidence rates by 5‐year age group in Australia from the Australian Institute of Health and Welfare for the census years 2006, 2011, 2016, and 2021 (predicted).18 We derived total population numbers for each age group from Australian Bureau of Statistics data using TableBuilder (https://www.abs.gov.au/statistics/microdata‐tablebuilder/tablebuilder), and allocated people in each age group to high, moderate, and low risk ancestry groups using the 4‐digit rubrics of the Australian Standard Classification of Cultural and Ethnic Groups19 (details: Supporting Information, section 2). People with two parents of European ancestry were classified as being at high risk of melanoma; people with two parents of sub‐Saharan African, Oceanian, or southern, central, or eastern Asian ancestry were classified as being at low risk; people for whom one parent only was of European ancestry, and those with other ancestries (eg, northern African or Middle Eastern, people of the Americas) were classified as being at moderate risk. People for whom information on the ancestry of neither parent was available were allocated to risk groups according to their country of birth as a surrogate for ancestry. As ancestry proportions differ by country of birth, we imputed missing ancestry data separately for those born in and those born outside Australia. In pre‐specified sensitivity analyses, we re‐allocated all people with missing ancestry data to the high or low risk groups.
We obtained age‐specific melanoma incidence rates for representative ancestral populations from the United States Surveillance, Epidemiology, and End Results (SEER) database (17 registries, covering 26.8% of the United States population), using SEER*Stat 8.4.1,20 for the primary analysis, and the World Health Organization/International Agency for Research on Cancer GLOBOCAN database21,22 for a sensitivity analysis. The melanoma incidence rates by ancestral risk group in the two datasets were similar (Supporting Information, table 1).
Statistical analysis
For a given year, the number of melanoma diagnoses (N) in an age group j is the sum of the numbers for each ancestral risk group:

The number of melanomas in each ancestral risk group can be expressed as the product of the age‐specific incidence rate (I) and the age group population (P):

As age‐specific melanoma rates for moderate and low risk populations are similar across the globe (that is, they vary little by country or latitude), we assumed that those rates also apply to people in Australia in the same ancestry risk category. We applied the age‐specific incidence rates in the low and moderate risk reference populations to the low and moderate risk ancestral risk groups in Australia to estimate age‐specific numbers of incident melanoma cases by 5‐year age group, then solved the incidence equation to derive the age‐specific incidence rate for the high risk ancestry group for each of the most recent four census years in Australia (2006, 2011, 2016, 2021 [predicted]).
We plotted age‐specific incidence rates over time, with confidence intervals based on the Poisson distribution. We estimated the annual average percentage change (AAPC) in age‐specific incidence using JoinPoint 4.9.0.1 (Statistical Research and Applications Branch, National Cancer Institute). All other analyses were conducted in SAS/STAT 9.4. P < 0.05 was deemed statistically significant.
Ethics approval
The human research ethics committee of the QIMR Berghofer Medical Research Institute reviewed and approved the study (P3631).
Results
In Australia, New Zealand, United States (whites only), Sweden, Norway, and England, the melanoma incidence rate for each sex increased across successive birth cohorts for people aged 60 years or older: by 1–3% per year in Australia and New Zealand, by 3–7% per year in Norway, Sweden, and England, and by 1–4% per year among United States whites. The incidence rate declined among Australian females aged 10–39 years (by 1.1–7.1% per year, by age group), New Zealand females aged 20–49 years (by 1.9–7.1% per year, by age group), and United States white females aged 15–29 years (by 1.3–3.0% per year, by age group); in Norway, Sweden, and England, incidence rates generally rose among women aged 20 years or older. Similarly, melanoma incidence declined in young males during 2000–2018 in Australia (10–39 years; 1.2–7.3% per year, by age group), New Zealand (20–49 years; 1.4–5.6% per year, by age group), and United States white males (15–29 years; by 1.5–3.9% per year, by age group), but not significantly among younger men in Norway, Sweden, or England (Box 1, Box 2; Supporting Information, figure 1).
Incidence of melanoma in Australia by ancestral risk group
The proportion of people in Australia who reported high risk (European) ancestry declined from 85.3% in 2006 to 71.1% in 2021; the proportion with moderate risk ancestry increased from 5.2% to 10.1%, and that of people with low risk ancestry increased from 9.5% to 18.8% (Box 3). We estimated that the age‐standardised melanoma incidence rate was higher for Australians with high risk ancestry (2021: males, 82.2 [95% CI, 80.5–83.8] cases per 100 000 population; females, 58.5 [95% CI, 57.0–59.9] cases per 100 000 population) than for all Australians (males, 67.8 [95% CI, 66.5–69.2] cases per 100 000 population; females, 45.4 [95% CI, 44.3–46.5] cases per 100 000 population). Estimated age‐standardised melanoma incidence rates were much lower for people with moderate (2021: males, 3.8 [95% CI, 2.3–5.4] cases per 100 000 population; females, 3.7 [95% CI, 2.4–5.0] cases per 100 000 population) or low risk ancestries (males, 0.8 [95% CI, 0.4–1.3] cases per 100 000 population; females, 0.8 [95% CI, 0.4–1.2] cases per 100 000 population) (Box 4).
Change in incidence in Australia by ancestry group
AAPCs for melanoma incidence were consistently positive for Australians aged 50 years or older, both overall and for people with high risk ancestry, but were statistically significant only for some age groups beyond 65 years of age. AAPCs were negative for people aged 34 years or younger, but were generally not statistically significant. The declines in melanoma incidence in younger age groups were slightly smaller for people with high risk ancestry than overall, and were greater for males than females in both populations, but the differences were not statistically significant (Box 5).
Sensitivity analyses
Using melanoma incidence rates for the low and moderate risk reference populations from the GLOBOCAN database yielded similar estimates of melanoma incidence among people with high risk ancestry (Supporting Information, table 5). Re‐allocating people with missing ancestry information to the low risk (Supporting Information, table 6) or high risk categories also yielded similar results (Supporting Information, table 7).
Discussion
The composition of the Australian population by ancestry has changed rapidly in recent decades. The proportion of residents who reported ancestry that places them at low or moderate risk of cutaneous melanoma increased from 14.7% in 2006 to 28.9% in 2021, and that of people with high risk ancestry fell from 85.3% to 71.1%. Our findings are consistent with the proposition that melanoma incidence data for the Australian population mask large differences between subgroups that reflect changes in the composition of the Australian population over the past few decades.
We estimated that more than 95% of melanomas in Australia in each of the four census years during 2006–2021 were diagnosed in people with high risk ancestry, reflected by age‐standardised incidence rates 21% (males) or 29% (females) higher than for the overall population in 2021. In contrast, melanoma rates for people with low and moderate risk ancestries were at least an order of magnitude lower. We also found that changes in melanoma incidence differed by age group. In the high ancestral risk group, the increase in incidence over time was, in general, statistically significant for people aged 65 years or more, whereas incidence declined among people under 35 years of age, albeit generally not statistically significantly. The overall patterns in AAPC by age group were consistent with a birth cohort effect contributing to falling melanoma rates. Declines in melanoma incidence in the younger age groups of the high ancestral risk group, although smaller than for the overall population, do not support the contention that melanoma rates have risen in this group, as proposed by some authors.14,16
What do these findings mean for public health? They suggest that the incidence of melanoma in young Australians has declined, and that this change is partially attributable to changed population composition, although the incidence has also declined among young Australians with high risk ancestry. These declines are not unique to Australia. For example, we found similar declines in melanoma incidence among the young in New Zealand, a country similar to Australia in terms of geography and lifestyle. Direct comparisons, however, are difficult because the New Zealand population is more diverse than that of Australia, with large proportions of people with Māori, Pacific Islander, or Asian ancestry, all at low to moderate risk of melanoma.24 It appears that melanoma incidence is declining among non‐Māori, non‐Pacific Islander, non‐Asian people (that is, people of largely but not exclusively European ancestry; our unpublished analysis of New Zealand Cancer Registry data), but the impact of increasing numbers of people with African or Middle Eastern ancestry is unknown. A perhaps less contentious comparison is with the white population of the United States, for which we also found declines in melanoma incidence for people of both sexes aged 25 years or younger. The magnitude of the decline during 2000–2018 (about 3% per year) was similar to our estimate for the high risk ancestry group in the Australian population over the same period.
The similar patterns of change in age‐specific melanoma incidence in Australia, the white population of the United States, and possibly New Zealand suggest population changes in ultraviolet radiation exposure in the three countries. Sun protection campaigns have been prominent in Australia for decades, but not in the United States or New Zealand; it seems unlikely that changes in these two countries are attributable to public health activities. An alternative explanation is that widespread lifestyle changes have resulted in lower levels of ultraviolet radiation exposure among young people. Surveys have identified increasing screen time and declining amounts of time spent outdoors by young people in industrialised countries, including Australia25 and the United States.26 One potential consequence of less time outdoors is myopia,27 the prevalence of which has risen rapidly among young people in recent decades,28 including in Australia.29 Childhood is a time of particular susceptibility to melanoma initiation by sunlight,30 and population reductions in childhood outdoor activities leading to changes in myopia prevalence are probably also sufficient to reduce that of melanoma. Melanoma rates among the young have continued to rise in Scandinavia and England; it has been suggested that young people from these countries have been exposed to intense sun during coastal holidays in lower latitude regions.31,32
Limitations
The census ancestry data, based on self‐reports, provide only a crude measure of melanoma risk. The census population number differs slightly from the estimated resident population;33 the latter integrates data on births, deaths, and net migration not captured by the census. Moreover, the 2021 population data were estimates rather than actual counts, which may have introduced minor errors.
As the distinctions between low and moderate risk ancestries are somewhat arbitrary, their definitions could influence our findings; however, the incidence of cutaneous melanoma is much lower in all non‐European populations than in Europeans, and our estimates of incidence for the high risk group were insensitive to the magnitude of the rates applied for the other risk groups. Our sensitivity analyses using melanoma rates for low and moderate risk ancestries in the GLOBOCAN database yielded similar findings to the primary analyses based on United States minority populations data. Assigning people of mixed ancestry to the ancestry group of the parent with the highest melanoma risk would increase the size of the high risk group and consequently reduce the effect of population composition on melanoma incidence. Our decision to assign people of mixed ancestry to categories other than high risk is consistent with United States reports of much lower melanoma incidence among Hispanic people (a multiracial group defined by ancestry34) than non‐Hispanic white people.35,36,37 Our approach was therefore conservative, minimising the potential effects of population composition on reducing melanoma incidence in the high risk group. The fact that we found declines in melanoma incidence in younger age groups in the high risk category, even after assigning people with mixed ancestry and those with missing ancestry data to the lower risk categories, suggests that our findings are unlikely to be affected by a systematic coding bias.
Conclusions
The recent decline in melanoma incidence in younger age groups is not unique to Australia, and it seems likely that behavioural changes have played a role in reducing ultraviolet radiation exposure. Our ecological analysis could not assess whether melanoma incidence rates would have declined had prevention activities not been undertaken in Australia. As most cutaneous melanomas are caused by sun exposure, sun exposure is a modifiable factor, and most Australians can be exposed to very high levels of sunlight during much of the year, there is still every reason to re‐double efforts to reduce unnecessary exposure among people at high risk of skin carcinoma.
Box 1 – Age‐specific incidence rate of invasive melanoma among people aged 10 years or older, Australia, 2000–2018, by sex*
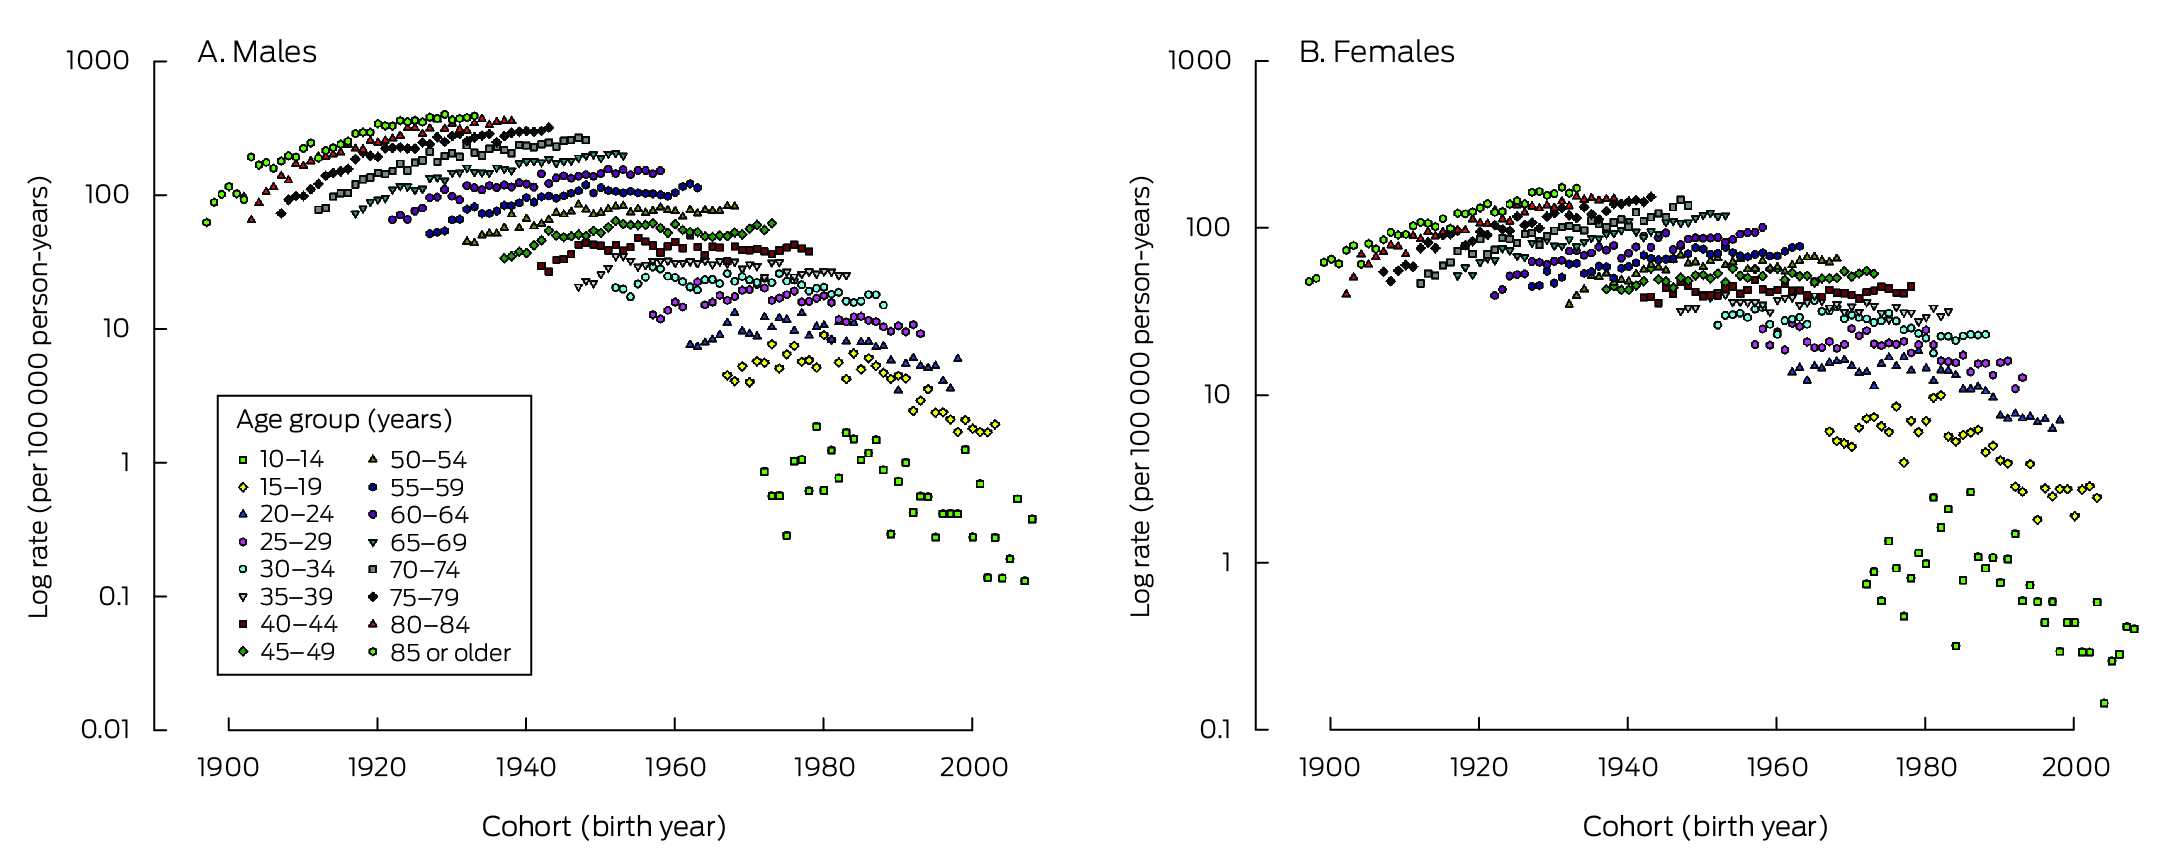
* Age‐specific incidence rates for New Zealand, United States (whites only), Sweden, Norway, and England are included in the Supporting Information, figure 1.
Box 2 – Change in age‐specific incidence rate of invasive melanoma among people aged 10 years or older in six countries, 2000–2018, by sex and age group
|
|
Average annual percentage change (95% confidence interval) |
||||||||||||||
|
Sex/age group (years) |
Australia |
New Zealand |
United States (whites only) |
Norway |
Sweden |
England |
|||||||||
|
|
|||||||||||||||
|
Males |
|
|
|
|
|
|
|||||||||
|
10–14 |
–4.2% (–9.0 to 0.8%) |
NC |
NC |
NC |
NC |
NC |
|||||||||
|
15–19 |
–7.3% (–8.5 to –6.0%) |
NC |
–3.9% (–6.4 to –1.3%) |
NC |
NC |
–3.0% (–6.0 to 0.2%) |
|||||||||
|
20–24 |
–4.9% (–6.5 to –3.4%) |
–5.6% (–9.3 to –1.7%) |
–2.7% (–4.2 to –1.2%) |
NC |
0.9% (–1.5 to 3.4%) |
–3.4% (–5.0 to –1.8%) |
|||||||||
|
25–29 |
–3.9% (–4.7 to –3.2%) |
–4.9% (–7.6 to –2.2%) |
–1.5% (–2.8 to –0.2%) |
0.8% (–2.1 to 3.8%) |
0.7% (–1.5 to 2.9%) |
–0.7% (–2.2 to 0.8%) |
|||||||||
|
30–34 |
–2.4% (–3.1 to –1.8%) |
–2.9% (–4.8 to –0.9%) |
0.3% (–0.5 to 1.1%) |
–0.7% (–3.6 to 2.3%) |
0.6% (–1.2 to 2.4%) |
0.4% (–0.8 to 1.5%) |
|||||||||
|
35–39 |
–1.2% (–1.8 to –0.7%) |
–1.7% (–3.3 to 0.0%) |
0.1% (–0.9 to 1.1%) |
2.7% (0.8 to 4.7%) |
2.3% (1.0 to 3.6%) |
0.8% (–0.4 to 2.0%) |
|||||||||
|
40–44 |
–0.5% (–1.3 to 0.2%) |
–2.7% (–3.8 to –1.6%) |
–0.9% (–1.5 to –0.2%) |
3.8% (1.6 to 6.0%) |
2.9% (1.7 to 4.2%) |
1.0% (–0.1 to 2.0%) |
|||||||||
|
45–49 |
–0.3% (–1.0 to 0.5%) |
–1.4% (–2.8 to –0.1%) |
–0.3% (–1.1 to 0.4%) |
1.7% (0.6 to 2.7%) |
4.3% (3.3 to 5.4%) |
2.7% (1.9 to 3.4%) |
|||||||||
|
50–54 |
0.0% (–0.4 to 0.5%) |
–0.3% (–1.1 to 0.4%) |
0.6% (0.1 to 1.1%) |
2.6% (1.1 to 4.0%) |
3.9% (3.1 to 4.7%) |
3% (2.3 to 3.8%) |
|||||||||
|
55–59 |
0.2% (–0.3 to 0.8%) |
–0.6% (–1.7 to 0.5%) |
0.8% (0.2 to 1.3%) |
3.2% (1.9 to 4.5%) |
3.6% (2.6 to 4.5%) |
3.2% (2.6 to 3.8%) |
|||||||||
|
60–64 |
1.1% (0.6 to 1.6%) |
0.4% (–0.6 to 1.3%) |
1.2% (0.6 to 1.9%) |
2.9% (2.1 to 3.7%) |
3.3% (2.3 to 4.4%) |
3.7% (2.8 to 4.6%) |
|||||||||
|
65–69 |
1.6% (1.2 to 1.9%) |
0.4% (–0.5 to 1.3%) |
2.1% (1.4 to 2.8%) |
3.8% (2.4 to 5.1%) |
4.0% (3.1 to 4.9%) |
5.0% (4.1 to 5.9%) |
|||||||||
|
70–74 |
1.4% (1.0 to 1.9%) |
1.4% (0.6 to 2.2%) |
3.2% (2.7 to 3.6%) |
5.4% (4.4 to 6.3%) |
4.6% (3.6 to 5.6%) |
5.7% (4.8 to 6.6%) |
|||||||||
|
75–79 |
1.4% (0.9 to 1.8%) |
1.6% (1.0 to 2.3%) |
3.2% (2.6 to 3.7%) |
5.7% (4.3 to 7.1%) |
5.5% (4.9 to 6.2%) |
6.8% (6.1 to 7.5%) |
|||||||||
|
80–84 |
1.6% (1.0 to 2.3%) |
2.1% (0.9 to 3.2%) |
4.1% (3.5 to 4.6%) |
5.9% (4.9 to 7.0%) |
5.0% (4.1 to 5.9%) |
6.1% (5.2 to 7.0%) |
|||||||||
|
85 or older |
2.0% (1.4 to 2.6%) |
3.2% (2.2 to 4.2%) |
3.9% (3.0 to 4.8%) |
6.9% (5.5 to 8.3%) |
4.9% (4.1 to 5.7%) |
5.4% (4.1 to 6.8%) |
|||||||||
|
Females |
|
|
|
|
|
|
|||||||||
|
10–14 |
–7.1% (–10.1 to –4.1%) |
NC |
NC |
NC |
NC |
NC |
|||||||||
|
15–19 |
–5.6% (–7.1 to –4.0%) |
NC |
–3.0% (–5.2 to –0.8%) |
–0.9% (–5.9 to 4.4%) |
5.5% (–0.9 to 12.4%) |
–2.3% (–5.0 to 0.5%) |
|||||||||
|
20–24 |
–4.7% (–5.5 to –4.0%) |
–7.1% (–9.7 to –4.4%) |
–2.3% (–3.7 to –0.9%) |
0.8% (–2.0 to 3.6%) |
2.5% (–0.8 to 5.8%) |
–0.4% (–2.1 to 1.2%) |
|||||||||
|
25–29 |
–2.8% (–3.8 to –1.8%) |
–5.7% (–8.0 to –3.3%) |
–1.3% (–2.4 to –0.1%) |
0.8% (–1.0 to 2.7%) |
1.3% (–0.6 to 3.2%) |
0.9% (–0.7 to 2.4%) |
|||||||||
|
30–34 |
–1.9% (–2.6 to –1.1%) |
–4.6% (–5.9 to –3.3%) |
0.5% (–0.1 to 1.1%) |
–0.3% (–1.9 to 1.3%) |
2.9% (1.1 to 4.6%) |
1.8% (0.5 to 3.1%) |
|||||||||
|
35–39 |
–1.1% (–1.7 to –0.5%) |
–1.9% (–3.5 to –0.2%) |
1.2% (0.3 to 2.1%) |
1.3% (–0.1 to 2.7%) |
3.6% (1.4 to 5.8%) |
2.3% (0.9 to 3.6%) |
|||||||||
|
40–44 |
–0.1% (–0.6 to 0.4%) |
–1.6% (–2.9 to –0.4%) |
0.6% (0.1 to 1.1%) |
3.0% (2.0 to 4.0%) |
5.0% (3.5 to 6.6%) |
3.3% (2.1 to 4.5%) |
|||||||||
|
45–49 |
0.0% (–0.5 to 0.4%) |
–2.7% (–3.5 to –1.9%) |
1.5% (0.9 to 2.0%) |
3.8% (2.7 to 4.8%) |
5.4% (4.4 to 6.4%) |
3.5% (2.7 to 4.4%) |
|||||||||
|
50–54 |
0.3% (–0.2 to 0.8%) |
–1.6% (–2.5 to –0.6%) |
1.8% (1.0 to 2.7%) |
4.3% (2.9 to 5.6%) |
4.1% (3.3 to 5.0%) |
3.1% (2.3 to 3.8%) |
|||||||||
|
55–59 |
0.2% (–0.3 to 0.7%) |
0.1% (–1.0 to 1.2%) |
2.1% (1.6 to 2.7%) |
3.2% (2.1 to 4.4%) |
3.2% (2.4 to 4.1%) |
2.6% (2.1 to 3.2%) |
|||||||||
|
60–64 |
1.1% (0.5 to 1.7%) |
1.0% (–0.1 to 2.1%) |
3.0% (2.3 to 3.7%) |
2.8% (2.0 to 3.6%) |
4.0% (3.0 to 5.1%) |
3.2% (2.4 to 4.1%) |
|||||||||
|
65–69 |
1.9% (1.4 to 2.4%) |
0.3% (–0.7 to 1.2%) |
2.9% (2.3 to 3.4%) |
3.6% (2.1 to 5.2%) |
4.2% (3.3 to 5.1%) |
4.3% (3.8 to 4.9%) |
|||||||||
|
70–74 |
2.0% (1.5 to 2.6%) |
1.1% (0.2 to 2.0%) |
2.9% (2.2 to 3.6%) |
5.0% (4.0 to 6.1%) |
5.3% (4.3 to 6.4%) |
5.0% (4.6 to 5.4%) |
|||||||||
|
75–79 |
1.9% (1.3 to 2.5%) |
1.0% (0.1 to 1.9%) |
3.1% (2.0 to 4.1%) |
4.5% (3.3 to 5.8%) |
5.2% (4.1 to 6.3%) |
4.8% (4.4 to 5.2%) |
|||||||||
|
80–84 |
1.8% (1.3 to 2.3%) |
1.6% (0.4 to 2.8%) |
3.4% (2.6 to 4.2%) |
5.4% (3.9 to 6.9%) |
5.0% (3.8 to 6.2%) |
4.8% (4.3 to 5.4%) |
|||||||||
|
85 or older |
2.6% (2.0 to 3.1%) |
1.9% (0.5 to 3.3%) |
4.3% (3.6 to 5.0%) |
6.0% (4.8 to 7.2%) |
NC |
4.8% (3.6 to 5.9%) |
|||||||||
|
|
|||||||||||||||
|
NC = not calculable (no cases in some years). |
|||||||||||||||
Box 3 – Australian population (all ages): inferred ancestry‐based melanoma risk group, by census year and sex*
|
Census year |
Total number |
High risk ancestry |
Moderate risk ancestry |
Low risk ancestry |
|||||||||||
|
|
|||||||||||||||
|
2006 |
19 806 114 |
16 889 230 (85.3%) |
1 027 724 (5.2%) |
1 889 160 (9.5%) |
|||||||||||
|
Females |
10 031 167 |
8 531 184 |
515 226 |
984 757 |
|||||||||||
|
Males |
9 774 947 |
8 358 046 |
512 498 |
904 403 |
|||||||||||
|
2011 |
21 449 637 |
17 508 747 (81.6%) |
1 274 596 (5.9%) |
2 666 294 (12.4%) |
|||||||||||
|
Females |
10 844 334 |
8 827 689 |
636 819 |
1 379 826 |
|||||||||||
|
Males |
10 605 303 |
8 681 058 |
637 777 |
1 286 468 |
|||||||||||
|
2016 |
23 324 999 |
18 216 587 (78.1%) |
1 473 368 (6.3%) |
3 635 044 (15.6%) |
|||||||||||
|
Females |
11 816 489 |
9 193 563 |
735 200 |
1 887 726 |
|||||||||||
|
Males |
11 508 510 |
9 023 024 |
738 168 |
1 747 318 |
|||||||||||
|
2021 |
25 331 039 |
18 005 849 (71.1%) |
2 564 102 (10.1%) |
4 761 088 (18.8%) |
|||||||||||
|
Females |
12 830 404 |
9 072 781 |
1 287 902 |
2 469 721 |
|||||||||||
|
Males |
12 500 635 |
8 933 068 |
1 276 200 |
2 291 367 |
|||||||||||
|
|
|||||||||||||||
|
* The proportions by census year, sex, and age are reported in the Supporting Information, table 2. |
|||||||||||||||
Box 4 – Numbers of cases and age‐standardised incidence rates of invasive cutaneous melanoma (per 100 000 population), Australia, by inferred ancestry‐based melanoma risk group, census year, and sex
|
|
Total population |
High risk ancestry |
Moderate risk ancestry* |
Low risk ancestry† |
|||||||||||
|
Census year |
Age‐standardised incidence rate‡ (95% CI) |
Cases§ |
Age‐standardised incidence rate‡ (95% CI) |
Cases§ |
Age‐standardised incidence rate‡ (95% CI) |
Cases§ |
Age‐standardised incidence rate‡ (95% CI) |
||||||||
|
|
|||||||||||||||
|
2006 |
|
|
|
|
|
|
|
||||||||
|
Females |
39.4 (38.3–40.6) |
4309 |
44.4 (43.1–45.8) |
14 |
4.2 (1.8–6.7) |
6 |
0.8 (0.1–1.6) |
||||||||
|
Males |
61.8 (60.3–63.4) |
6089 |
67.8 (66.1–69.5) |
13 |
5.3 (1.9–8.6) |
9 |
1.9 (0.5–3.4) |
||||||||
|
2011 |
|
|
|
|
|
|
|
||||||||
|
Females |
39.7 (38.6–59.2) |
4822 |
45.8 (44.5–47.1) |
19 |
4.5 (2.3–6.8) |
14 |
1.4 (0.5–2.8) |
||||||||
|
Males |
60.6 (59.2–62.1) |
6782 |
67.9 (66.2–69.5) |
16 |
4.8 (2.2–7.5) |
10 |
1.6 (0.5–2.8) |
||||||||
|
2016 |
|
|
|
|
|
|
|
||||||||
|
Females |
43.7 (42.6–44.9) |
6025 |
52.5 (51.2–53.9) |
22 |
4.3 (2.4–6.2) |
13 |
0.9 (0.4–1.5) |
||||||||
|
Males |
66.3 (64.9–67.8) |
8496 |
76.2 (74.6–77.9) |
21 |
4.8 (2.5–7.1) |
13 |
1.3 (0.5–2.1) |
||||||||
|
2021 |
|
|
|
|
|
|
|
||||||||
|
Females |
45.4 (44.3–46.5) |
7091 |
58.5 (57.0–59.9) |
33 |
3.7 (2.4–5.0) |
18 |
0.8 (0.4–1.2) |
||||||||
|
Males |
67.8 (66.5–69.2) |
10 024 |
82.2 (80.5–83.8) |
27 |
3.8 (2.3–5.4) |
14 |
0.8 (0.4–1.3) |
||||||||
|
|
|||||||||||||||
|
* Derived from SEER (17 registries) age‐specific incidence rates for Hispanics/any race17 and Australian census‐based age‐specific population numbers (Australian Bureau of Statistics TableBuilder: https://www.abs.gov.au/statistics/microdata‐tablebuilder/tablebuilder). † Derived from SEER (17 registries) age‐specific incidence rates for non‐Hispanic Asians/Pacific Islanders and Blacks,17 and Australian census‐based age‐specific population numbers (Australian Bureau of Statistics TableBuilder: https://www.abs.gov.au/statistics/microdata‐tablebuilder/tablebuilder). ‡ Age‐standardised to the United States 2000 standard population (2000).23 § Case numbers by census year, sex, and age are reported in the Supporting Information, table 3. |
|||||||||||||||
Box 5 – Average annual percentage change (with 95% confidence interval) in incidence of invasive cutaneous melanoma, Australia, 2006–2021, by age group and sex: overall and for people with high risk ancestry*
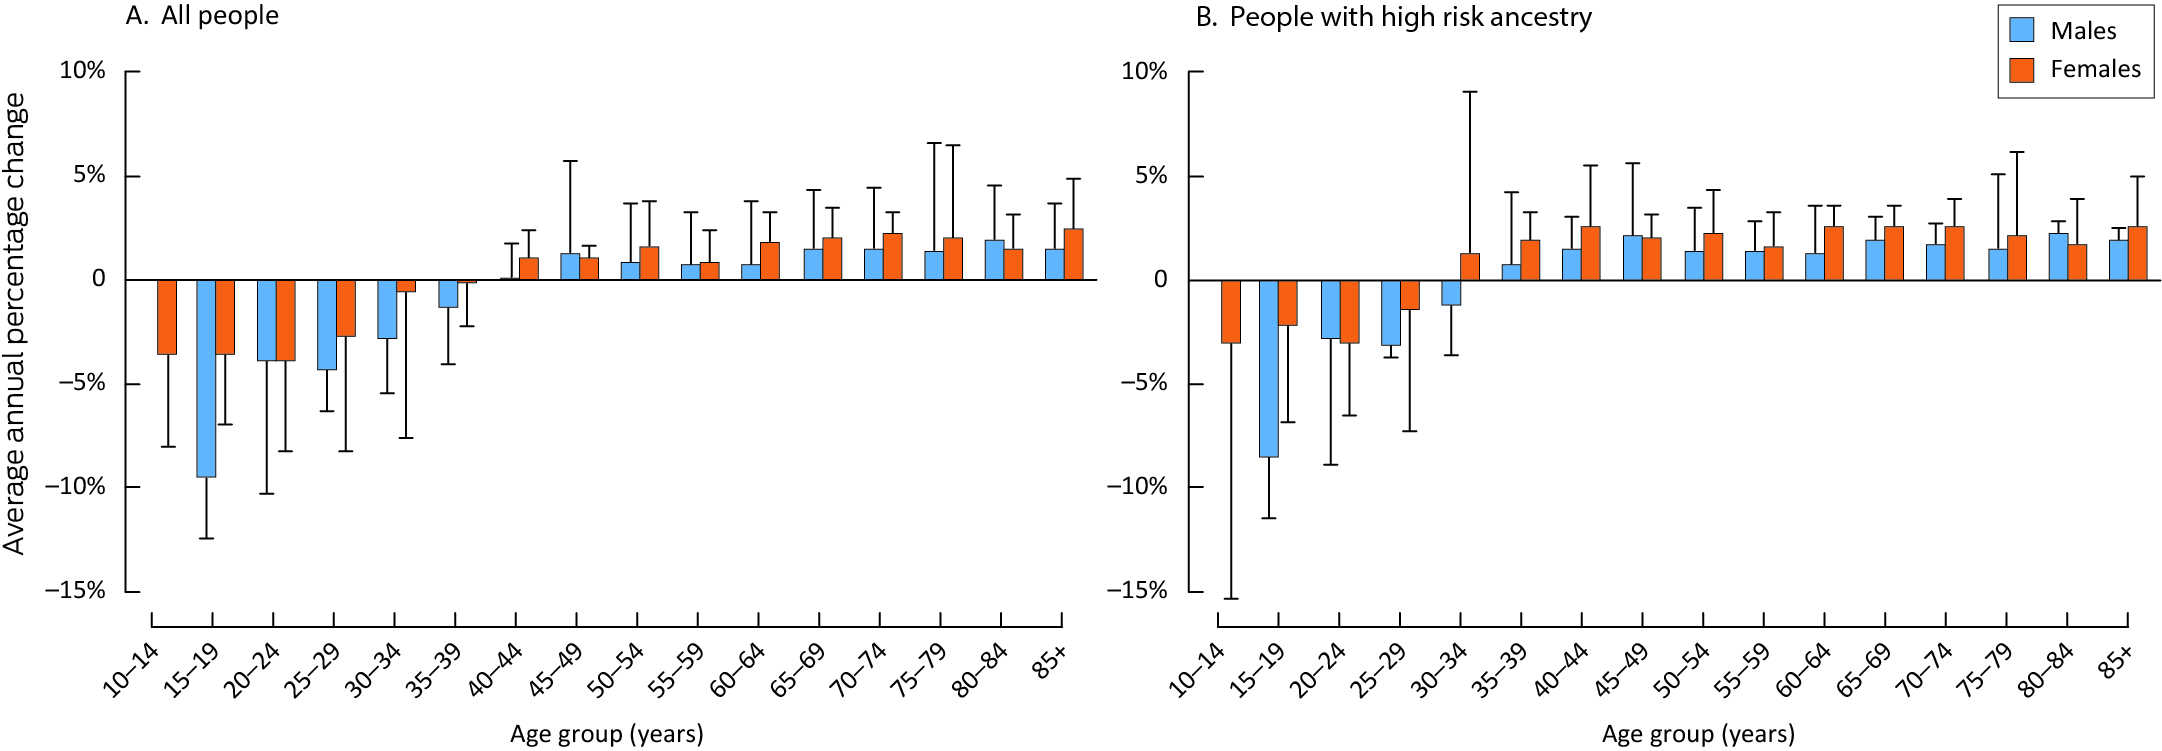
* The data underlying this figure are included in the Supporting Information, table 4. There were no cases in some years for boys aged 10–14 years.
Received 15 January 2024, accepted 20 April 2024
- David C Whiteman1
- Rachel E Neale1
- Peter Baade2
- Catherine M Olsen1
- Nirmala Pandeya1
- 1 QIMR Berghofer Medical Research Institute, Brisbane, QLD
- 2 Cancer Council Queensland, Brisbane, QLD
Open access:
Open access publishing facilitated by the University of Queensland, as part of the Wiley – the University of Queensland agreement via the Council of Australian University Librarians.
Data sharing:
The data analysed in this study are available on request from each of the national cancer registries.
The study was funded in part by the National Health and Medical Research Council (NHMRC; APP1185416). David Whiteman is supported by an NHMRC Research Fellowship (APP1155413). The funding source played no role in the study design, data collection, analysis or interpretation, reporting or publication.
David Whiteman has received honoraria and travel reimbursements for speaking at dermatology and oncology conferences.
- 1. Arnold M, Singh D, Laversanne M, et al. Global burden of cutaneous melanoma in 2020 and projections to 2040. JAMA Dermatol 2022; 158: 495‐503.
- 2. Fajuyigbe D, Lwin SM, Diffey BL, et al. Melanin distribution in human epidermis affords localized protection against DNA photodamage and concurs with skin cancer incidence difference in extreme phototypes. FASEB J 2018; 32: 3700‐3706.
- 3. Whiteman DC, Green AC, Olsen CM. The growing burden of invasive melanoma: projections of incidence rates and numbers of new cases in six susceptible populations through 2031. J Invest Dermatol 2016; 136: 1161‐1171.
- 4. Lancaster HO. Some geographical aspects of the mortality from melanoma in Europeans. Med J Aust 1956; 43: 1082‐1087.
- 5. Davis NC. Sunlight and melanomas. Lancet 1971; 1: 803.
- 6. Holman CD, James IR, Gattey PH, Armstrong BK. An analysis of trends in mortality from malignant melanoma in Australia. Int J Cancer 1980; 26: 703‐709.
- 7. Walker H, Maitland C, Tabbakh T, et al. Forty years of Slip! Slop! Slap! A call to action on skin cancer prevention for Australia. Public Health Res Pract 2022; 32: 31452117.
- 8. Tabbakh T, Volkov A, Wakefield M, Dobbinson S. Implementation of the SunSmart program and population sun protection behaviour in Melbourne, Australia: results from cross‐sectional summer surveys from 1987 to 2017. PLoS Med 2019; 16: e1002932.
- 9. Iannacone MR, Green AC. Towards skin cancer prevention and early detection: evolution of skin cancer awareness campaigns in Australia. Melanoma Manag 2014; 1: 75‐84.
- 10. Olsen CM, Green AC, Pandeya N, Whiteman DC. Trends in melanoma incidence rates in eight susceptible populations through 2015. J Invest Dermatol 2019; 139: 1392‐1395.
- 11. Venugopal K, Youlden D, Marvelde LT, et al. Twenty years of melanoma in Victoria, Queensland, and South Australia (1997–2016). Cancer Epidemiol 2023; 83: 102321.
- 12. Australian Bureau of Statistics. Snapshot of Australia. A picture of the economic, social and cultural make‐up of Australia on Census Night, 10 August 2021. 28 June 2022. https://www.abs.gov.au/statistics/people/people‐and‐communities/snapshot‐australia/latest‐release (viewed July 2023).
- 13. Czarnecki D, Meehan CJ. Is the incidence of malignant melanoma decreasing in young Australians? J Am Acad Dermatol 2000; 42: 672‐674.
- 14. Czarnecki D. The incidence of melanoma is increasing in the susceptible young Australian population. Acta Derm Venereol 2014; 94: 539‐541.
- 15. Baade PD, Youlden DR, Youl P et al. Assessment of the effect of migration on melanoma incidence trends in Australia between 1982 and 2010 among people under 30. Acta Derm Venereol 2015; 95: 118‐120.
- 16. Czarnecki DD. Immigration is the most likely reason for the generational change in melanoma incidence in Queensland, Australia [letter]. Int J Cancer 2018; 143: 720‐721.
- 17. Aitken JF, Youlden DR, Baade PD et al. In response to: Immigration is the most likely reason for the generational change in melanoma incidence in Queensland, Australia [letter]. Int J Cancer 2018; 143: 722‐723.
- 18. Australian Institute of Health and Welfare. Data tables: CDIA 2023: Book 1a. Cancer incidence (age‐standardised rates and 5‐year age groups). In: Cancer data in Australia. Updated 31 Aug 2023. https://www.aihw.gov.au/reports/cancer/cancer‐data‐in‐australia/data (viewed Nov 2023).
- 19. Australian Bureau of Statistics. Australian Standard Classification of Cultural and Ethnic Groups (ASCCEG). 18 Dec 2019. https://www.abs.gov.au/statistics/classifications/australian‐standard‐classification‐cultural‐and‐ethnic‐groups‐ascceg/latest‐release (viewed July 2023).
- 20. Surveillance, Epidemiology, and End Results (SEER) Program. SEER*Stat Database: Incidence – seer research data, 17 registries, Nov 2022 Sub (2000–2020) – linked to county attributes – time dependent (1990–2021) income/rurality, 1969‐2020 counties, National Cancer Institute, Surveillance Research Program, released April 2023, based on the November 2022 submission. https://seer.cancer.gov/seerstat (viewed July 2023).
- 21. Bray F, Ferlay J, Soerjomataram I, et al. Global cancer statistics 2018: GLOBOCAN estimates of incidence and mortality worldwide for 36 cancers in 185 countries. CA Cancer J Clin 2018; 68: 394‐424.
- 22. International Agency for Research on Cancer (World Health Organization). Global Cancer Observatory: Cancer over time. https://gco.iarc.fr/overtime (viewed July 2023).
- 23. Anderson RN, Rosenberg HM. Age standardization of death rates: implementation of the year 2000 standard. Natl Vital Stat Rep 1998; 47: 1‐16, 20.
- 24. Stats NZ. Estimated resident population (ERP) at 30 June 2018. https://statsnz.maps.arcgis.com/apps/MapSeries/index.html?appid=ab954d1f2e7a446a8a0195ccea440b85 (viewed Nov 2023).
- 25. Yu M, Baxter J. Australian children's screen time and participation in extracurricular activities. In: The Longitudinal Study of Australian Children annual statistical report 2015. Sept 2016. https://growingupinaustralia.gov.au/research‐findings/annual‐statistical‐report‐2015/australian‐childrens‐screen‐time‐and‐participation‐extracurricular (viewed Sept 2023).
- 26. Yang L, Cao C, Kantor ED, et al. Trends in sedentary behavior among the US population, 2001–2016. JAMA 2019; 321: 1587‐1597.
- 27. French AN, Ashby RS, Morgan IG, Rose KA. Time outdoors and the prevention of myopia. Exp Eye Res 2013; 114: 58‐68.
- 28. Dolgin E. The myopia boom. Nature 2015; 519: 276‐278.
- 29. French AN, Morgan IG, Burlutsky G, et al. Prevalence and 5‐ to 6‐year incidence and progression of myopia and hyperopia in Australian schoolchildren. Ophthalmology 2013; 120: 1482‐1491.
- 30. Whiteman DC, Whiteman CA, Green AC. Childhood sun exposure as a risk factor for melanoma: a systematic review of epidemiologic studies. Cancer Causes Control 2001; 12: 69‐82.
- 31. Petersen B, Triguero‐Mas M, Maier B, et al. Sun behaviour and personal UVR exposure among Europeans on short term holidays. J Photochem Photobiol B 2015; 151: 264‐269.
- 32. Memon A, Banniser P, Rogers I, et al. Changing epidemiology and age‐specific incidence of cutaneous malignant melanoma in England: an analysis of the national cancer registration data by age, gender and anatomical site, 1981–2018. Lancet Reg Health Eur 2021; 2: 100024.
- 33. Australian Bureau of Statistics. Measuring net undercount in the 2006 population census [information paper; 2940.0.55.001]. 7 May 2007. https://www.abs.gov.au/AUSSTATS/abs@.nsf/Lookup/2940.0.55.001Main+Features12007?OpenDocument (viewed July 2024).
- 34. United States Census Bureau. US Census Bureau guidance on the presentation and comparison of race and Hispanic origin data. 3 Dec 2021. https://www.census.gov/topics/population/hispanic‐origin/about/comparing‐race‐and‐hispanic‐origin.html (viewed July 2023).
- 35. Hu S, Parmet Y, Allen G, et al. Disparity in melanoma: a trend analysis of melanoma incidence and stage at diagnosis among whites, Hispanics, and blacks in Florida. Arch Dermatol 2009; 145: 1369‐1374.
- 36. Wang Y, Zhao Y, Ma S. Racial differences in six major subtypes of melanoma: descriptive epidemiology. BMC Cancer 2016; 16: 691.
- 37. Clairwood M, Ricketts J, Grant‐Kels J, Gonsalves L. Melanoma in skin of color in Connecticut: an analysis of melanoma incidence and stage at diagnosis in non‐Hispanic blacks, non‐Hispanic whites, and Hispanics. Int J Dermatol 2014; 53: 425‐433.
Abstract
Objectives: To estimate the incidence of melanoma in Australia among people with ancestries associated with low, moderate, or high risk of melanoma, by sex and 5‐year age group; to establish whether age‐specific incidence rates by ancestry risk group have changed over time.
Study design: Modelling study; United States (SEER database) melanoma incidence rates for representative ancestral populations and Australian census data (2006, 2011, 2016, 2021) used to estimate Australian melanoma incidence rates by ancestry‐based risk.
Setting, participants: Australia, 2006–2021.
Main outcome measures: Age‐specific invasive melanoma incidence rates, and average annual percentage change (AAPC) in age‐specific melanoma rates, by ancestry‐based risk group, sex, and 5‐year age group.
Results: The proportion of people in Australia who reported high risk (European) ancestry declined from 85.3% in 2006 to 71.1% in 2021. The estimated age‐standardised melanoma incidence rate was higher for people with high risk ancestry (2021: males, 82.2 [95% confidence interval {CI}, 80.5–83.8] cases per 100 000 population; females, 58.5 [95% CI, 57.0–59.9] cases per 100 000 population) than for all Australians (males, 67.8 [95% CI, 66.5–69.2] cases per 100 000 population; females, 45.4 [95% CI, 44.3–46.5] cases per 100 000 population). AAPCs were consistently positive for Australians aged 50 years or older, both overall and for people with high risk ancestry, but were statistically significant only for some age groups beyond 65 years. AAPCs were negative for people aged 34 years or younger, but were generally not statistically significant.
Conclusions: Melanoma incidence has declined in some younger age groups in Australia, including among people with high risk ancestry. Social and behavioural changes over the same period that lead to lower levels of ultraviolet radiation exposure probably contributed to these changes.