


The known: Multiple myeloma is a relatively rare cancer, but the incidence and mortality rates in Australia are among the highest in the world.
The new: The annual incidence rate of multiple myeloma was projected to increase by 14.9% during 2018–2043, but the mortality rate was projected to decline by 27.5%, leading to a 163% increase in the number of people living with multiple myeloma diagnosed during the preceding thirty years.
The implications: Multiple myeloma remains incurable despite advances in treatment agents that extend survival and consequently the duration of active treatment. In view of the projected increase in disease burden, further research into prevention and early detection is needed.
Multiple myeloma is a rare blood cancer characterised by the proliferation of bone marrow plasma cells. The risk of multiple myeloma increases with age, and is more frequent in people over 65 years of age, people with a family history of multiple myeloma, and African Americans.1 International studies have reported higher incidence and mortality in men,2,3 and associations with radiation exposure4 and excess body fatness.5 Typical myeloma‐defining events at diagnosis include hypercalcaemia, renal failure, anaemia, and bone lesions, all of which can cause end‐organ damage and high morbidity.1,6 The treatment and management of multiple myeloma has advanced in recent decades; people with multiple myeloma are now likely to receive multiple lines of chemotherapy, with or without stem cell transplants. Novel treatment agents include second generation protease inhibitors, second generation immunomodulators, and chimeric antigen receptor T cell therapies.6,7,8 Survival has consequently improved for people diagnosed with multiple myeloma (Box 1), leading to longer duration of active treatment. Multiple myeloma, however, remains incurable.8
The global age‐standardised incidence rate for multiple myeloma increased between 1990 and 2019, particularly in middle to high socio‐demographic index countries.2 The age‐standardised mortality rate increased until the late 1990s, after which it declined in high socio‐demographic index countries.2 The increases in new cases are largely attributed to ageing populations, while declines in mortality rates are partly attributed to better treatment options.2 In Australia, 5‐year survival has increased from 23.3% during 1989–1993 to 48.2% during 2014–2018.9
Multiple myeloma incidence and mortality rates in Australia are among the highest in the world.3 It was estimated that 2625 people would be diagnosed with multiple myeloma and 1100 people would die from the disease in Australia during 2022.9 At the end of 2017, there were 6511 living people who had been diagnosed with multiple myeloma during 2013–2017.9 Despite comprising only 1% of all cancers in Australia, the economic burden of multiple myeloma was estimated to be 3–4% of total spending on cancer care because its unique disease pattern makes it one of the most expensive cancers to treat.10,11 From a health service planning perspective, people with multiple myeloma may receive multiple lines of treatment over several years.6,12 Understanding the past and future burden of multiple myeloma is important for decision makers and clinicians, but long term projections of its incidence, mortality, and prevalence in Australia have not been published.
Given the increasing burden, robust forecasts of multiple myeloma incidence and mortality are imperative for informing national policy decisions that facilitate best practice treatment and supportive care. We therefore examined changes in multiple myeloma incidence and mortality rates during 1982–2018, and estimated its incidence, mortality, and prevalence to 2043.
Methods
For our population‐based statistical modelling study, we analysed Australian Institute of Health and Welfare (AIHW) data on new diagnoses with and deaths from multiple myeloma (International Classification of Diseases, tenth revision [ICD‐10] code C90.0) by sex, 5‐year age group, and calendar year during 1982–2018.9 Data were smoothed (three‐year moving mean) to reduce random variation between adjacent years. As relevant historical data were not available, we did not stratify projections by smouldering multiple myeloma and multiple myeloma, nor by ethnic background. To estimate future multiple myeloma prevalence, we used stratified AIHW data on survival by sex, age group, time since initial diagnosis, and year of diagnosis for 1986–2018.9 Australian population data for 1982–2043 were based on Australian Bureau of Statistics Australian Historical Population Statistics and Population Projections (series B, assuming medium population growth).13,14 Rates were directly age‐standardised to the 2021 Australian population.15
Statistical analysis
The reporting of our analysis adheres to the reporting guideline for epidemic forecasting and prediction research outlined in the EPIFORGE 2020 statement.16 Statistical analyses were performed in Joinpoint 4.7.0.0 and Stata 17.
Changes in multiple myeloma incidence and mortality rates (1982–2018)
We tested for significant changes in trends in cancer rates during 1982–2018 using joinpoint regression analysis, based on Monte Carlo permutation tests; the year in which a change in trend is detected is termed a joinpoint.17 We fitted the default maximum of five joinpoints, with at least four data points between consecutive joinpoints in each analysis (incidence and mortality, overall and by age group and sex). We reported the annual percentage change (APC) for each segment between joinpoints; an APC for which P < 0.05 was deemed statistically significant.
Projected incidence and mortality rates to 2043
Age–period–cohort models were fitted with the Stata 17 apcspline command, using natural cubic splines for smoothing (Supporting Information, section 1.1).18 Final incidence and mortality models were selected on the basis of model fit statistics (Bayesian information criterion) and validated against historical data (Supporting Information, figure 1). For projections, future periods and cohorts were assumed to have the same effect as those for the most recent period and cohort for which data were available. As historical trends do not continue indefinitely, the default setting for the damping factor (0.92) was used; that is, the drift parameter was reduced by 8% per year after the final recorded data point.18
Projected prevalence to 2043
Annual prevalence was defined as the number of people living with multiple myeloma in a given calendar year. Prevalence can be estimated for different durations of follow‐up from initial diagnosis. For example, 30‐year prevalence estimates in 2020 include the number of people alive in 2020 who had been diagnosed with multiple myeloma during the preceding 30 years (1990–2020). We used 30‐year prevalence as a proxy for total prevalence and 5‐year prevalence as an estimate of the number of people with multiple myeloma receiving initial cancer treatment and ongoing care. We developed a modified counting method to estimate prevalence from tabulated incidence and survival data (Supporting Information, section 1.2). Survival for people with multiple myeloma has increased with advances in treatment and management. To project future prevalence, the historical sex‐ and age‐specific survival rates were extrapolated to 2028 to account for the effect of the recent advances in treatment and then assumed to remain constant to 2043 (Supporting Information, figure 2). The prediction intervals for the estimated prevalence were based on the 95% confidence intervals (CIs) for new case numbers and survival rates. The estimated prevalence during 2014–2017 was consistent with the actual prevalence reported by the AIHW.9 We also conducted sensitivity analyses in which prevalence was estimated assuming that the increase in survival plateaued from 2023 or that survival did not increase after 2018.
Ethics approval
Ethics approval and individual patient consent was not required for our analysis of publicly available AIHW data on multiple myeloma incidence, mortality, and survival.
Results
Multiple myeloma incidence and mortality, 1982–2018
The overall age‐standardised incidence rate of multiple myeloma increased by 1.1% (95% CI, 0.6–1.6%) per year during 1982–1993 and by 2.5% (95% CI, 1.6–3.4%) per year during 1993–2000; it did not change significantly during 2000–2006, and then increased by 1.9% (95% CI, 1.7–2.2%) per year during 2006–2018. The pattern of change was similar for each age group, and for men and women, except that the overall rate for people aged 80 years or older declined significantly during 2001–2007 (APC, –2.2%; 95% CI, –3.5% to –0.9%) before increasing during 2007–2018 (APC, 2.4%; 95% CI, 2.0–2.7%) (Box 2).
The overall age‐standardised mortality rate of multiple myeloma increased during 1982–1990 (APC, 2.6%; 95% CI, 1.5–3.7%), then declined during 1990–2018 (APC, –0.4%; 95% CI, –0.5% to –0.2%). The pattern of overall change differed between age groups: the rate increased for people aged 80 years or more during 2008–2018 (APC, 1.7%; 95% CI, 1.0–2.5%), declined for people under 70 years of age during 1989–2018 (APC, –1.4%; 95% CI, –1.6% to –1.2%), and declined for people aged 70–79 years during 2003–2018 (APC, –0.8%; 95% CI, –1.2% to –0.5%) (Box 2).
Projected multiple myeloma incidence and mortality to 2043
The age‐standardised incidence rate of multiple myeloma was projected to increase by 14.9% during 2018–2043, from 8.7 to 10.0 (95% CI, 9.4–10.7) cases per 100 000 population. The annual number of people newly diagnosed with multiple myeloma was estimated to increase by 89.2%, from 2120 (1241 men and 879 women) to 4012 (2335 men, 1677 women). The projected increase was largest for people aged 80 years or older (159%). It was projected that 79 327 people (46 219 men, 33 108 women) would be diagnosed with multiple myeloma during 2019–2043 (Box 3, Box 4; Supporting Information, table 1).
The age‐standardised mortality rate of multiple myeloma was projected to decline by 27.5% during 2018–2043, from 4.0 to 2.9 (95% CI, 2.6–3.3) cases per 100 000 population. Similar declines were projected for people aged 70–79 years and for those aged 80 years or older, whereas mortality rates for people under 70 years of age did not change significantly. The annual number of deaths from multiple myeloma was projected to increase by 31.7%, from 979 (553 men, 426 women) in 2018 to 1289 (744 men, 545 women) in 2043. It was projected that 28 784 people (16 602 men, 12 182 women) would die from multiple myeloma during 2019–2043 (Box 3, Box 4; Supporting Information, table 2).
Projected prevalence of multiple myeloma to 2043
The number of people living with multiple myeloma up to 30 years after diagnosis was projected to increase by 163%, from 10 288 in 2018 to 27 093 in 2043 (14 717 men, 12 376 women). The projected increase would be greatest for people aged 80 years or older (306%). The 5‐year prevalence was projected to increase by 98.3%, from 6565 people in 2018 to 13 019 in 2043 (7471 men, 5548 women), or 48.1% of the total 30‐year prevalence. (Box 5, Box 6; Supporting Information, table 3). The sensitivity analyses yielded similar results to the main prevalence analysis as depicted in Box 6 (Supporting Information, figure 3).
Discussion
The overall multiple myeloma incidence rate has increased over time, most markedly during 1993–1999, while the overall multiple myeloma mortality rate declined between its peak in 1990 and 2018. We project that the number of people newly diagnosed with multiple myeloma each year will almost double over the next 25 years and that the number of people who die from multiple myeloma will increase by almost one‐third. The number of people living with multiple myeloma as long as 30 years after their initial diagnosis was projected to more than double by 2043. Patterns of change in incidence, mortality, and prevalence were similar for men and women, but numbers of diagnoses and deaths were larger for men.
We have reported the first long term projections of multiple myeloma incidence, mortality, and prevalence in Australia. A global study that projected multiple myeloma mortality rates for 195 countries, including Australia,19 used a broader selection of ICD‐10 codes for multiple myeloma (C88 to C90.9) that included immunoproliferative diseases, making it difficult to compare its projections with ours (Supporting Information, figure 4). Our projection of declining multiple myeloma mortality rates is consistent with the availability of new treatment options in Australia.6
Our projections are consistent with other reports on incidence and mortality trends in high socio‐demographic index countries.2 Survival has improved over time, presumably because of advances in treatment and management6 based on improved understanding of the pathophysiology of multiple myeloma, the use of autologous or allogenic stem cell transplants, and broader treatment availability.8 Other factors that may have contributed to changes in incidence and mortality include improved detection,20 changes in the approach to patient care,21 and more accurate coding process for differentiating asymptomatic and symptomatic disease.22
Our projections are also in line with local and overseas responses to the changing diagnostic and treatment landscape for people diagnosed with multiple myeloma. Specifically, recent updates to diagnostic criteria have enabled earlier access to treatment.23 Screening is being explored; early screening trial results from Iceland (iStopMM) support its feasibility, but systematic multiple myeloma screening is not yet recommended as an approach for improving clinical outcomes.24 We project that the largest increases in the incidence and prevalence of multiple myeloma will be among people aged 80 years or older. This finding is consistent with those of retrospective studies, which have consistently reported higher incidence in older age groups.2 Further, the development of novel agents, treatment dose attenuation, and the enhanced safety of high‐dose therapy have increased the treatment options for very old people.25 Care of older people with multiple myeloma will therefore be an ongoing health service priority.
Overall, the impact of multiple myeloma on people newly diagnosed with the disease and their families, as well as on the clinical community, will grow as its incidence and prevalence increase. Impaired physical and cognitive functioning require complex and ongoing management.26 An Australian cohort study found physical functioning limitations in people with multiple myeloma; among all participants with cancer, psychological distress was greater and quality of life was poorer for those with lung cancer or multiple myeloma than other cancer types.27
Earlier detection and management of multiple myeloma requires further investigation, in addition to advancing treatment. Real world data could inform future evidence‐based strategies for screening, diagnosis, and treatment. In 2012, the Australia and New Zealand Myeloma and Related Diseases Registry established a prospective data collection for multiple myeloma and its asymptomatic, noncancerous, precursor conditions (monoclonal gammopathy of undetermined significance and smouldering myeloma).20 However, as the probability of progression from monoclonal gammopathy of undetermined significance to multiple myeloma is low, the registry currently has limited power to detect differences in progression; further large datasets are being developed to overcome this limitation.28 Further research could continue to improve outcomes and ongoing care for people with this incurable disease.
Limitations
The long term data upon which our projections were based are of high quality and reflect cancer registrations across the entire Australian population.9 Further, we used age–period–cohort models that implicitly captured the effects of changes in exposure to a range of risk, cancer diagnostic, and treatment factors,29 and they were validated against historical data, which indicated their robustness for 15‐year projections and adequate reflection of cancer burden in the current cancer control context. However, our projections were also based upon a number of assumptions, including that the age effect was consistent over time and reflected the general population level of cancer risk, and that the cohort and period effects derived from the most recent data were consistent over time.18 The assumptions do not take into account the potential impact of future changes in treatment effectiveness or entirely new treatment paradigms, such as CAR‐T cell therapy.6 Our projections can nevertheless serve as benchmarks against which the impact of advances in treatment can be measured.
Conclusion
Our 25‐year projections provide previously unavailable information on the potential future burden of multiple myeloma in Australia. We found that the pattern of increasing incidence and declining mortality will continue during 2019–2043. Treatment advances, together with population growth and ageing, means that the numbers of cases of and deaths from multiple myeloma are expected to rise substantially during this period. Comprehensive incidence, mortality, and prevalence projections are imperative for planning, especially given the age and multimorbidity of many of the people affected and the complexity of treatment pathways; relevant data can be used for future budget impact analyses. Our projections indicate the increasing need for haematologists with experience in treating people with multiple myeloma. They also fill a critical knowledge gap and can be used to support decision making regarding investment in research, interventions that extend treatment options, and improving outcomes for Australians with myeloma.
Box 1 – Five‐year survival for people diagnosed with multiple myeloma during 1989–201810 and milestones in multiple myeloma treatment, 1950–20216,7
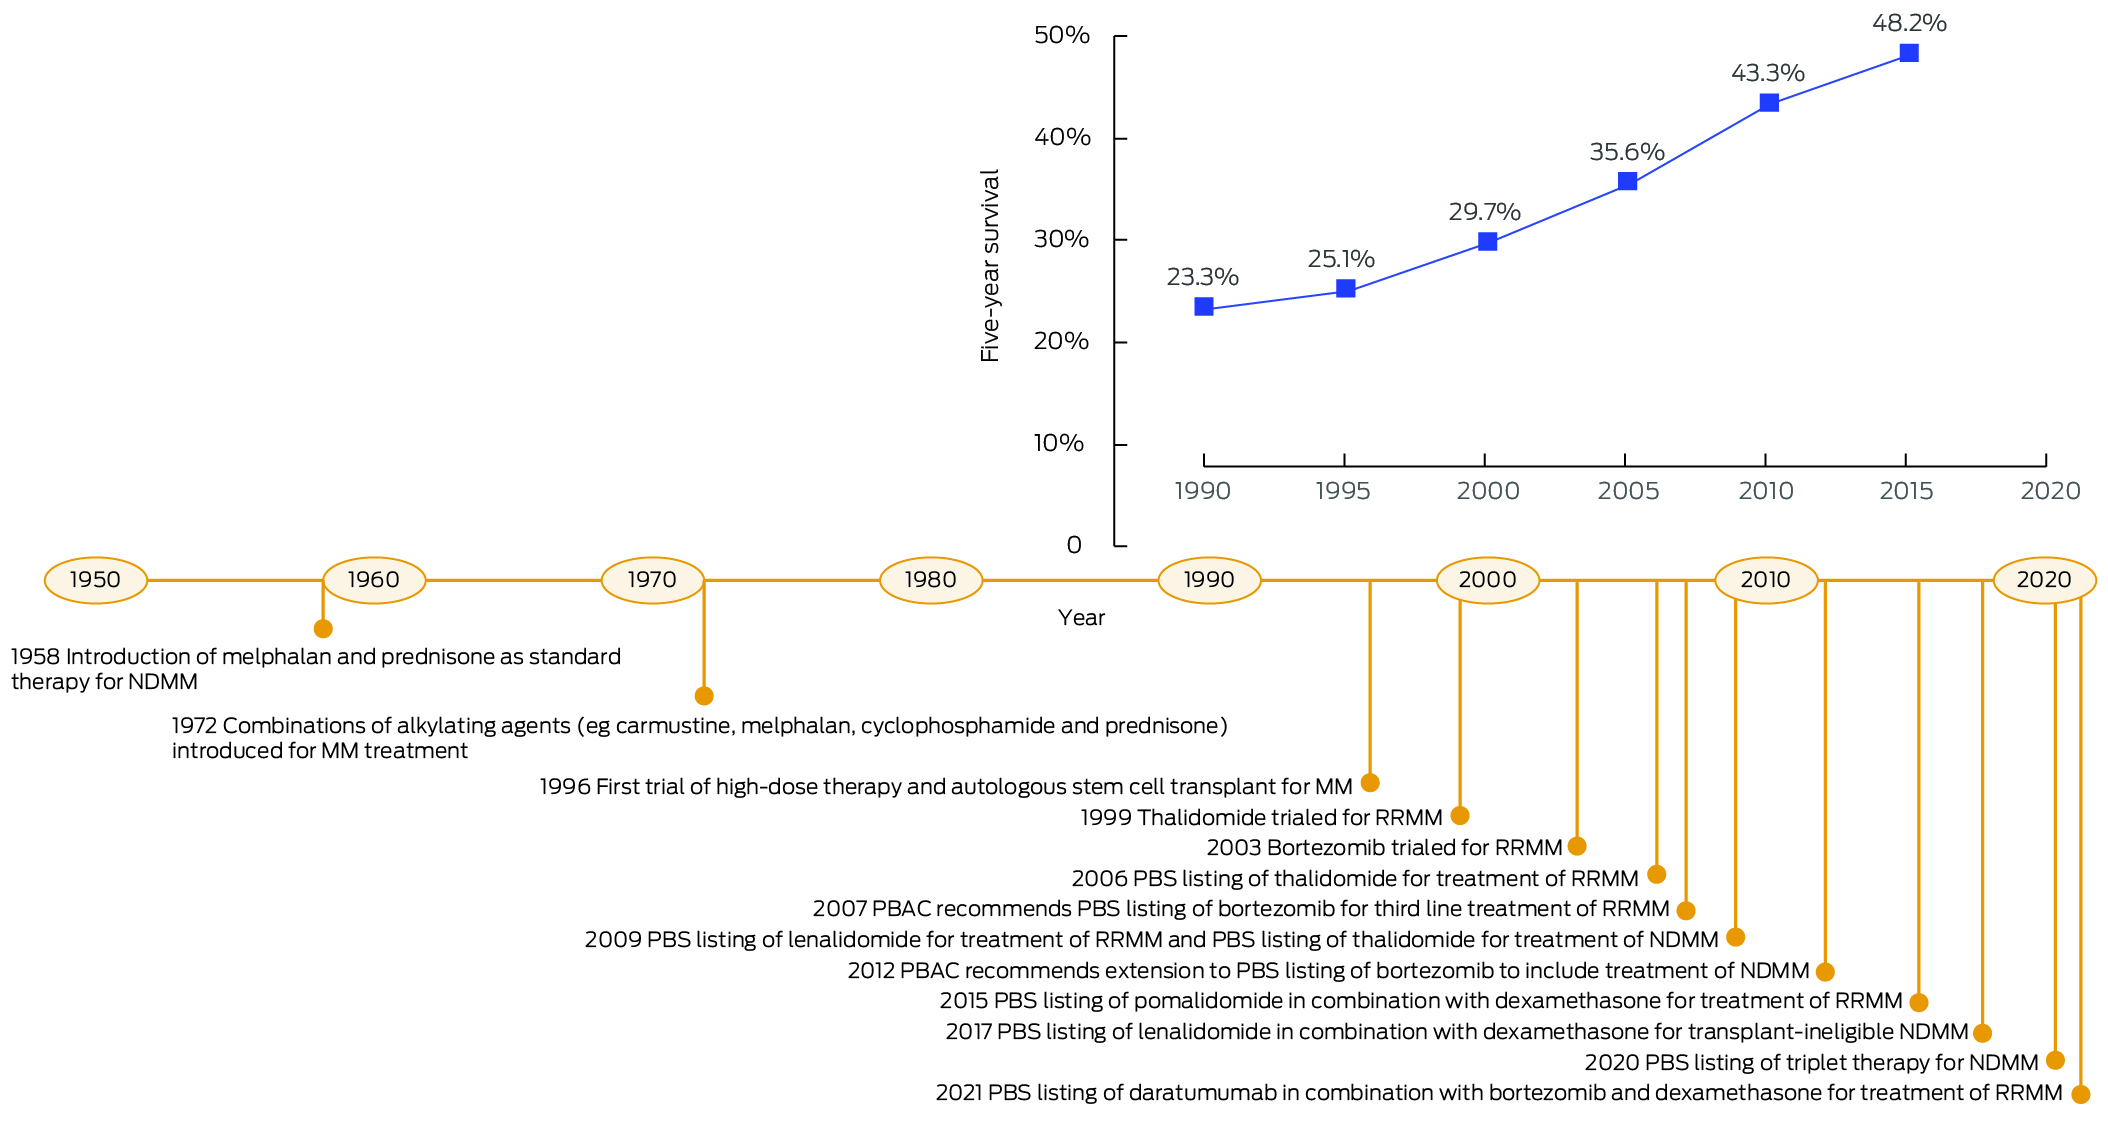
MM = multiple myeloma; NDMM = newly diagnosed multiple myeloma; PBAC = Pharmaceutical Benefits Advisory Committee; PBS = Pharmaceutical Benefits Scheme; RRMM = relapsed/refractory multiple myeloma.
Box 2 – Changes in incidence and mortality rates for multiple myeloma, Australia, 1982 − 2018, by sex and age group*
|
|
Segment 1 |
Segment 2 |
Segment 3 |
Segment 4 |
|||||||||||
|
Characteristic/Group |
Period |
APC (95% CI) |
Period |
APC (95% CI) |
Period |
APC (95% CI) |
Period |
APC (95% CI) |
|||||||
|
|
|||||||||||||||
|
Incidence |
|
|
|
|
|
|
|
|
|||||||
|
Overall |
1982–1993 |
1.1 (0.6–1.6) |
1993–2000 |
2.5 (1.6–3.4) |
2000–2006 |
–0.3 (–1.3 to 0.6) |
2006–2018 |
1.9 (1.7–2.2) |
|||||||
|
Under 70 years |
1982–1987 |
–1.7 (–3.9 to 0.5) |
1987–2018 |
1.4 (1.2–1.6) |
— |
— |
— |
— |
|||||||
|
70–79 years |
1982–1987 |
3.2 (1.1–5.3) |
1987–1999 |
1.6 (1.0–2.1) |
1999–2005 |
0.1 (–1.3 to 1.5) |
2005–2018 |
1.9 (1.6–2.2) |
|||||||
|
80 years or older |
1982–1993 |
2.1 (1.4–2.9) |
1993–2001 |
3.8 (2.7–4.8) |
2001–2007 |
–2.2 (–3.5 to –0.9) |
2007–2018 |
2.4 (2.0–2.7) |
|||||||
|
Men |
1982–2000 |
1.9 (1.6–2.1) |
2000–2006 |
–0.3 (–1.4 to 0.8) |
2006–2018 |
2.0 (1.7–2.3) |
— |
— |
|||||||
|
Under 70 years |
1982–2018 |
1.3 (1.2–1.5) |
— |
— |
— |
— |
— |
— |
|||||||
|
70–79 years |
1982–2001 |
2.1 (1.7–2.6) |
2001–2007 |
–0.7 (–2.6 to 1.2) |
2007–2018 |
2.3 (1.7–2.8) |
— |
— |
|||||||
|
80 years or older |
1982–2001 |
2.3 (2.0–2.6) |
2001–2007 |
–1.7 (–3.1 to –0.2) |
2007–2018 |
2.1 (1.8–2.4) |
— |
— |
|||||||
|
Women |
1982–1993 |
0.5 (–0.1 to 1.2) |
1993–1999 |
3.0 (1.4–4.5) |
1999–2007 |
0.0 (–0.9 to 0.8) |
2007–2018 |
1.8 (1.4–2.2) |
|||||||
|
Under 70 years |
1982–1992 |
–0.6 (–1.7 to 0.5) |
1992–2018 |
1.4 (1.2–1.7) |
— |
— |
— |
— |
|||||||
|
70–79 years |
1982–1996 |
1.5 (0.7–2.2) |
1996–2004 |
–0.1 (–1.6 to 1.5) |
2004–2018 |
1.8 (1.3–2.3) |
— |
— |
|||||||
|
80 years or older |
1982–2002 |
3.1 (2.6–3.6) |
2002–2008 |
–2.6 (–4.7 to –0.6) |
2008–2018 |
2.3 (1.5–3.1) |
— |
— |
|||||||
|
Mortality |
|
|
|
|
|
|
|
|
|||||||
|
Overall |
1982–1990 |
2.6 (1.5–3.7) |
1990–2018 |
–0.4 (–0.5 to –0.2) |
— |
— |
— |
— |
|||||||
|
Under 70 years |
1982–1989 |
2.4 (0.7–4.1) |
1989–2018 |
–1.4 (–1.6 to –1.2) |
— |
— |
— |
— |
|||||||
|
70–79 years |
1982–1987 |
4.1 (1.5–6.7) |
1987–2003 |
0.1 (–0.3 to 0.6) |
2003–2018 |
–0.8 (–1.2 to –0.5) |
— |
— |
|||||||
|
80 years or older |
1982–2002 |
2.1 (1.6–2.7) |
2002–2008 |
–2.0 (–3.7 to –0.2) |
2008–2018 |
1.7 (1.0–2.5) |
— |
— |
|||||||
|
Men |
1982–1990 |
2.3 (0.9–3.7) |
1990–2018 |
–0.4 (–0.6 to –0.3) |
— |
— |
— |
— |
|||||||
|
Under 70 years |
1982–1987 |
4.0 (1.0–7.0) |
1987–2018 |
–1.2 (–1.4 to –1.0) |
— |
— |
— |
— |
|||||||
|
70–79 years |
1982–1998 |
1.1 (0.5–1.8) |
1998–2018 |
–0.8 (–1.2 to –0.5) |
— |
— |
— |
— |
|||||||
|
80 years or older |
1982–2018 |
0.5 (0.2–0.8) |
— |
— |
— |
— |
— |
— |
|||||||
|
Women |
1982–1987 |
4.5 (2.1–6.9) |
1987–2003 |
0.2 (–0.2 to 0.6) |
2003–2009 |
–1.5 (–3.0 to 0.1) |
2009–2018 |
0.1 (–0.6 to 0.7) |
|||||||
|
Under 70 years |
1982–1993 |
0.9 (–0.1 to 1.9) |
1993–2018 |
–1.7 (–1.9 to –1.4) |
— |
— |
— |
— |
|||||||
|
70–79 years |
1982–1987 |
5.9 (2.0–9.9) |
1987–2018 |
–0.5 (–0.8 to –0.3) |
— |
— |
— |
— |
|||||||
|
80 years or older |
1982–2002 |
2.4 (1.8–3.1) |
2002–2008 |
–2.3 (–4.6 to 0.1) |
2008–2018 |
1.7 (0.7–2.6) |
— |
— |
|||||||
|
|
|||||||||||||||
|
APC = annual percentage change; CI = confidence interval. * Periods of change determined by joinpoint analysis. |
|||||||||||||||
Box 3 – Historical (1982–2018) and projected ( to 2043) age‐standardised incidence and mortality rates (with 95% confidence intervals) for multiple myeloma, Australia, by sex and age group
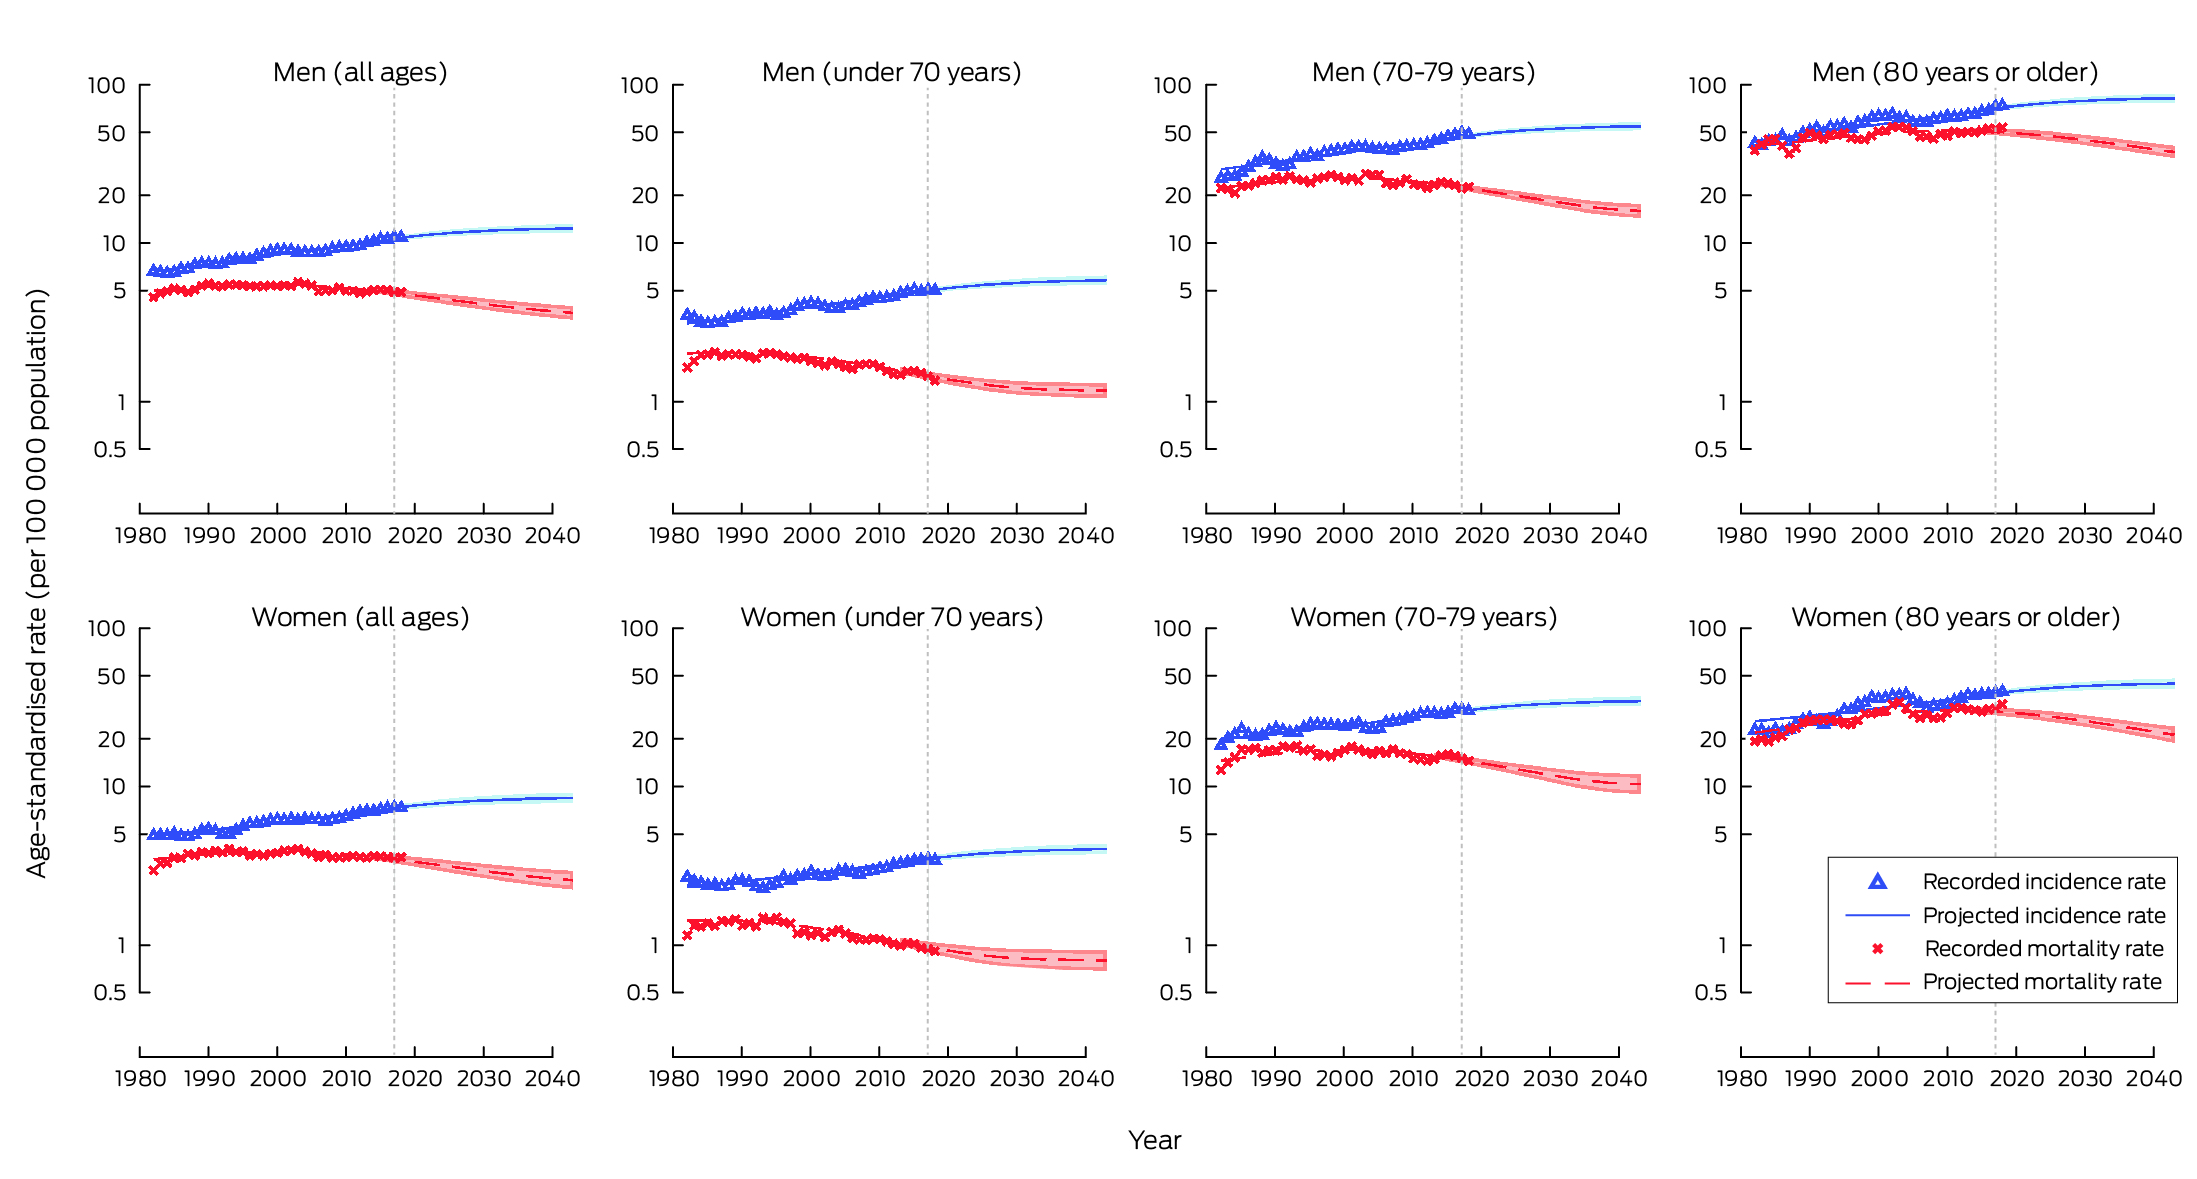
* All rates are age‐standardised to the 2021 Australian population.13
Box 4 – Historical (2018) and projected (2043) age‐standardised incidence and mortality rates and number of new diagnoses and deaths for multiple myeloma, Australia, by age group and sex*
|
Characteristic/Group |
Age‐standardised rate (per 100 000 population) |
New diagnoses/deaths |
|||||||||||||
|
2018 |
2043: projected (95% prediction interval) |
Change, 2018–2043 |
2018 |
2043: projected (95% prediction interval) |
Change, 2018–2043 |
Total number, 2019–2043 (95% prediction interval) |
|||||||||
|
|
|||||||||||||||
|
Incidence |
|
|
|
|
|
|
|
||||||||
|
Overall |
8.7 |
10.0 (9.4–10.7) |
14.9% |
2120 |
4012 (3756–4285) |
89.2% |
79 327 (74 901–84 037) |
||||||||
|
Under 70 years |
4.2 |
4.9 (4.6–5.2) |
16.7% |
908 |
1384 (1293–1481) |
52.4% |
29 530 (27 840–31 328) |
||||||||
|
70–79 years |
39.4 |
44.5 (41.8–47.5) |
12.9% |
676 |
1240 (1164–1322) |
83.4% |
25 825 (24 452–27 287) |
||||||||
|
80 years or older |
54.5 |
61.7 (57.8–65.9) |
13.2% |
536 |
1388 (1299–1482) |
159% |
23 972 (22 609–25 422) |
||||||||
|
Men |
10.9 |
12.4 (11.7–13.2) |
13.8% |
1241 |
2335 (2194–2484) |
88.2% |
46 219 (43 789–48 802) |
||||||||
|
Under 70 years |
5.0 |
5.9 (5.5–6.2) |
18.0% |
536 |
809 (759–862) |
50.9% |
17 214 (16 287–18 198) |
||||||||
|
70–79 years |
48.6 |
54.8 (51.6–58.2) |
12.8% |
404 |
716 (674–760) |
77.2% |
15 025 (14 277–15 824) |
||||||||
|
80 years or older |
73.8 |
82.5 (77.5–87.8) |
11.8% |
301 |
810 (761–862) |
169% |
13 980 (13 225–14 780) |
||||||||
|
Women |
7.5 |
8.7 (8.1–9.3) |
16.0% |
879 |
1677 (1562–1801) |
90.8% |
33 108 (31 112–35 235) |
||||||||
|
Under 70 years |
3.5 |
4.1 (3.9–4.5) |
17.1% |
372 |
575 (534–619) |
54.6% |
12 316 (11 553–13 130) |
||||||||
|
70–79 years |
30.8 |
35.5 (33.2–38.0) |
15.3% |
272 |
524 (490–562) |
92.6% |
10 800 (10 175–11 463) |
||||||||
|
80 years or older |
40.6 |
45.9 (42.7–49.2) |
13.1% |
235 |
578 (538–620) |
146% |
9992 (9384–10 642) |
||||||||
|
Mortality |
|
|
|
|
|
|
|
||||||||
|
Overall |
4.0 |
2.9 (2.6–3.3) |
–27.5% |
979 |
1289 (1154–1443) |
31.7% |
28 784 (26 304–31 518) |
||||||||
|
Under 70 years |
1.1 |
1.0 (0.9–1.1) |
–9.1% |
242 |
273 (241–310) |
12.8% |
6423 (5757–7171) |
||||||||
|
70–79 years |
18.6 |
13.1 (11.7–14.8) |
–29.6% |
319 |
368 (327–416) |
15.4% |
9044 (8268–9907) |
||||||||
|
80 years or older |
41.6 |
28.4 (25.6–31.4) |
–31.7% |
418 |
648 (586–717) |
55.0% |
13 317 (12 279–14 440) |
||||||||
|
Men |
4.9 |
3.6 (3.3–4.0) |
–26.5% |
553 |
744 (676–820) |
34.5% |
|
||||||||
|
Under 70 years |
1.4 |
1.2 (1.1–1.3) |
–14.3% |
144 |
161 (144–179) |
11.8% |
3786 (3444–4163) |
||||||||
|
70–79 years |
22.7 |
16.0 (14.5–17.7) |
–29.5% |
188 |
210 (190–233) |
11.7% |
5228 (4835–5664) |
||||||||
|
80 years or older |
54.0 |
37.6 (34.4–41.1) |
–30.4% |
221 |
373 (342–408) |
68.8% |
7588 (7036–8186) |
||||||||
|
Women |
3.7 |
2.6 (2.3–3.0) |
–29.7% |
426 |
545 (478–623) |
27.9% |
12 182 (10 989–13 505) |
||||||||
|
Under 70 years |
0.9 |
0.8 (0.7–1.0) |
–11.1% |
98 |
112 (97–131) |
14.3% |
2637 (2313–3008) |
||||||||
|
70–79 years |
14.9 |
10.6 (9.2–12.3) |
–28.9% |
131 |
158 (137–183) |
20.6% |
3816 (3433–4243) |
||||||||
|
80 years or older |
33.9 |
21.7 (19.3–24.5) |
–36.0% |
197 |
275 (244–309) |
39.6% |
5729 (5243–6254) |
||||||||
|
|
|||||||||||||||
|
* All rates are age‐standardised to the 2021 Australian population.13 |
|||||||||||||||
Box 5 – Predicted prevalence (for selected years) of multiple myeloma, Australia, by sex and age group
|
Characteristic/Group |
Number of people living with multiple myeloma (95% prediction interval) |
|
|||||||||||||
|
2018 |
2023 |
2033 |
2043 |
Change, 2018–2043 |
|||||||||||
|
|
|||||||||||||||
|
30‐year prevalence |
|
|
|
|
|
||||||||||
|
Overall |
10 288 (9049–11 600) |
13 868 (12 310–15 521) |
21 186 (18 765–23 795) |
27 093 (23 749–30 746) |
163% |
||||||||||
|
Under 70 years |
4278 (3937–4644) |
5322 (4902–5774) |
6836 (6238–7492) |
8064 (7295–8913) |
88.5% |
||||||||||
|
70–79 years |
3465 (3184–3760) |
4974 (4585–5383) |
7376 (6760–8036) |
8704 (7913–9559) |
151% |
||||||||||
|
80 years or older |
2545 (1928–3196) |
3572 (2823–4364) |
6974 (5767–8267) |
10 325 (8541–12 274) |
306% |
||||||||||
|
Men |
5818 (5164–6512) |
7804 (6975–8682) |
11 698 (10 403–13 086) |
14 717 (12 939–16 649) |
153% |
||||||||||
|
Under 70 years |
2432 (2248–2633) |
2987 (2761–3230) |
3778 (3458–4125) |
4450 (4042–4897) |
83.0% |
||||||||||
|
70–79 years |
2008 (1853–2169) |
2848 (2635–3072) |
4085 (3756–4436) |
4753 (4336–5201) |
137% |
||||||||||
|
80 years or older |
1378 (1063–1710) |
1969 (1579–2380) |
3835 (3189–4525) |
5514 (4561–6551) |
300% |
||||||||||
|
Women |
4470 (3885–5088) |
6064 (5335–6839) |
9488 (8362–10 709) |
12 376 (10 810–14 097) |
177% |
||||||||||
|
Under 70 years |
1846 (1689–2011) |
2335 (2141–2544) |
3058 (2780–3367) |
3614 (3253–4016) |
95.8% |
||||||||||
|
70–79 years |
1457 (1331–1591) |
2126 (1950–2311) |
3291 (3004–3600) |
3951 (3577–4358) |
171% |
||||||||||
|
80 years or older |
1167 (865–1486) |
1603 (1244–1984) |
3139 (2578–3742) |
4811 (3980–5723) |
312% |
||||||||||
|
5‐year prevalence |
|
|
|
|
|
||||||||||
|
Overall |
6565 (6194–6956) |
8236 (7708–8796) |
10 949 (10 088–11 884) |
13 019 (11 884–14 250) |
98.3% |
||||||||||
|
Under 70 years |
2905 (2747–3072) |
3414 (3202–3641) |
4031 (3731–4361) |
4637 (4256–5051) |
59.6% |
||||||||||
|
70–79 years |
2174 (2074–2278) |
2906 (2747–3072) |
3818 (3553–4103) |
4294 (3965–4646) |
97.5% |
||||||||||
|
80 years or older |
1486 (1373–1606) |
1916 (1759–2083) |
3100 (2804–3420) |
4088 (3663–4553) |
175% |
||||||||||
|
Men |
3778 (3579–3990) |
4743 (4456–5048) |
6298 (5828–6808) |
7471 (6854–8141) |
97.8% |
||||||||||
|
Under 70 years |
1679 (1594–1771) |
1960 (1844–2084) |
2310 (2146–2491) |
2666 (2458–2894) |
58.8% |
||||||||||
|
70–79 years |
1273 (1218–1330) |
1692 (1605–1783) |
2187 (2045–2340) |
2449 (2273–2637) |
92.4% |
||||||||||
|
80 years or older |
826 (767–889) |
1091 (1007–1181) |
1801 (1637–1977) |
2356 (2123–2610) |
185% |
||||||||||
|
Women |
2787 (2615–2966) |
3493 (3252–3748) |
4651 (4260–5076) |
5548 (5030–6109) |
99.1% |
||||||||||
|
Under 70 years |
1226 (1153–1301) |
1454 (1358–1557) |
1721 (1585–1870) |
1971 (1798–2157) |
60.8% |
||||||||||
|
70–79 years |
901 (856–948) |
1214 (1142–1289) |
1631 (1508–1763) |
1845 (1692–2009) |
105% |
||||||||||
|
80 years or older |
660 (606–717) |
825 (752–902) |
1299 (1167–1443) |
1732 (1540–1943) |
162% |
||||||||||
|
|
|||||||||||||||
|
|
|||||||||||||||
Box 6 – Historical and projected (2019–2043) numbers of new diagnoses with and deaths from multiple myeloma, and of people living with multiple myeloma, Australia, by sex*
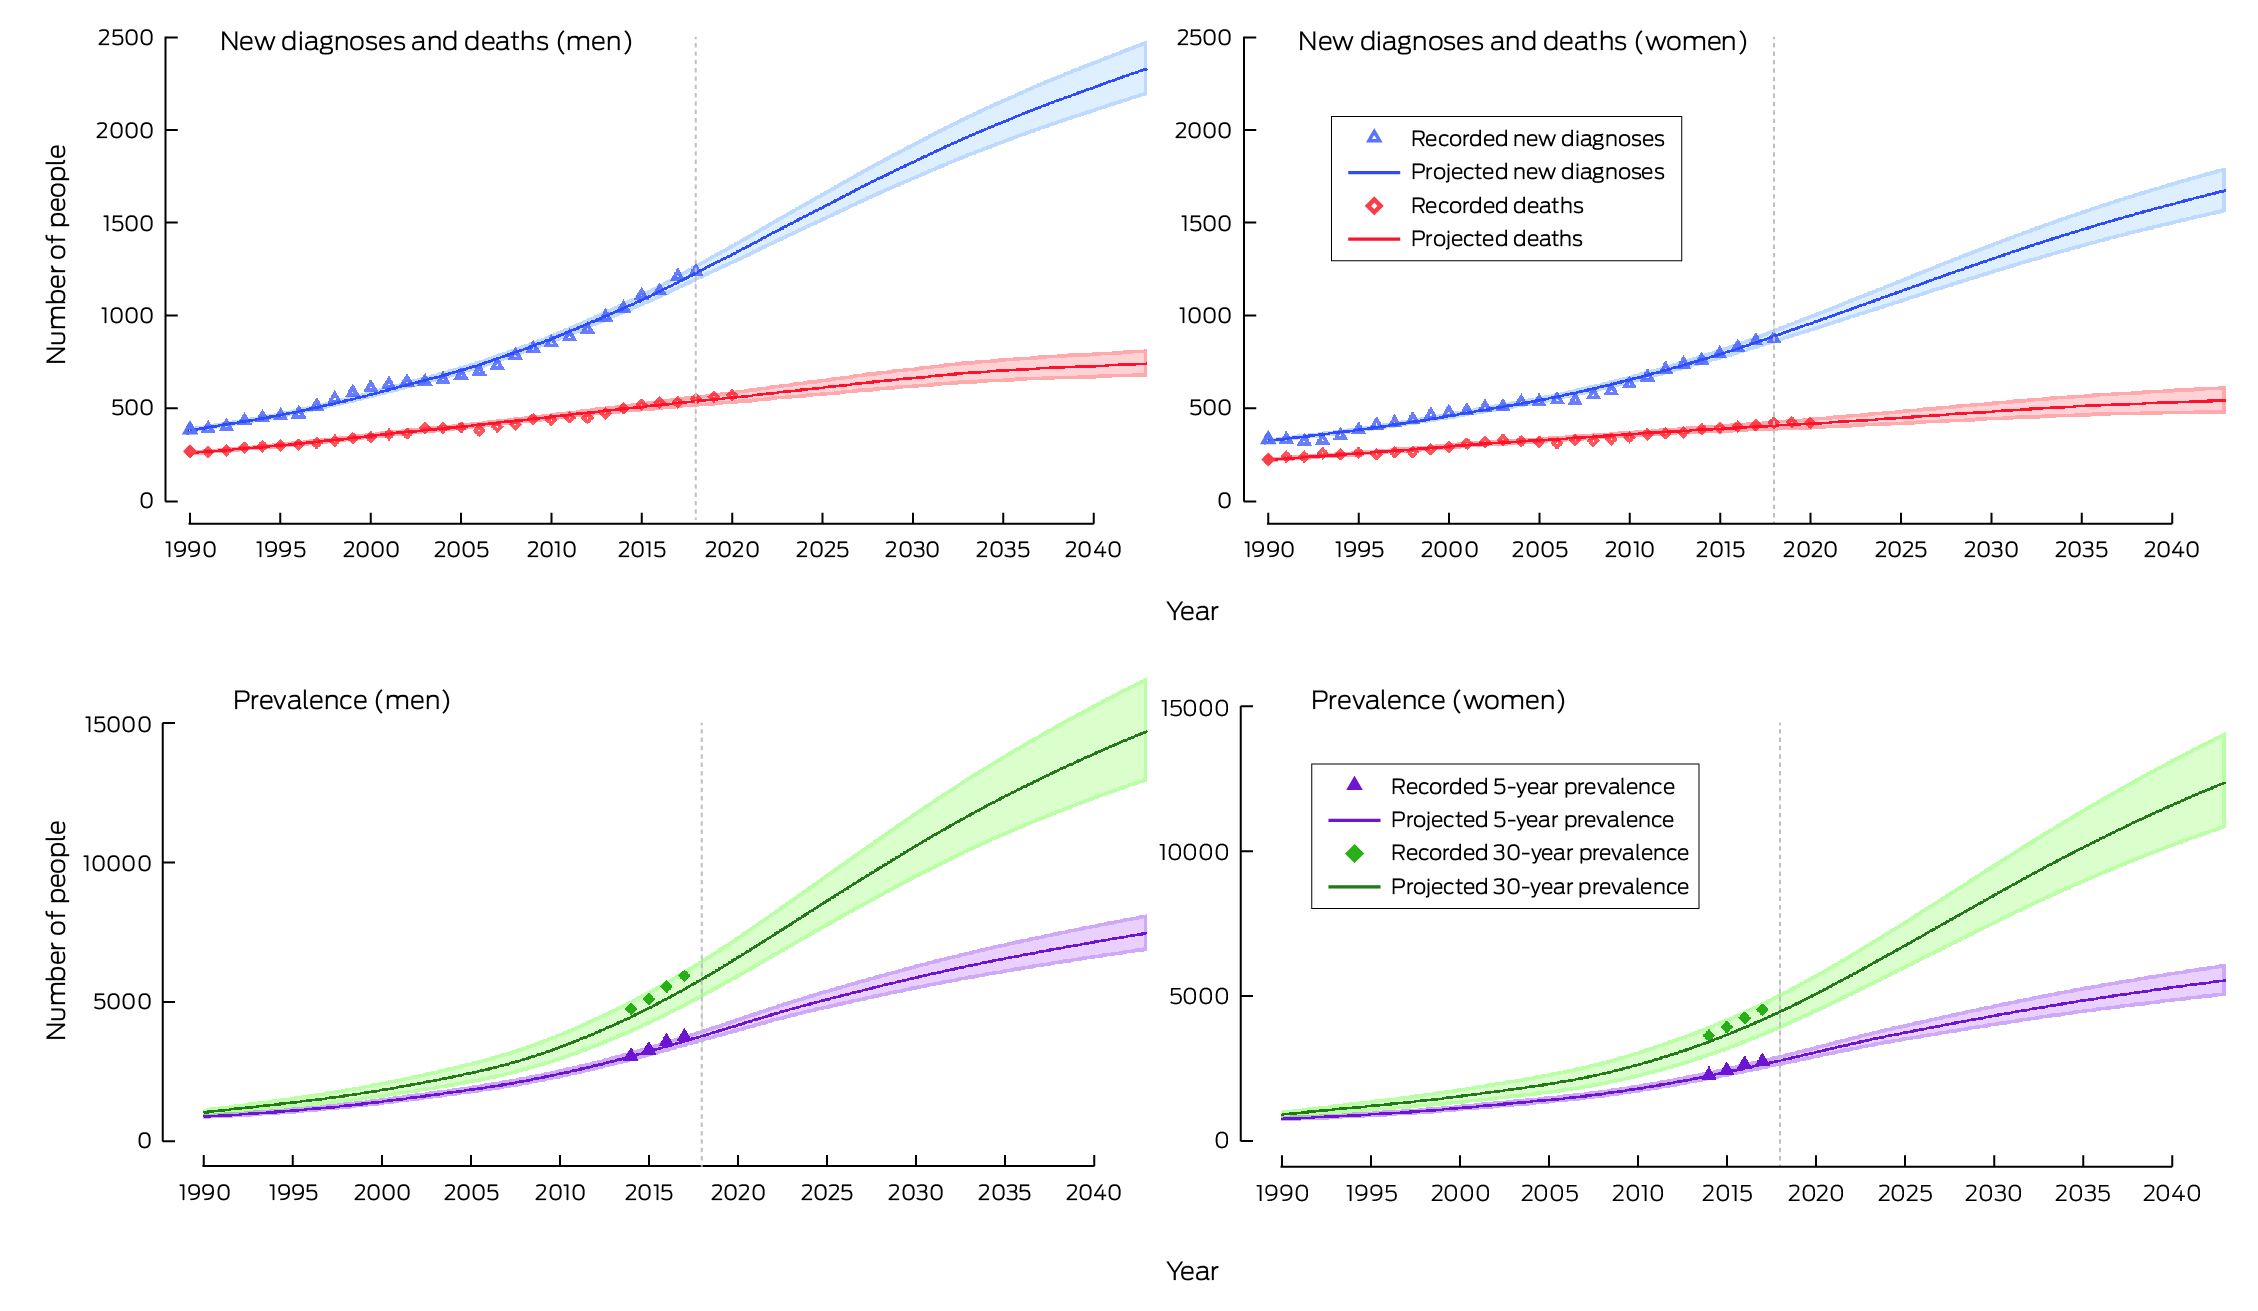
* Historical 30‐year prevalence rates derived from Australian Institute of Health and Welfare 33−36‐year prevalence estimates for 2014 − 2017.9
Received 5 April 2023, accepted 20 November 2023
- Qingwei Luo1
- Deanne Jenkin1
- Marianne F Weber1
- Julia Steinberg1
- Kate White1,2
- Adam Irving3
- Hannah Rillstone4
- Anna Kelly1
- Karen Canfell1
- Eleonora Feletto1
- 1 The Daffodil Centre, the University of Sydney, Sydney, NSW
- 2 Susan Wakil School of Nursing, the University of Sydney, Sydney, NSW
- 3 Centre for Health Economics, Monash University, Melbourne, VIC
- 4 Cancer Council NSW, Sydney, NSW
Open access:
Open access publishing facilitated by the University of Sydney, as part of the Wiley – the University of Sydney agreement via the Council of Australian University Librarians.
Data sharing:
The tabulated data on cancer incidence, mortality, survival and prevalence upon which the projections reported in this article are based are available from the Australian Institute of Health and Welfare (https://www.aihw.gov.au/reports/cancer/cancer‐data‐in‐australia/data).
This study was funded under the Medical Research Future Fund (MRFF) — Preventive and Public Health Research Initiative — 2019 Targeted Health System and Community Organization Research Grant Opportunity (MRF1200535). The funder had no role in study design, data collection, data analysis, data interpretation, writing of the manuscript or the decision to submit.
Karen Canfell is funded by the National Health and Medical Research Council (NHMRC; Fellowship APP1194679, Centre for Research Excellence in Cervical Cancer Control 1135172). She is co‐principal investigator in an investigator‐initiated trial of cervical screening, Compass, by the Australian Centre for Prevention of Cervical Cancer (ACPCC), a government‐funded, not‐for‐profit charity; the ACPCC has received equipment and a funding contribution from Roche Molecular Diagnostics, and operational support from the Australian government. Karen Canfell is also co‐principal investigator in a major investigator‐initiated implementation program, Elimination of Cervical Cancer in the Western Pacific, which will receive support from the Minderoo Foundation, the Frazer Family Foundation, and equipment donations from Cepheid. Neither Karen Canfell nor her institution on her behalf receive direct or indirect funding from industry for any project. Eleonora Feletto receives NHMRC grant funding to investigate improving participation in the National Bowel Cancer Screening Program (APP2014964).
- 1. Padala SA, Barsouk A, Barsouk A, et al. Epidemiology, staging, and management of multiple myeloma. Med Sci (Basel) 2021; 9: 3.
- 2. Zhou L, Yu Q, Wei G, et al. Measuring the global, regional, and national burden of multiple myeloma from 1990 to 2019. BMC Cancer 2021; 21: 606.
- 3. Huang J, Chan SC, Lok V, et al; Non‐communicable Disease Global Health Research Group; Association of Pacific Rim Universities. The epidemiological landscape of multiple myeloma: a global cancer registry estimate of disease burden, risk factors, and temporal trends. Lancet Haematol 2022; 9: e670‐e677.
- 4. Sergentanis TN, Zagouri F, Tsilimidos G, et al. Risk factors for multiple myeloma: a systematic review of meta‐analyses. Clin Lymphoma Myeloma Leuk 2015; 15: 563‐577.e1‐3.
- 5. Lauby‐Secretan B, Scoccianti C, Loomis D, et al; International Agency for Research on Cancer Handbook Working Group. Body fatness and cancer‐viewpoint of the IARC Working Group. N Engl J Med 2016; 375: 794‐798.
- 6. Quach H, Prince HM, Harrison S; Medical Scientific Advisory Group to Myeloma Australia. Clinical practice guideline: multiple myeloma. Updated June 2022. https://myeloma.org.au/wp‐content/uploads/2022/09/MSAG_Myeloma‐Clinical‐Practice‐Guideline‐2022_Final‐1.pdf (viewed Apr 2023).
- 7. Kyle RA, Rajkumar SV. An overview of the progress in the treatment of multiple myeloma. Expert Rev Hematol 2014; 7: 5‐7.
- 8. Legarda MA, Cejalvo MJ, de la Rubia J. Recent advances in the treatment of patients with multiple myeloma. Cancers (Basel) 2020; 12: 3576.
- 9. Australian Institute of Health and Welfare. Cancer data in Australia (Cat. no. CAN 122). Updated 1 July 2022. Archived: https://web.archive.org/web/20221106072938/https://www.aihw.gov.au/reports/cancer/cancer‐data‐in‐australia/contents/summary (viewed Aug 2022).
- 10. Australian Institute of Health and Welfare. Health system expenditure on cancer and other neoplasms in Australia, 2015–16 (Cat. no. CAN 142.) 24 Mar 2021. https://www.aihw.gov.au/reports/cancer/health‐system‐expenditure‐cancer‐other‐neoplasms/summary (viewed Apr 2023).
- 11. Merollini KMD, Gordon LG, Ho YM, et al. Cancer survivors’ long‐term health service costs in Queensland, Australia: results of a population‐level data linkage study (Cos‐Q). Int J Environ Res Public Health 2022; 19: 9473.
- 12. Karam D, Kumar S. Post‐transplant maintenance treatment options in multiple myeloma. Oncol Ther 2021; 9: 69‐88.
- 13. Australian Bureau of Statistics. Australian historical population statistics, 2014 (3105.0.65.001). 18 Sept 2014. http://www.abs.gov.au/AUSSTATS/abs@.nsf/Lookup/3105.0.65.001Main+Features12014?OpenDocument (viewed Aug 2022).
- 14. Australian Bureau of Statistics. Population projections, Australia, 2017 (base) – 2066. 22 Nov 2018. https://www.abs.gov.au/statistics/people/population/population‐projections‐australia/2017‐base‐2066 (viewed Aug 2022).
- 15. Australian Bureau of Statistics. Population: census, 2021. 28 June 2022. https://www.abs.gov.au/statistics/people/population/population‐census/latest‐release (viewed Sept 2023).
- 16. Pollett S, Johansson MA, Reich NG, et al. Recommended reporting items for epidemic forecasting and prediction research: the EPIFORGE 2020 guidelines. PLoS Med 2021; 18: e1003793.
- 17. Kim HJ, Fay MP, Feuer EJ, Midthune DN. Permutation tests for joinpoint regression with applications to cancer rates. Stat Med 2000; 19: 335‐351.
- 18. Sasieni P. Age–period–cohort models in Stata. Stata Journal 2012; 12: 15.
- 19. Foreman KJ, Marquez N, Dolgert A, et al. Forecasting life expectancy, years of life lost, and all‐cause and cause‐specific mortality for 250 causes of death: reference and alternative scenarios for 2016–40 for 195 countries and territories. Lancet 2018; 392: 2052‐2090.
- 20. Bergin K, Wellard C, Moore E, et al; Myeloma and Related Diseases Registry. The myeloma landscape in Australia and New Zealand: the first 8 years of the Myeloma and Related Diseases Registry (MRDR). Clin Lymphoma Myeloma Leuk 2021; 21: e510‐e520.
- 21. Bergin K, McQuilten Z, Moore E, et al. Myeloma in the real world: what is really happening? Clin Lymphoma Myeloma Leuk 2017; 17: 133‐144.e1.
- 22. Fiala MA, Dukeman J, Tuchman SA, et al. Development of an algorithm to distinguish smoldering versus symptomatic multiple myeloma in claims‐based data sets. JCO Clin Cancer Inform 2017; 1: CCI.17.00089.
- 23. Rajkumar SV, Dimopoulos MA, Palumbo A, et al. International Myeloma Working Group updated criteria for the diagnosis of multiple myeloma. Lancet Oncol 2014; 15: e538‐e548.
- 24. Thorsteinsdottir S. Early detection and screening for multiple myeloma precursors [abstract: 4th European Myeloma Network meeting, Amsterdam, 20–22 April 2023]. HemaSphere 2023; 7 (Suppl 2): 2.
- 25. Manapuram S, Hashmi H. Treatment of multiple myeloma in elderly patients: a review of literature and practice guidelines. Cureus 2018; 10: e3669.
- 26. Ramsenthaler C, Kane P, Gao W, et al. Prevalence of symptoms in patients with multiple myeloma: a systematic review and meta‐analysis. Eur J Haematol 2016; 97: 416‐429.
- 27. Joshy G, Thandrayen J, Koczwara B, et al. Disability, psychological distress and quality of life in relation to cancer diagnosis and cancer type: population‐based Australian study of 22 505 cancer survivors and 244 000 people without cancer. BMC Med 2020; 18: 372.
- 28. Rögnvaldsson S, Love TJ, Thorsteinsdottir S, et al. Iceland screens, treats, or prevents multiple myeloma (iStopMM): a population‐based screening study for monoclonal gammopathy of undetermined significance and randomized controlled trial of follow‐up strategies. Blood Cancer J 2021; 11: 94.
- 29. Smith TR, Wakefield J. A review and comparison of age–period–cohort models for cancer incidence. Stat Sci 2016; 31: 591‐610.
Abstract
Objectives: To examine changes in multiple myeloma incidence and mortality rates during 1982–2018, and to estimate its incidence, mortality, and prevalence for 2019–2043.
Study design: Population‐based statistical modelling study; analysis of and projections based on Australian Institute of Health and Welfare multiple myeloma incidence, mortality, and survival data.
Setting: Australia, 1982–2018 (historical data) and projections to 2043.
Main outcome measures: Changes in multiple myeloma incidence and mortality rates, 1982–2018, determined by joinpoint regression analysis (age‐standardised to 2021 Australian population); projection of rates to 2043 based on age–period–cohort models; estimated 5‐ and 30‐year prevalence of multiple myeloma (modified counting method).
Results: The incidence of multiple myeloma increased during 1982–2018 (eg, annual percentage change [APC], 2006–2018, 1.9%; 95% confidence interval [CI], 1.7–2.2%), but the mortality rate declined during 1990–2018 (APC, –0.4%; 95% CI, –0.5% to –0.2%). The age‐standardised incidence rate was projected to increase by 14.9% during 2018–2043, from 8.7 in 2018 to 10.0 (95% CI, 9.4–10.7) new cases per 100 000 population in 2043; the mortality rate was projected to decline by 27.5%, from 4.0 to 2.9 (95% CI, 2.6–3.3) deaths per 100 000 population. The annual number of people newly diagnosed with multiple myeloma was estimated to increase by 89.2%, from 2120 in 2018 to 4012 in 2043; the number of deaths from multiple myeloma was projected to increase by 31.7%, from 979 to 1289. The number of people living with multiple myeloma up to 30 years after initial diagnosis was projected to increase by 163%, from 10 288 in 2018 to 27 093 in 2043, including 13 019 people (48.1%) diagnosed during the preceding five years.
Conclusion: Although the decline in the mortality rate was projected to continue, the projected increases in the incidence and prevalence of multiple myeloma in Australia over the next 25 years indicate that investment in prevention and early detection research, and planning for prolonged treatment and care, are needed.