


The known: Despite our universal health care system, the financial burden of medical costs can be great for people in Australia, particularly those with cancer.
The new: Out‐of‐pocket spending on health care during the preceding twelve months exceeded $1000 for 43% of survey respondents (aged 56 years or older). The likelihood of higher out‐of‐pocket expenses was greater for people with cancer, independent of the effect of socio‐demographic factors.
The implications: High out‐of‐pocket costs can increase financial strain generally, but can also restrict access to appropriate health care for people with limited financial resources, especially for those with cancer.
An estimated $241 billion was spent on health care in Australia during 2021–22, 14% of which was directly borne by patients,1 or about $1300 in out‐of‐pocket costs per person. Total health spending related to cancer care was estimated to be $12 billion during 2019–20,2 the third highest figure by disease type. More than 150 000 new cases of cancer are diagnosed each year.3 However, comprehensive data on out‐of‐pocket health care costs for people with cancer, and comparisons with costs for people without cancer, have not been reported in Australia.
The Australian health care system comprises a mixture of public and private systems; the public (universal) system includes the federal government‐funded Medicare program.4 This program subsidises approved medical services and medicines, although many treatments require patient co‐payments. Several studies of out‐of‐pocket costs for cancer care in Australia have been based on these co‐payments, providing valuable information but potentially missing other health care‐related out‐of‐pocket costs, such as unsubsidised care and treatment‐related travel and accommodation.5 Other studies have included a broader range of cost types, but were limited to selected cancer types or a single rural area.6,7,8 Nevertheless, some studies have reported very high out‐of‐pocket health care costs9,10 that could lead to inequities in health care, particularly if timely access to all treatment options is available only to people with adequate financial resources.11 More comprehensive population‐wide information on out‐of‐pocket costs and their relationship with patients’ characteristics is needed.
We therefore investigated a broad range of self‐reported out‐of‐pocket health care expenses for a large population‐based sample of Australians. We report the proportions of people who reported out‐of‐pocket expenses that exceeded $1000, both overall and by specific cost type, or overall out‐of‐pocket expenses exceeding $10 000. We also report associations between out‐of‐pocket expenses and a range of socio‐demographic and medical characteristics.
Methods
The Sax Institute's 45 and Up Study is a longitudinal New South Wales cohort study for which 267 357 participants aged 45 years or older were recruited during 2005–2009.12,13 Potential participants were randomly selected from the Services Australia Medicare enrolment database, which has near complete population coverage; people aged 80 years or older and people living in rural areas were oversampled. The baseline questionnaire participation rate was 19% (about 11% of NSW people aged 45 years or older). Participants consented to linkage of their responses to health care databases. During July–December 2020, a follow‐up questionnaire was sent (online and print versions offered) to 85 299 people (about one‐third of the cohort) who were still participating in the 45 and Up Study; it included questions on out‐of‐pocket health care expenses (Supporting Information, table 1). Questionnaire data were probabilistically linked by the NSW Health Centre for Health Record Linkage (CHeReL), using privacy‐preserving procedures, with NSW Cancer Registry records to identify diagnoses of invasive cancers during 1994–2019. Data were stored on the Sax Institute's Secure Unified Research Environment platform, with strict access and privacy protocols. We report our study according to STROBE guidelines.14
Out‐of‐pocket health expenses
In the 2020 follow‐up questionnaire, participants were asked about their out‐of‐pocket health care costs (excluding costs covered by Medicare or private health insurance) during the preceding twelve months, overall and for each of eleven medical and non‐medical cost types (Supporting Information, table 1). The response options (overall and for each cost type) were: not applicable, $0, $1–250, $251–1000, $1001–10 000, more than $10 000, and (for overall costs only), more than $25 000, and unsure.
Participant characteristics
Participants’ characteristics were based on 2020 questionnaire responses unless otherwise indicated: age, sex, accessibility/remoteness (Australian Statistical Geography Standard15) and socio‐economic standing (Index of Relative Socioeconomic Disadvantage,16 by quintile) of area of residence, household income, health insurance status, highest education level (baseline questionnaire), employment status, marital status, and smoking status. Self‐reported health conditions included cardiovascular disease (heart failure, atrial fibrillation, other heart disease, stroke), high blood pressure, diabetes, blood clot or thrombosis, asthma, chronic obstructive pulmonary disease, osteoarthritis, depression, anxiety, lymphoedema, and hay fever. Cancer data (date of diagnosis, cancer type, and summary spread of disease at diagnosis) were from NSW Cancer Registry records for the most recent invasive cancer diagnosis. Cancer status was categorised as no cancer diagnosis during 1994–2019; cancer diagnosed more than two years before completion of 2020 questionnaire; or cancer diagnosed two years or less before completion of 2020 questionnaire.
Statistical analysis
We report the numbers and proportions of respondents overall, and by cancer status and cost category. We assessed associations between participants’ characteristics and two outcomes of interest — out‐of‐pocket costs exceeding $1000, overall and for each cost type; and overall out‐of‐pocket costs exceeding $10 000 — in multivariable logistic regression analyses adjusted for all demographic and health characteristics. We considered costs exceeding $1000 to be a meaningful level that could be identified using the available data. Participants who provided an unsure, not applicable, or no response for a particular outcome were excluded from the applicable analysis; in sensitivity analyses, they were included, with various low or high values. We assessed associations between cancer status and each outcome in analyses adjusted for all demographic and health characteristics; a sensitivity analysis was based on the number of non‐cancer health conditions rather than individual conditions. We also assessed associations between out‐of‐pocket costs and the four most frequent cancer types, and with all other cancer types combined.
The 45 and Up Study 2020 questionnaire also included questions about the impact of the coronavirus disease 2019 (COVID‐19) pandemic, including change in financial situation, worry about financial situation, changes to overall health, changes to emotional health, and missing or delaying health care because of the pandemic. In a sensitivity analysis, these factors were included in the regression analysis for each out‐of‐pocket expense outcome.
We report adjusted odds ratios (aORs) with 95% confidence intervals (CIs). Statistical analyses were undertaken in SAS 9.4; graphs were generated in R 4.2.2 and Microsoft Excel.
Ethics approval
The 45 and Up Study was approved by the University of NSW Human Research Ethics Committee (HC210602); the NSW Population and Health Services Research Ethics Committee approved the analysis reported in this article (HREC/14/CIPHS/54).
Results
During July 2020 – February 2021, 45 061 participants completed the follow‐up questionnaire (participation rate, 53%) (Supporting Information, figure 1). Their median age was 70 years (interquartile range [IQR], 64–76 years). A total of 7916 participants (18%) had recorded cancer diagnoses; compared with participants without cancer, their median age was higher (74 [IQR, 67–79] years v 69 [IQR, 63–75] years), and larger proportions were men (54% v 42%), retired (72% v 62%), or reported cardiovascular disease (27% v 21%), diabetes (13% v 10%), or lymphoedema (6% v 1%); slightly smaller proportions reported anxiety (10% v 12%) or depression (13% v 15%) (Box 1).
Out‐of‐pocket health care expenses
A total of 1319 participants (3%) reported no out‐of‐pocket health care expenses during the twelve months preceding the questionnaire, 17 947 participants (40%) reported costs of $1001–10 000, 1179 (3%) reported costs of $10 001–25 000, and 110 (0.2%) reported costs exceeding $25 000; 3338 respondents (7%) were unsure or did not respond to this question (Box 2).
A total of 19 236 respondents (42.7%; 95% confidence interval [CI], 42.2–43.1%) reported that overall out‐of‐pocket health care expenses during the previous year exceeded $1000, including 3167 of 7055 participants diagnosed with cancer more than two years ago (44.9%; 95% CI, 43.7–46.1%) and 477 of 861 participants diagnosed during the two years preceding the survey (55.4%; 95% CI, 52.1–58.7%) (Supporting Information, table 3).
The proportions of participants diagnosed with cancer who reported out‐of‐pocket costs exceeding $1000 or $10 000 were largest for those diagnosed with cancer during the two years preceding the survey (> $1000: 55%; > $10 000: 9%), beyond which point the proportions were fairly stable (respectively 45% and 3%) (Box 3).
The proportions of participants who reported more than $1000 in out‐of‐pocket expenses for specific cost types were largest for treatment by doctors or specialists (4721 respondents, 10%), dental care (4631, 10%), and medications (2781, 6%); the proportion of unsure/missing/not applicable responses ranged from 5% (2317 participants) for medications to 28% (12 736 participants) for any other health care (not specified) (Box 2).
Factors associated with higher overall out‐of‐pocket health care expenses
After adjustment for socio‐demographic and medical characteristics, out‐of‐pocket expenses greater than $1000 were more likely to be reported by participants with cancer than by those without cancer (diagnosis in past two years: aOR, 2.06 [95% CI, 1.77–2.40]; diagnosis more than two years ago: aOR, 1.22 [95% CI, 1.15–1.29]). After adjustment, the likelihood of out‐of‐pocket health care expenses greater than $1000 also increased with household income, highest educational attainment level, and area‐based socio‐economic advantage; it was also greater for people who had cardiovascular disease (aOR, 1.60; 95% CI, 1.52–1.68) and for people with private health insurance (v people with Medicare coverage only [no insurance]: aOR, 1.64; 95% CI, 1.53–1.75) (Box 4).
The adjusted odds of out‐of‐pocket health care expenses greater than $10 000 increased with household income and age group, and were higher for people living in areas in the highest quintile of socio‐economic advantage (v lowest quintile: aOR, 1.61; 95% CI, 1.31–1.98) or diagnosed with cancer during the past two years (v no cancer: aOR, 3.30; 95% CI, 2.56–4.26), as well as for people in unpaid work or unemployed (v paid work: aOR, 1.54; 95% CI, 1.23–1.93). The odds of out‐of‐pocket costs exceeding $1000 or $10 000 were lowest for the 657 participants with Department of Veterans’ Affairs health coverage (1% of participants) (Box 4).
Out‐of‐pocket health care expenses, by cancer diagnosis status and cost type
After adjustment for key characteristics, including socio‐economic standing and other health conditions, the odds of out‐of‐pocket expenses exceeding $1000 were higher for people diagnosed with cancer during the past two years than for people not diagnosed with cancer with respect to medical tests (aOR, 5.73; 95% CI, 4.36–7.52), hospital or outpatient care (aOR, 4.22; 95% CI, 3.42–5.21), doctors or specialists (aOR, 3.56; 95% CI, 3.02–4.21), practical and travel costs (aOR, 2.78; 95% CI, 1.69–4.56), medications (aOR, 1.69; 95% CI, 1.32–2.16), and other health care costs (aOR, 1.92; 95% CI, 1.13–3.27). The odds of out‐of‐pocket costs exceeding $1000 were also higher for people diagnosed with cancer more than two years ago than for people not diagnosed with cancer with respect to medical tests (aOR, 1.69; 95% CI, 1.42–2.02), medications (aOR, 1.30; 95% CI, 1.17–1.45), and doctors or specialists (aOR, 1.26; 95% CI, 1.16–1.37) (Box 5).
Among people with total out‐of‐pocket expenses greater than $1000, the proportions of those diagnosed with cancer in the preceding two years who incurred out‐of‐pocket costs greater than $1000 for doctors and specialists (44% v 21%), hospital and outpatient care (24% v 8%), and medical tests (14% v 5%) were larger than for people not diagnosed with cancer (Supporting Information, table 7).
Of the 7916 participants diagnosed with cancer, 5964 (75%) were diagnosed with one of the four most frequent cancer types (prostate, breast, melanoma, colorectal) (Box 6). Compared with participants without cancer, the odds of total out‐of‐pocket costs exceeding $10 000 were highest for people diagnosed in the past two years with prostate cancer (37 of 203, 18%; v no cancer: aOR, 7.80; 95% CI, 5.33–11.4) or breast cancer (nine of 139, 6%; aOR, 2.53; 95% CI, 1.26–5.05) (Box 7).
Among the participants with cancer, the odds of higher out‐of‐pocket costs were greater for people with multiple cancers than for those with one cancer diagnosis (greater than $1000: aOR, 1.28; 95% CI, 1.09–1.52; greater than $10 000: aOR, 1.74; 95% CI, 1.24–2.45); age and cancer stage at diagnosis did not significantly influence the odds of higher out‐of‐pocket costs (Supporting Information, table 9).
Sensitivity analyses
A sensitivity analysis adjusted for factors related to the COVID‐19 pandemic (Supporting Information, table 10) yielded similar findings to the main analysis as reported in Box 4 (Supporting Information, figures 2a,b). A sensitivity analysis in which participants without valid out‐of‐pocket cost values (unsure, missing, or invalid) were assumed to have low or high out‐of‐pocket costs also yielded similar findings to the main analysis (Supporting Information, figures 3, 4), as did an analysis that used the number of non‐cancer health conditions instead of the actual conditions (Supporting Information, figure 5). Finally, findings for all non‐cancer characteristics were similar when participants with cancer diagnoses were excluded (Supporting Information, figure 6).
Discussion
We found that out‐of‐pocket health care expenses of greater than $1000 per year were relatively frequent in our large sample of New South Wales adults aged 55 years or older, especially among participants diagnosed with cancer during the past two years and those with greater personal or area‐level socio‐economic advantage. Our findings — based on data for a statewide sample including all cancer types and a broad range of cost types, and taking several key socio‐demographic and clinical characteristics into account — indicate that out‐of‐pocket costs are potentially a barrier to equitable health care access and optimal health care outcomes for people with limited financial resources.
The overall level of out‐of‐pocket health care expenses in our study was consistent with the Australian Institute of Health and Welfare estimate of $1300 per person in Australia during 2020–21, the major components of which were out‐of‐pocket costs for medications ($445), dental care ($253), medical services ($182), and hospital services ($149).1 An analysis of Household Income and Labour Dynamics in Australia Survey data for 2006–2014 found that mean annual household spending on health care in Australia was about $3100, including about $1100 for doctors, $600 for medications, and $1500 for insurance premiums.17 However, neither of these earlier studies examined differences in out‐of‐pocket expenses by health or socio‐demographic characteristics, and the definitions of cost types differed between studies. We included additional cost items in our analysis, such as health care‐related travel and accommodation expenses. We did not include private health insurance premiums, as they were not available in the dataset, nor did we have information on income tax and health care levy payments, or on income lost because of cancer or other health conditions.
Our finding that out‐of‐pocket costs exceeded $1000 for more than half the participants diagnosed with cancer during the preceding two years, including 66% of participants with recent prostate cancer diagnoses, was broadly consistent with earlier Australian studies. One reported median out‐of‐pocket costs of $8000 for prostate cancer treatment in 2013;10 a 2018 study, mainly comprising people with breast cancer, reported that out‐of‐pocket costs during the preceding two years had exceeded $10 000 for 27% of respondents.9 A study based on Medicare co‐payments during 2011–12 reported out‐of‐pocket costs of about $1100 per person during the first year after diagnosis for people diagnosed with cancer in Queensland.18
Our finding that out‐of‐pocket health care costs were higher for participants with cancer than for those without cancer is also consistent with other Australian studies. An analysis of Medicare data reported that 2‐year median out‐of‐pocket expenses during 2010–11 ranged from $1078 for people with lung cancer to $4192 for people with breast cancer, compared with $615 for the general population and $936 for people who frequently consulted general practitioners.19 We included costs not subsidised by Medicare in our analysis, such as unsubsidised medicines and travel, and included all cancer types, providing more comprehensive information on health care costs for Australians.
The likelihood of higher out‐of‐pocket health care expenses was greater for people recently diagnosed with cancer than for those diagnosed more than two years ago. The odds of out‐of‐pocket expenses exceeding $10 000 were eight times as high for participants diagnosed with prostate cancer in the past two years than for people without cancer. Beyond two years after diagnosis, the proportion of people with cancer who had out‐of‐pocket expenses exceeding $10 000 during the preceding twelve months declined to about the level for people without cancer. Larger proportions of people diagnosed with cancer in the past two years than of participants without cancer reported out‐of‐pocket expenses exceeding $1000 for medical tests, hospital and outpatient care, and doctors and specialists, as did moderately larger proportions for practical and travel costs and medications. Out‐of‐pocket doctor and specialist expenses during the preceding twelve months exceeded $1000 for 26% of people diagnosed with cancer in the past two years and 10% of people without cancer. Larger proportions of people diagnosed with cancer more than two years ago than of people without cancer had out‐of‐pocket expenses exceeding $1000 for medical tests, medications, and doctors and specialists, reflecting continuing health care needs after a cancer diagnosis. In contrast, the proportions of people with more than $1000 in out‐of‐pocket dental care expenses were similar for people with or without cancer, consistent with other reports.1
The relationship between higher out‐of‐pocket health care expenses, cancer, and socio‐economic standing is complex. We found that higher costs were associated with socio‐economic advantage, and particularly with higher household income and having private health insurance (the lower costs for people with Department of Veterans’ Affairs health coverage reflect more comprehensive government‐subsidised health care coverage and possibly less intensive treatments). However, the potentially negative impact of out‐of‐pocket health care costs is not caused by their absolute level, but by their affordability, which is determined by a person's financial resources. Evidence of financial toxicity in cancer care is growing; that is, the inability to pay for health care affects a person's physical and psychological health, influences their health care decisions, and potentially leads to poorer outcomes.20 Cost transparency can also be a problem. A recent Australian survey found that large proportions of people with cancer were not informed about costs prior to treatment and were unaware of financial support services.21 Additionally, a recent analysis of Medicare data found that out‐of‐pocket expenses during the year after a cancer diagnosis were higher for people diagnosed in 2015 than for those diagnosed in 2011.22
We also found that higher out‐of‐pocket expenses were more likely for people with blood clots, osteoarthritis, or cardiovascular disease than for people without these conditions. The relationship between costs, cancer, and other health conditions is complex and can depend on the length of time a person has had each condition, condition severity, and treatment intensity and type. It was not possible to investigate all these factors in our study, but we jointly analysed data for people with various health conditions and by cancer status, which is a notable strength compared with other studies in Australia.
Limitations
Self‐reported expenditure data are subject to recall and recency or telescoping biases. However, other studies have found that this approach can provide reasonable information, despite participants under‐ or overestimating personal expenditure, depending on the context, number of questions, and the look‐back period.23,24,25 The categorical response options we used did not allow for precise estimates of mean out‐of‐pocket costs per person, but we could differentiate between cost levels for different subgroups.
Our findings may not be directly generalisable to the Australian population. The study cohort was broadly healthier than the general population,26,27 a larger proportion had private health insurance (73% v 55%28), and a smaller proportion smoked (aged 55 years or older: 2% v 10%29). Survivor bias is also possible; that is, participants with poorer health outcomes may have been underrepresented. If higher out‐of‐pocket expenses are related to receiving timely and best practice care, our analysis might be biased by overrepresentation of people who could afford care, and the larger proportion of people with private health insurance could bias the distribution of out‐of‐pocket expenses. However, as other studies have reported, associations found in the 45 and Up Study cohort are likely to be robust.30,31 We did not have data on cancers diagnosed during 2020 but before the questionnaire (expected to be a relatively small number), and participants diagnosed in this year might have been misclassified as having no cancer, reducing the association between cancer and out‐of‐pocket expenses. Further work is needed to assess associations between higher out‐of‐pocket costs and specific cancer treatments, as well as with health outcomes.
Conclusions
We have provided a uniquely detailed insight into the types and levels of out‐of‐pocket health care expenses for people in Australia. We report associations between higher out‐of‐pocket expenses and key socio‐demographic and health characteristics, including cancer status. Higher out‐of‐pocket costs are associated with greater socio‐economic advantage, but they were also independently associated with having cancer, particularly during the two years following diagnosis. Out‐of‐pocket expenses for people with cancer can exacerbate financial strain at a time of vulnerability, and affect health care equity because some people cannot pay for timely care or all available treatment options.
Box 1 – Socio‐demographic and health characteristics of respondents to the 45 and Up Study follow‐up survey (2020), overall and by cancer status
|
Characteristic |
All respondents |
People with cancer |
People without cancer |
||||||||||||
|
|
|||||||||||||||
|
All respondents |
45 061 |
7916 |
37 145 |
||||||||||||
|
Age at follow‐up (years) |
|
|
|
||||||||||||
|
Median (IQR) |
70 (64–76) |
74 (67–79) |
69 (63–75) |
||||||||||||
|
Under 60 |
3403 (8%) |
254 (3%) |
3149 (8%) |
||||||||||||
|
60–69 |
19 079 (42%) |
2317 (29%) |
16 762 (45%) |
||||||||||||
|
70–79 |
15 603 (35%) |
3370 (43%) |
12 233 (33%) |
||||||||||||
|
80 or older |
6976 (15%) |
1975 (25%) |
5001 (13%) |
||||||||||||
|
Sex |
|
|
|
||||||||||||
|
Women |
25 213 (56%) |
3656 (46%) |
21 557 (58%) |
||||||||||||
|
Men |
19 848 (44%) |
4260 (54%) |
15 588 (42%) |
||||||||||||
|
Accessibility/remoteness* |
|
|
|
||||||||||||
|
Major cities |
22 387 (50%) |
4021 (51%) |
18 366 (49%) |
||||||||||||
|
Inner regional |
16 176 (36%) |
2907 (37%) |
13 269 (36%) |
||||||||||||
|
Outer regional/remote/very remote |
4738 (11%) |
782 (10%) |
3956 (11%) |
||||||||||||
|
Missing data |
1760 (4%) |
206 (3%) |
1554 (4%) |
||||||||||||
|
Socio‐economic standing† |
|
|
|
||||||||||||
|
Quintile 1 (most disadvantage) |
7190 (16%) |
1318 (17%) |
5872 (16%) |
||||||||||||
|
Quintile 2 |
8696 (19%) |
1521 (19%) |
7175 (19%) |
||||||||||||
|
Quintile 3 |
8282 (18%) |
1452 (18%) |
6830 (18%) |
||||||||||||
|
Quintile 4 |
8278 (18%) |
1483 (19%) |
6795 (18%) |
||||||||||||
|
Quintile 5 (least disadvantage) |
10 447 (23%) |
1864 (24%) |
8583 (23%) |
||||||||||||
|
Missing data |
2168 (5%) |
278 (4%) |
1890 (5%) |
||||||||||||
|
Household income |
|
|
|
||||||||||||
|
Less than $30 000 |
9649 (21%) |
1976 (25%) |
7673 (21%) |
||||||||||||
|
$30 000–49 999 |
7744 (17%) |
1485 (19%) |
6259 (17%) |
||||||||||||
|
$50 000–89 999 |
11 172 (25%) |
1870 (24%) |
9302 (25%) |
||||||||||||
|
$90 000–119 999 |
3515 (8%) |
544 (7%) |
2971 (8%) |
||||||||||||
|
$120 000 or more |
6090 (14%) |
842 (11%) |
5248 (14%) |
||||||||||||
|
Unknown/prefer not to answer |
6891 (15%) |
1199 (15%) |
5692 (15%) |
||||||||||||
|
Health insurance |
|
|
|
||||||||||||
|
Private health insurance |
32 897 (73%) |
5824 (74%) |
27 073 (73%) |
||||||||||||
|
Department of Veterans’ Affairs |
657 (1%) |
146 (2%) |
511 (1%) |
||||||||||||
|
Healthcare card |
6458 (14%) |
1252 (16%) |
5206 (14%) |
||||||||||||
|
No health insurance |
5049 (11%) |
694 (9%) |
4355 (12%) |
||||||||||||
|
Highest education (baseline questionnaire) |
|
|
|
||||||||||||
|
No school certificate |
2626 (6%) |
522 (7%) |
2104 (6%) |
||||||||||||
|
School certificate |
7751 (17%) |
1437 (18%) |
6314 (17%) |
||||||||||||
|
High school completed |
4010 (9%) |
698 (9%) |
3312 (9%) |
||||||||||||
|
Certificate/diploma/trade/apprenticeship |
14 851 (33%) |
2612 (33%) |
12 239 (33%) |
||||||||||||
|
University degree |
15 430 (34%) |
2584 (33%) |
12 846 (35%) |
||||||||||||
|
Unknown/no response |
393 (1%) |
63 (1%) |
330 (1%) |
||||||||||||
|
Work status |
|
|
|
||||||||||||
|
Paid work/self‐employed |
12 817 (28%) |
1575 (20%) |
11 242 (30%) |
||||||||||||
|
Retired |
28 652 (64%) |
5736 (72%) |
22 916 (62%) |
||||||||||||
|
Other (including unemployed or unpaid work) |
3056 (7%) |
476 (6%) |
2580 (7%) |
||||||||||||
|
Missing data |
536 (1%) |
129 (2%) |
407 (1%) |
||||||||||||
|
Marital status |
|
|
|
||||||||||||
|
Married/de facto/partner |
32 923 (73%) |
5641 (71%) |
27 282 (73%) |
||||||||||||
|
No partner |
11 868 (26%) |
2211 (28%) |
9657 (26%) |
||||||||||||
|
Missing data |
270 (1%) |
64 (1%) |
206 (1%) |
||||||||||||
|
Smoking status |
|
|
|
||||||||||||
|
Never smoked |
28 594 (63%) |
4778 (60%) |
23 816 (64%) |
||||||||||||
|
Formerly smoked |
14 907 (33%) |
2880 (36%) |
12 027 (32%) |
||||||||||||
|
Currently smokes |
1082 (2%) |
167 (2%) |
915 (2%) |
||||||||||||
|
Unknown/no response |
478 (1%) |
91 (1%) |
387 (1%) |
||||||||||||
|
Cancer status |
|
|
|
||||||||||||
|
No cancer 1994–2019 |
37 145 (82%) |
— |
37 145 (100%) |
||||||||||||
|
Cancer diagnosed 1994–2019 |
7916 (18%) |
7916 (100%) |
— |
||||||||||||
|
More than one cancer |
831 (2%) |
831 (10%) |
— |
||||||||||||
|
Diagnosed two years or less before the survey |
861 (2%) |
861 (11%) |
— |
||||||||||||
|
Diagnosed more than two years before the survey |
7055 (16%) |
7055 (89%) |
— |
||||||||||||
|
Health conditions |
|
|
|
||||||||||||
|
Cardiovascular disease |
9951 (22%) |
2129 (27%) |
7822 (21%) |
||||||||||||
|
High blood pressure |
18 746 (42%) |
3581 (45%) |
15 165 (41%) |
||||||||||||
|
Diabetes (type 1 or 2) |
4731 (10%) |
1038 (13%) |
3693 (10%) |
||||||||||||
|
Blood clot/thrombosis |
2418 (5%) |
554 (7%) |
1864 (5%) |
||||||||||||
|
Asthma |
6069 (13%) |
1022 (13%) |
5047 (14%) |
||||||||||||
|
Chronic obstructive pulmonary disease |
2263 (5%) |
449 (6%) |
1814 (5%) |
||||||||||||
|
Osteoarthritis |
10 207 (23%) |
1736 (22%) |
8471 (23%) |
||||||||||||
|
Depression |
6432 (14%) |
1018 (13%) |
5414 (15%) |
||||||||||||
|
Anxiety |
5409 (12%) |
797 (10%) |
4612 (12%) |
||||||||||||
|
Hay fever |
8772 (19%) |
1342 (17%) |
7430 (20%) |
||||||||||||
|
Lymphoedema‡ |
788 (2%) |
457 (6%) |
331 (1%) |
||||||||||||
|
Any of the above |
35 136 (78%) |
6370 (80%) |
28 766 (77%) |
||||||||||||
|
None of the above |
9925 (22%) |
1546 (20%) |
8379 (23%) |
||||||||||||
|
|
|||||||||||||||
|
IQR = interquartile range. * Australian Statistical Geography Standard.15 † Index of Relative Socioeconomic Disadvantage.16 ‡ Recorded for 599 women (2%): 367 women with cancer (10%), 246 women with breast cancer (15%), 232 women without cancer (1%). |
|||||||||||||||
Box 2 – Self‐reported out‐of‐pocket health care expenses during the preceding twelve months for respondents to the 45 and Up Study follow‐up survey (2020): overall, and by cost type and cancer status*
* The data underlying this graph are included in the Supporting Information, table 2, which includes other cost types not shown here: allied health care (> $1000: 2%), other complementary/alternative treatments (1%), medical equipment (1%), home/other modifications (1%), other health care (1%). “Unsure/missing” includes “not applicable” responses. Proportions of respondents who reported more than $1000 in out‐of‐pocket expenses for individual cost types: medications, 6%; doctors/specialists, 10%; medical tests, 2%; hospital/outpatient care, 4%; dental care, 10%; practical/travel costs, 1%.
Box 3 – Proportion of survey respondents who reported overall out‐of‐pocket health care costs greater than $1000 or greater than $10 000, by time since cancer diagnosis*
* The data underlying this graph are included in the Supporting Information, table 4.
Box 4 – Demographic and health characteristics and out‐of‐pocket health care costs greater than $1000 (43% of all survey participants) or $10 000 (3% of all participants): multivariable logistic regression analyses*
CI = confidence interval.* Adjusted for all other listed characteristics. The data underlying this graph are included in the Supporting Information, table 5.† Quintile 1 = most disadvantaged.‡ Department of Veterans’ Affairs recipients (1% of participants) results not shown because of extreme distribution (greater than $1000: adjusted odds ratio, 0.23; 95% CI, 0.18–0.30; greater than $10 000: adjusted odds ratio, 0.32; 95% CI, 0.13–0.79).
Box 5 – Cancer status and total out‐of‐pocket health care expenses greater than $1000 or greater than $10 000 for individual cost types: multivariable logistic regression analyses, by cancer status*
* Adjusted for age at follow‐up, sex, remoteness, socio‐economic status quintile, household income, health insurance status, education, work status, marital status, smoking status, and other health conditions. The data underlying this graph are included in the Supporting Information, table 6, which also includes details for further expense types not shown here.
Box 6 – Characteristics of participants with cancer diagnoses recorded in the New South Wales Cancer Registry, 1994–2019*
|
Characteristic |
All participants |
Diagnosis within past two years |
Diagnosis more than two years ago |
||||||||||||
|
|
|||||||||||||||
|
Participants with cancer |
7916 |
861 |
7055 |
||||||||||||
|
Cancer type |
|
|
|
||||||||||||
|
Breast |
1610 (20%) |
139 (16%) |
1471 (21%) |
||||||||||||
|
Colorectal |
819 (10%) |
91 (11%) |
728 (10%) |
||||||||||||
|
Melanoma |
1365 (17%) |
134 (16%) |
1231 (17%) |
||||||||||||
|
Prostate |
2170 (27%) |
203 (24%) |
1967 (28%) |
||||||||||||
|
Other cancers† |
1952 (25%) |
294 (34%) |
1658 (24%) |
||||||||||||
|
Time since diagnosis (years) |
|
|
|
||||||||||||
|
0.5–1‡ |
222 (3%) |
222 (26%) |
— |
||||||||||||
|
> 1–2 |
639 (8%) |
639 (74%) |
— |
||||||||||||
|
> 2–5 |
1653 (21%) |
— |
1653 (23%) |
||||||||||||
|
> 5–10 |
2131 (27%) |
— |
2131 (30%) |
||||||||||||
|
> 10–20 |
2625 (33%) |
— |
2625 (37%) |
||||||||||||
|
More than 20 years |
646 (8%) |
— |
646 (9%) |
||||||||||||
|
Age at diagnosis (years) |
|
|
|
||||||||||||
|
Under 60 |
2577 (33%) |
70 (8%) |
2507 (36%) |
||||||||||||
|
60–69 |
2952 (37%) |
314 (36%) |
2638 (37%) |
||||||||||||
|
70–79 |
1904 (24%) |
339 (39%) |
1565 (22%) |
||||||||||||
|
80 or older |
483 (6%) |
138 (16%) |
345 (5%) |
||||||||||||
|
Spread of disease at diagnosis |
|
|
|
||||||||||||
|
Localised |
4646 (59%) |
453 (53%) |
4193 (59%) |
||||||||||||
|
Regional spread |
1517 (19%) |
161 (19%) |
1356 (19%) |
||||||||||||
|
Distant metastases |
181 (2%) |
27 (3%) |
154 (2%) |
||||||||||||
|
Unknown |
1572 (20%) |
220 (26%) |
1352 (19%) |
||||||||||||
|
|
|||||||||||||||
|
* Based on most recent cancer type diagnosed; 831 people (10%) people had been diagnosed with two or more cancer types. † Most frequent: non‐Hodgkin lymphoma (304 people, 4%). ‡ Shortest possible time since diagnosis was just over six months for diagnosis at the end of December 2019 and completion of the follow‐up survey in early July 2020. |
|||||||||||||||
Box 7 – Cancer type, time since diagnosis, and higher out‐of‐pocket health care costs: multivariable logistic regression analyses*
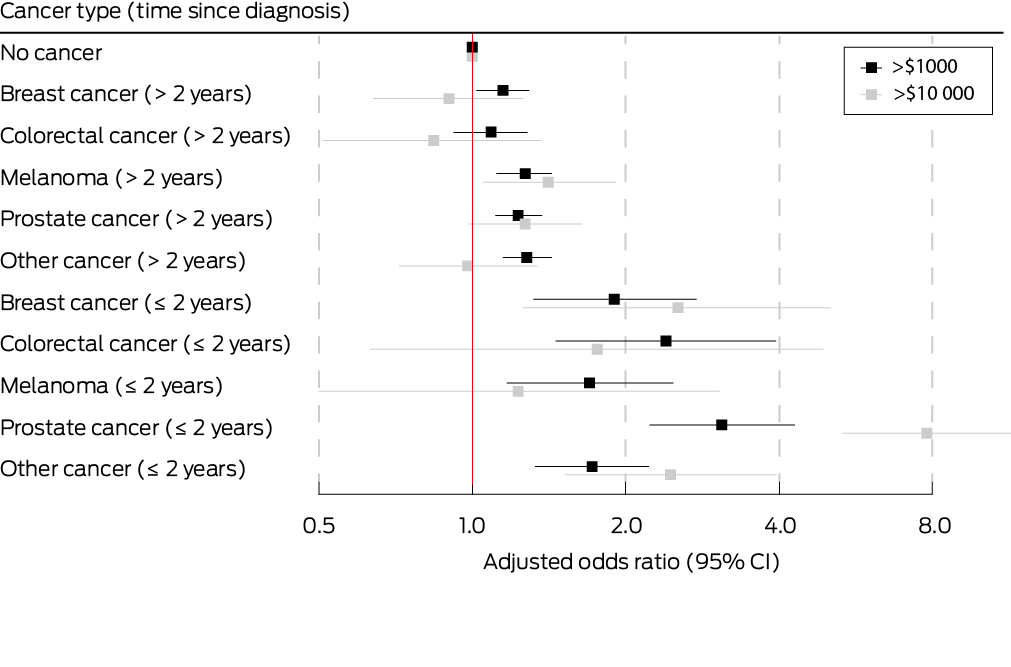
* Adjusted for age at follow‐up, sex, remoteness, socio‐economic status quintile, household income, health insurance status, education, work status, marital status, smoking status, and other health conditions. The data underlying this graph are included in the Supporting Information, table 8.
Received 14 September 2023, accepted 18 December 2023
- David E Goldsbury1,2
- Philip Haywood2,3
- Alison Pearce1,2
- Louisa G Collins4,5
- Deme Karikios6,7
- Karen Canfell1
- Julia Steinberg1
- Marianne F Weber1
- 1 The Daffodil Centre, the University of Sydney, a joint venture with Cancer Council NSW, Sydney, NSW
- 2 Sydney School of Public Health, the University of Sydney, Sydney, NSW
- 3 Centre for Health Economics Research and Evaluation, University of Technology Sydney, Sydney, NSW
- 4 QIMR Berghofer Medical Research Institute, Brisbane, QLD
- 5 Queensland University of Technology, Brisbane, QLD
- 6 Nepean Hospital, Penrith, NSW
- 7 Nepean Clinical School, the University of Sydney, Penrith, NSW
Open access:
Open access publishing facilitated by the University of Sydney, as part of the Wiley – the University of Sydney agreement via the Council of Australian University Librarians.
Data sharing:
The study used third party data not owned or collected by the authors, and sharing of these data is not permitted by the data custodians (Sax Institute, NSW Ministry of Health), as it would compromise participants' confidentiality and privacy. However, the study data are available from the data custodians for approved research projects (see https://www.saxinstitute.org.au/solutions/45‐and‐up‐study/use‐the‐45‐and‐up‐study for details).
We analysed data collected through the 45 and Up Study, managed by the Sax Institute (www.saxinstitute.org.au) in collaboration with its major partner, Cancer Council NSW, and its other partners, the Heart Foundation and the NSW Ministry of Health. We thank the many thousands of people participating in the 45 and Up Study. We also thank Gill Stannard for providing input regarding the questions and the final paper, as well as the Centre for Health Record Linkage for record linkage, the Sax Institute Secure Unified Research Environment (SURE) for hosting the data, and the Sax Institute and Cancer Institute NSW for making their data available to us.
Deme Karikios has received honoraria from MSD, Amgen, and Abbvie, and has advisory roles with MSD and Roche, all unrelated to this project. Karen Canfell is co‐primary investigator in an investigator‐initiated trial of cervical screening, “Compass”, run by the Australian Centre for Prevention of Cervical Cancer (ACPCC), a government‐funded not‐for‐profit charity. Compass receives infrastructure support from the Australian government; the ACPCC has received equipment and a funding contribution from Roche Molecular Diagnostics, and operational support from the Australian government. Karen Canfell is also co‐primary investigator in an investigator‐initiated implementation program, Elimination of Cervical Cancer in the Western Pacific (ECCWP), which receives support from the Minderoo Foundation and equipment donations from Cepheid Inc. Karen Canfell also receives support for a range of other Australian and international projects related to cervical cancer control, including support from philanthropic organisations, the World Health Organization, and government agencies, together with contract funding for monitoring the safety of the National Cervical Screening Program. None of these are directly related to the study reported in this article.
- 1. Australian Institute of Health and Welfare. Health expenditure in Australia 2021–22. Updated 25 Oct 2023. https://www.aihw.gov.au/reports/health‐welfare‐expenditure/health‐expenditure (viewed Nov 2023).
- 2. Australian Institute of Health and Welfare. Disease expenditure in Australia 2019–20. Updated 2 Dec 2022. https://www.aihw.gov.au/reports/health‐welfare‐expenditure/disease‐expenditure‐in‐australia‐2019‐20 (viewed Dec 2022).
- 3. Australian Institute of Health and Welfare. Cancer in Australia 2021 (AIHW cancer series no. 133; cat. no. CAN 144). 1 Dec 2021. https://www.aihw.gov.au/reports/cancer/cancer‐in‐australia‐2021/summary (viewed June 2024).
- 4. Australian Institute of Health and Welfare. Health system overview. 7 July 2022. https://www.aihw.gov.au/reports/australias‐health/health‐system‐overview (viewed June 2023).
- 5. Bygrave A, Whittaker K, Paul C, et al. Australian experiences of out‐of‐pocket costs and financial burden following a cancer diagnosis: a systematic review. Int J Environ Res Public Health 2021; 18: 2422.
- 6. Smith J, Yu J, Gordon LG, Chilkuri M. Financial toxicity and out‐of‐pocket costs for patients with head and neck cancer. Curr Oncol 2023; 30: 4922‐4935.
- 7. Gordon LG, Elliott TM, Wakelin K, et al. The economic impact on Australian patients with neuroendocrine tumours. Patient 2020; 13: 363‐373.
- 8. Gordon LG, Ferguson M, Chambers SK, Dunn J. Fuel, beds, meals and meds: out‐of‐pocket expenses for patients with cancer in rural Queensland. Cancer Forum 2009; 33: 202‐208.
- 9. Consumers Health Forum of Australia. Out of pocket pain. Apr 2018. Archived: https://web.archive.org/web/20221111155355/https://chf.org.au/sites/default/files/20180404_oop_report.pdf (viewed Nov 2023).
- 10. Gordon LG, Walker SM, Mervin MC, et al. Financial toxicity: a potential side effect of prostate cancer treatment among Australian men. Eur J Cancer Care (Engl) 2017; 26: e12392.
- 11. Callander EJ. Out‐of‐pocket fees for health care in Australia: implications for equity. Med J Aust 2023; 218: 294‐297.https://www.mja.com.au/journal/2023/218/7/out‐pocket‐fees‐health‐care‐australia‐implications‐equity
- 12. 45 and Up Study Collaborators; Banks E, Redman S, Jorm L, et al. Cohort profile: the 45 and Up Study. Int J Epidemiol 2008; 37: 941‐947.
- 13. Bleicher K, Summerhayes R, Baynes S, et al. Cohort profile update: the 45 and Up Study. Int J Epidemiol 2023; 52: e92‐e101.
- 14. von Elm E, Altman DG, Egger M, et al; STROBE Initiative. The Strengthening the Reporting of Observational Studies in Epidemiology (STROBE) statement: guidelines for reporting observational studies. Lancet 2007; 370: 1453‐1457.
- 15. Australian Bureau of Statistics. Australian Statistical Geography Standard (ASGS), volume 5. Remoteness structure (1270.0.55.005). 16 Mar 2018. https://www.abs.gov.au/ausstats/abs@.nsf/mf/1270.0.55.005 (viewed Nov 2023).
- 16. Australian Bureau of Statistics. Index of Relative Socio‐economic Disadvantage (IRSD). In: Socio‐Economic Indexes for Areas (SEIFA), Australia, 2021. 27 Apr 2021. https://www.abs.gov.au/statistics/people/people‐and‐communities/socio‐economic‐indexes‐areas‐seifa‐australia/latest‐release#index‐of‐relative‐socio‐economic‐disadvantage‐irsd‐ (viewed Nov 2023).
- 17. Callander EJ, Fox H, Lindsay D. Out‐of‐pocket healthcare expenditure in Australia: trends, inequalities and the impact on household living standards in a high‐income country with a universal health care system. Health Econ Rev 2019; 9: 10.
- 18. Callander E, Bates N, Lindsay D, et al. The patient co‐payment and opportunity costs of accessing healthcare for Indigenous Australians with cancer: a whole of population data linkage study. Asia Pac J Clin Oncol 2019; 15: 309‐315.
- 19. Gordon LG, Elliott TM, Olsen CM, et al. Patient out‐of‐pocket medical expenses over 2 years among Queenslanders with and without a major cancer. Aust J Prim Health 2018; 24: 530‐536.
- 20. Chan RJ, Gordon LG, Tan CJ, et al. Relationships between financial toxicity and symptom burden in cancer survivors: a systematic review. J Pain Symptom Manag 2019; 57: 646‐660.
- 21. White V, Gough K, Wood C, et al. Suboptimal experiences with out‐of‐pocket costs, financial disclosure, and support information among people treated for cancer. Med J Aust 2023; 219: 28‐29. https://www.mja.com.au/journal/2023/219/1/suboptimal‐experiences‐out‐pocket‐costs‐financial‐disclosure‐and‐support
- 22. Rodriguez‐Acevedo AJ, Chan RJ, Olsen CM, et al. Out‐of‐pocket medical expenses compared across five years for patients with one of five common cancers in Australia. BMC Cancer 2021; 21: 1055.
- 23. Lavado RF, Brooks BPC, Hanlon M. Estimating health expenditure shares from household surveys. Bull World Health Organ 2013; 91: 519‐524C.
- 24. Winter J. Response bias in survey‐based measures of household consumption. Economics Bulletin 2004; 3(9): 1‐12. https://econpapers.repec.org/article/eblecbull/eb‐03c80001.htm (viewed May 2024).
- 25. Browning M, Crossley TF, Weber G. Asking consumption questions in general purpose surveys. Economic Journal 2003; 113: F540‐F567. https://econpapers.repec.org/article/ecjeconjl/v_3a113_3ay_3a2003_3ai_3a491_3ap_3af540‐f567.htm (viewed May 2024).
- 26. Banks E, Jorm L, Lujic S, et al. Health, ageing and private health insurance: baseline results from the 45 and Up Study cohort. Aust New Zealand Health Policy 2009; 6: 16.
- 27. Creighton N, Purdie S, Soeberg M, et al. Self‐selection in a population‐based cohort study: impact on health service use and survival for bowel and lung cancer assessed using data linkage. BMC Med Res Methodol 2018; 18: 84.
- 28. Australian Prudential Regulation Authority. Quarterly private health insurance statistics. March 2024. https://www.apra.gov.au/quarterly‐private‐health‐insurance‐statistics (viewed June 2024).
- 29. Australian Bureau of Statistics. Smoking, 2020–21 financial year. 21 Mar 2022. https://www.abs.gov.au/statistics/health/health‐conditions‐and‐risks/smoking/2020‐21 (viewed June 2023).
- 30. Mealing NM, Banks E, Jorm LR, et al. Investigation of relative risk estimates from studies of the same population with contrasting response rates and designs. BMC Med Res Methodol 2010; 10: 26.
- 31. Yap S, Luo Q, Wade S, et al. Raking of data from a large Australian cohort study improves generalisability of estimates of prevalence of health and behaviour characteristics and cancer incidence. BMC Med Res Methodol 2022; 22: 140.
Abstract
Objectives: To investigate self‐reported out‐of‐pocket health care expenses, both overall and by cost type, for a large population‐based sample of Australians, by cancer status and socio‐demographic and medical characteristics.
Study design: Cross‐sectional study.
Setting, participants: New South Wales residents participating in the 45 and Up Study (recruited aged 45 years or older during 2005–2009) who completed the 2020 follow‐up questionnaire; survey responses linked with New South Wales Cancer Registry data.
Main outcome measures: Proportions of respondents who reported that out‐of‐pocket health care expenses during the preceding twelve months exceeded $1000 or $10 000; adjusted odds ratios (aORs) for associations with socio‐demographic and medical characteristics.
Results: Of the 267 357 recruited 45 and Up Study participants, 45 061 completed the 2020 survey (response rate, 53%); 42.7% (95% confidence interval [CI], 42.2–43.1%) reported that overall out‐of‐pocket health care expenses during the previous year exceeded $1000, including 55.4% (52.1–58.7%) of participants diagnosed in the preceding two years and 44.9% (43.7–46.1%) of participants diagnosed with cancer more than two years ago. After adjustment for socio‐demographic factors, out‐of‐pocket expenses greater than $1000 were more likely to be reported by participants with cancer than by those without cancer (diagnosis in past two years: aOR, 2.06 [95% CI, 1.77–2.40]; diagnosis more than two years ago: aOR, 1.22 [95% CI, 1.15–1.29]). The odds of out‐of‐pocket expenses exceeding $1000 increased with area‐based socio‐economic advantage and household income, and were higher for people with private health insurance (v people with Medicare coverage only: aOR, 1.64; 95% CI, 1.53–1.75). Out‐of‐pocket expenses exceeding $10 000 were also more likely for participants diagnosed with cancer during the past two years (v no cancer: aOR, 3.30; 95% CI, 2.56–4.26).
Conclusions: People diagnosed with cancer during the past two years were much more likely than people without cancer to report twelve‐month out‐of‐pocket health care expenses that exceeded $1000. Out‐of‐pocket expenses for people with cancer can exacerbate financial strain at a time of vulnerability, and affect health care equity because some people cannot pay for all available treatments.