


The known: Applying population‐based measures to assessing the working time lost to occupational injury and disease has not been reported in Australia.
The new: Injury and disease for which workers’ compensation was granted resulted in 41 194 working years lost (WYL) per annum in Australia during 2012–17, 40% of which was attributable to traumatic injuries and 21% to musculoskeletal disorders. The WYL was greater for male than female workers, and the individual burden increased with age.
The implications: Occupational injury and disease substantially impair labour force productivity. Measuring their impact is important for effective health surveillance, policy development, and resource allocation.
Being employed has considerable health benefits at both the individual and population levels, including lower risk of depression,1 better physical health,2 lower public health care expenditure,3 and lower age‐specific mortality.4 Conversely, being unable to work because of injury or illness contributes to poorer mental health,5 shorter life expectancy,6 chronic back pain,7 and greater risk of suicide.8 Many health conditions impair the ability to work, including cardiovascular disease, diabetes, cancer, musculoskeletal disorders, and mental health conditions.9,10 Occupational injury and disease were implicated in 1.88 million deaths and the loss of 89.7 million disability‐adjusted life years around the world in 2018;11 the estimated economic impact in Australia during 2012–13 was $61.8 billion.12
Effective prevention and occupational rehabilitation can mitigate these negative health and economic consequences.13 Just as public health policy is informed by knowledge of the population burden of disease and its distribution,14 occupational health policy and resource allocation should be informed by information about the burden of working time lost to injury and disease and its distribution across the labour force.
In Australia, workers’ compensation systems operated by state, territory, and federal governments cover 94% of workers.15 When employment is a contributing factor for an injury or disease, workers can apply for wage replacement benefits while off work, as well as support with costs for health care and other services.15 Workers can only seek compensation for a single compensable injury or disease, not for concurrent or pre‐existing health conditions. Workers’ compensation schemes are broadly similar across Australia, but there are some differences in eligibility criteria for receiving benefits and the amount and duration of wage replacement benefits.15,16
Over the past twenty years, access to workers’ compensation in Australia has become more restricted and the level of benefits reduced,15 despite evidence for a growing need for support, including for injured workers experiencing psychological distress.5 The increasing prevalence of chronic diseases among working age people14 and the shift to a service‐based economy influence the nature of worked‐related injury and disease in Australia.
We therefore estimated the national burden of working time lost to compensable occupational injury and disease, and characterised the distribution of time lost by age, sex, and injury or disease type.
Methods
In our retrospective population‐based study, we analysed data from the National Dataset for Compensation‐based Statistics (NDS), compiled by SafeWork Australia. The NDS includes harmonised data for all claims granted during 1 July 2003 – 30 June 2019 for all Australian workers’ compensation schemes, except that of the Department of Veterans’ Affairs.17 The NDS includes demographic information about the claimant and claim‐related information, such as the injury or disease type leading to the claim, and the number of hours that wage replacement benefits were paid. NDS data have been used in several studies of occupational cohorts,16 to identify determinants of return to work,18 and to examine the impact of legislative reforms.19 The NDS provides data in a format that does not enable identification of repeated claims by an individual worker. The NDS data were provided to the investigators by Safe Work Australia.
Inclusion and exclusion criteria
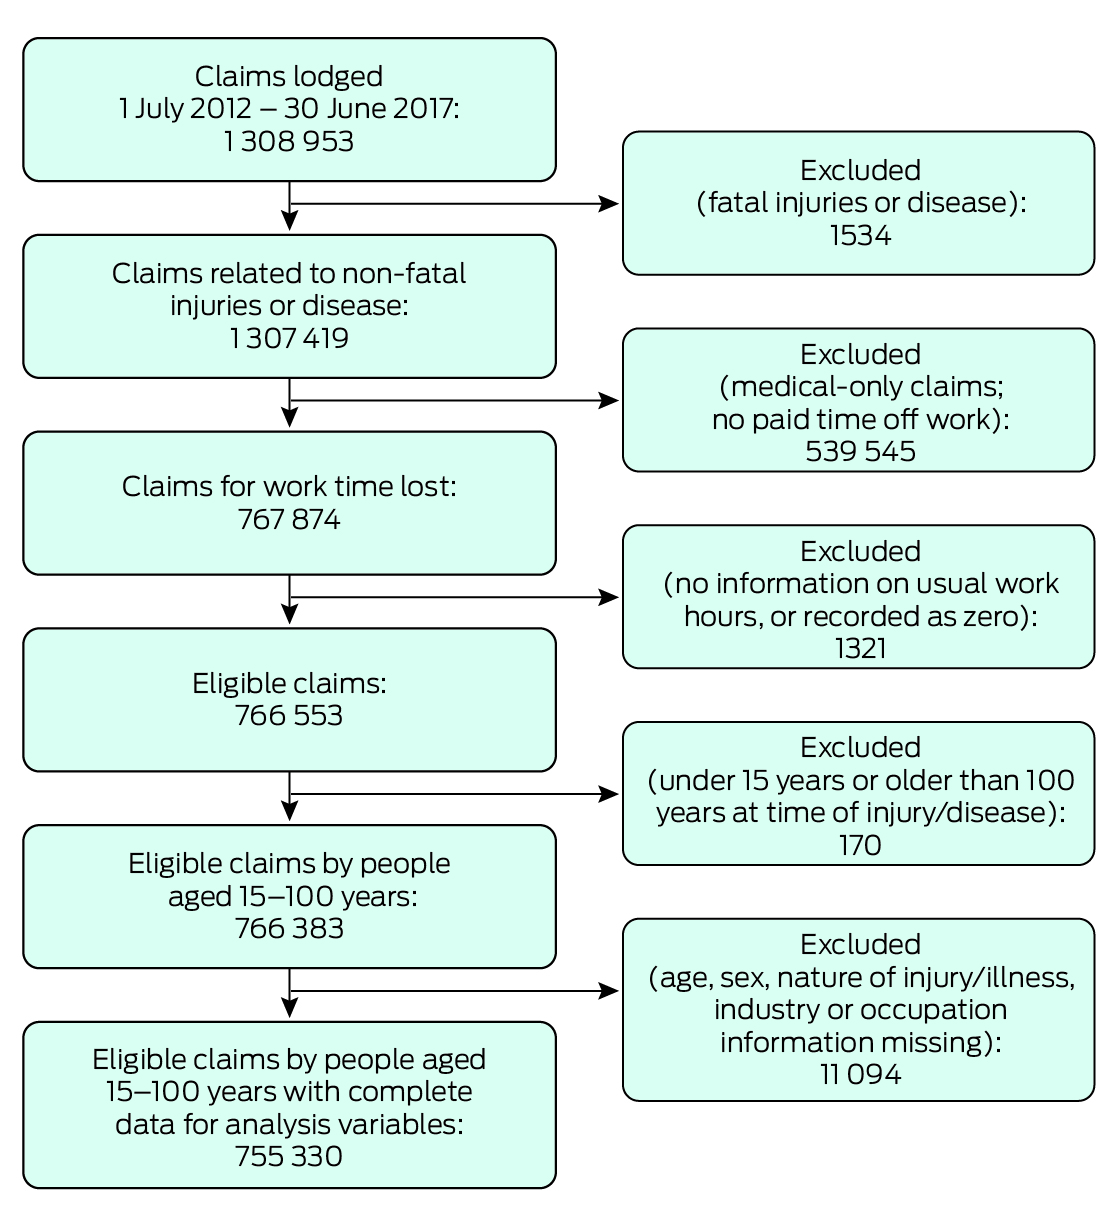
We analysed claims that included wage replacement payments and lodged during 1 July 2012 – 30 June 2017, a timeframe chosen to balance recency of data with manageable sample size, and because a two‐year follow‐up period was required for assessing the primary outcome. Claims for workers under 15 years or older than 100 years of age were excluded, as were claims for fatal injuries, and those for which information about sex, nature of the injury or disease, occupation, or industry was missing.
Outcomes
We estimated the overall amount of working time lost to compensable occupational injury and disease as working years lost (WYL), a measure that takes into account both the number of claims for lost time and the amount of compensated working time lost. It is calculated for a given group by dividing the total number of weeks of wage replacement benefits paid by 48 (to convert from weeks to years, assuming four weeks’ annual leave) and then by five (number of years in the study period).
The number of weeks of wage replacement benefits paid was derived from claims‐level NDS data. For each claim, the number of hours of wage replacement benefits paid was divided by the usual weekly pre‐injury number of hours worked by the claimant. In some workers’ compensation systems, the maximum duration of weekly benefits is two years (104 weeks). We therefore right‐censored the number of weeks of wage replacement benefits at 104 weeks to ensure a consistent follow‐up period.
The WYL is equivalent to the total number of workers in a given group who are unable to work during one calendar year. We also calculated the rate of WYL per 10 000 fulltime equivalent (FTE) years worked. The denominator for rate calculations was the number of persons covered by workers’ compensation, estimated by the Australian Bureau of Statistics from labour force data and included in the NDS.
The secondary outcome was the annual number of granted claims for time lost. Claim counts are often used to assess the distribution of occupational injury and disease across the labour force. We report claim counts and claims per 10 000 FTE years worked.
Covariates
We examined WYL at the national level and by sex, age group (15–24, 25–34, 35–44, 45–54, and 55 years or older), and injury or disease group and type, defined according to the national standard Type of Occurrence Classification System (TOOCS; version 3.1).20 The 25 high level TOOCS nature of injury group codes were collapsed to eight major groups for our analysis: traumatic joint and muscle injuries, musculoskeletal disorders, mental health conditions, fractures, wounds and lacerations, other injuries, other diseases, and other claims (Supporting Information, table 1). The lowest level TOOCS nature of injury codes were used for injury or disease types, but some descriptors were modified for clearer presentation (Supporting Information, table 2).
Data analysis
We calculated numbers, proportions, and rates for WYL and claims, overall and by sex, age, as well as numbers and proportions for injury or disease group. WYL numbers and proportions by injury and disease group were graphed to illustrate the burden and distribution of WYL by sex and age (in years). We calculated WYL numbers and proportions for injury and disease groups overall and by sex and age group; in each case, we report the ten types with the largest WYL values. We estimated the 95% confidence interval (CI) for WYL by calculating the CI of the mean and multiplying the CI end‐points by the number of observations. Analyses were undertaken in Stata 17.0, and graphs generated using the mycolours package.
Ethics approval
Our study was granted an exemption from formal ethics review by the Monash University Human Research Ethics Committee on 8 October 2014 (CF14/2995–2014001663) as it was deemed to satisfy section 5.1.22 of the National Statement on Ethical Conduct in Human Research.21
Results
Complete data for analysis variables were available for 755 330 eligible claims by people aged 15–100 years for compensable injuries and disease that led to 41 194 (95% CI, 41 020–41 368) WYL/year (Box 1). The traumatic joint and muscle injuries group included 68 023 claims/year (45.0% of all claims) and incurred 16 494 WYL/year (40.0% of all WYL); musculoskeletal disorders led to 19 637 claims (13.0%) and 8547 WYL (20.7%) per annum, mental health conditions to 8440 claims (5.6%) and 5361 WYL (13.0%) per annum, fractures to 12 816 claims (8.5%) and 4276 WYL (10.4%) per annum, and wounds and lacerations to 26 366 claims (17.5%) and 3449 WYL (8.4%) per annum (Box 2).
Of detailed injury or disease types, soft tissue injuries due to trauma incurred 6847 WYL/year (16.6%), fractures (excluding skull) 3824 WYL/year (9.3%), trauma to muscles and tendons, unspecified 2649 WYL/year (6.4%), back pain, lumbago, and sciatica 2170 WYL/year (5.3%), and reaction to stressors 1915 WYL/year (4.6%) (Supporting Information, table 3).
Working years lost, by sex
The annual WYL number and rate were each higher for men (25 367 [95% CI, 25 230–25 503] WYL/year; 42.6 [95% CI, 42.1–43.1] WYL/10 000 FTE years) than for women (15 827 [95% CI, 15 720–15 935] WYL/year; 38.8 [95% CI, 38.2–39.4] WYL/10 000 FTE years) (Box 2). The annual WYL number was higher for men than women in all major injury and disease groups except mental health conditions (men: 2317 [95% CI, 2277–2356] WYL/year; women: 3045 [95% CI, 3000–3089] WYL/year); the WYL rates were also higher for men than women for all major injury and disease types except mental health conditions (men: 3.9 [95% CI, 3.7–4.0] WYL/10 000 FTE years; women: 7.5 [95% CI, 7.2–7.7] WYL/10 000 FTE years) and musculoskeletal disorders (men: 8.5 [95% CI, 8.3–8.7] WYL/10 000 FTE years; women: 8.5 [95% CI, 8.2–8.8] WYL/10 000 FTE years) (Box 3; Supporting Information, table 4).
The injury groups that included the largest proportions of annual WYL numbers were traumatic joint and muscle injuries (men: 41.1%; women: 38.3%) and musculoskeletal disorders (men: 20.0%; women: 22.0%). The proportion for mental health conditions was larger for women than men (19.2% v 9.1%) (Box 3; Supporting Information, table 4).
The detailed injury or disease types for which annual WYL were largest were soft tissue injuries due to trauma (men: 4344 [95% CI, 4288–4400] WYL/year; women: 2503 [95% CI, 2461–2545] WYL/year) and fractures (excluding skull) (men: 2631 [95% CI, 2591–2671] WYL/year; women: 1193 [95% CI, 1167–1219] WYL/year). Trauma was involved in seven (49.0% of all WYL) and mental health problems in one (30.6%) of the ten injury types incurring the most WYL in men (total: 61.4%); trauma was involved in six (41.8% of all WYL) and mental health problems in two (12.7%) of the ten injury types incurring the most WYL in women (total: 57.9%) (Supporting Information, figure 3).
Working years lost, by age
Workers aged 45–100 years made 66 742 claims per year (44.1% of all claims) and incurred 21 763 WYL/year (52.8% of all WYL); workers aged 15–34 years made 51 523 claims per year (34.1%) and incurred 9676 WYL/year (23.4%). The overall WYL rate was 41.0 (95% CI, 40.6–41.4) WYL/10 000 FTE years. The rate increased with age group, from 21.8 (95% CI, 21.0–22.6) WYL/10 000 FTE years for workers aged 15–24 years to 59.3 (95% CI, 58.1–60.5) WYL/10 000 FTE years for those aged 55–100 years (Box 2).
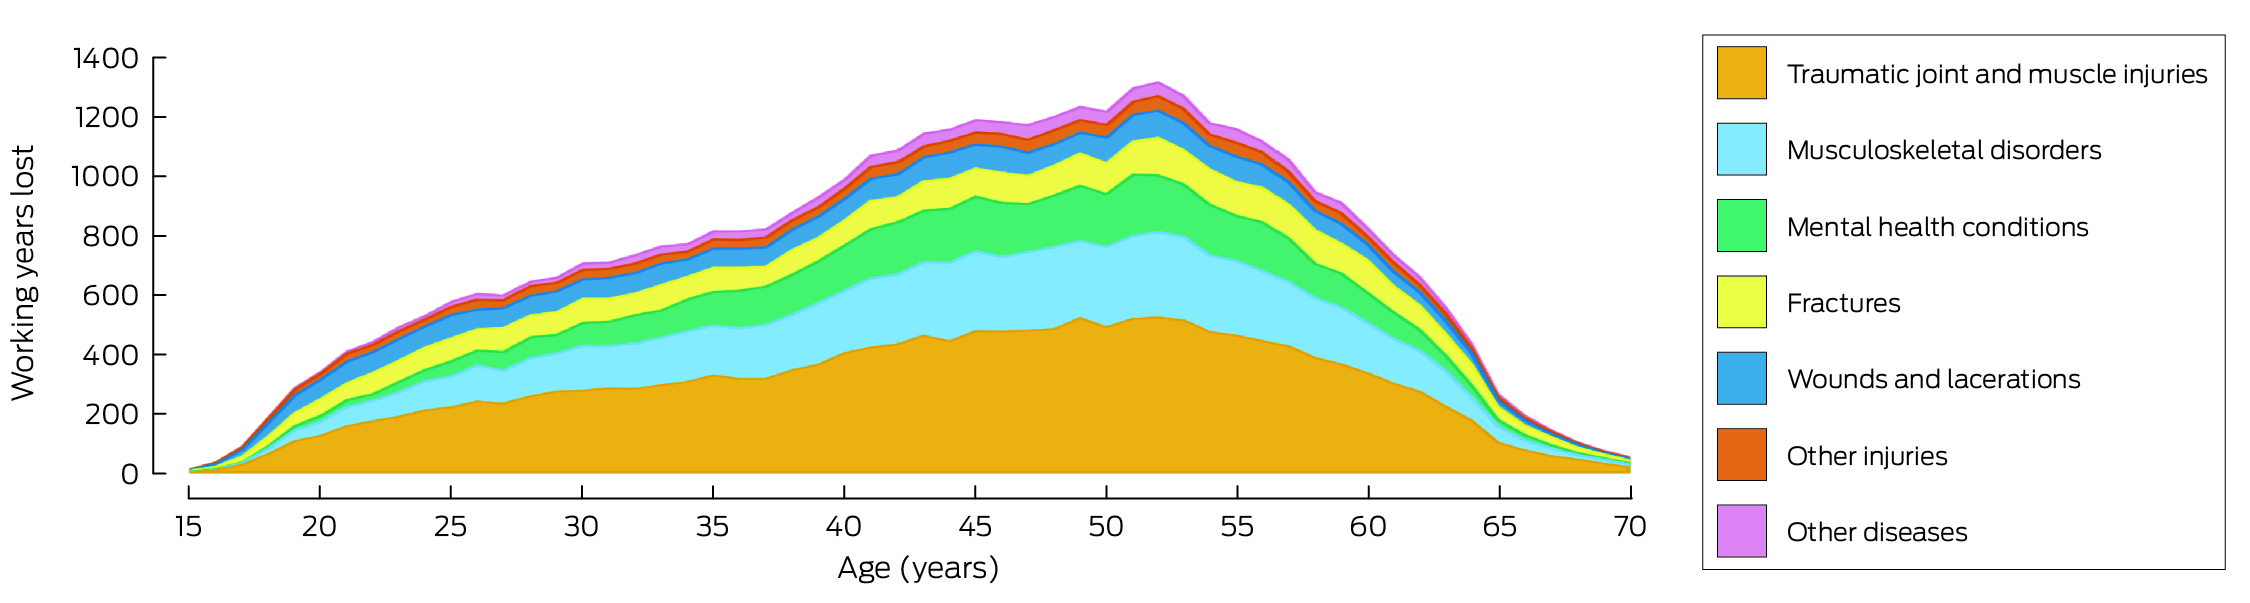
The overall annual time lost increased from 36 WYL/year at age 15 years to 607 WYL/year at age 26 years, the window during which most people enter the workforce. This increase continued more slowly from 27 years of age (602 WYL/year) to 37 years of age (824 WYL/year), before increasing more rapidly to age 45 years (1192 WYL/year) and peaking at age 52 years (1320 WYL/year). The decline was most rapid between this age and 65 years (269 WYL/year), the period during which people begin to exit the workforce (Box 4).
The annual WYL numbers for traumatic injury (4996 [95% CI, 4937–5055] WYL/year) and musculoskeletal disorders (2702 [95% C I, 2657–2746] WYL/year) were highest for workers aged 45–54 years. The rate for traumatic joint and muscle injury was 8.4 [95% CI, 7.9–8.9] WYL/10 000 FTE years for people aged 15–24 years, and 24.0 [95% CI, 23.2–24.8] WYL/10 000 FTE years for those aged 54–100 years; the rate for musculoskeletal disorders was 3.3 [95% CI, 3.0–3.6] WYL/10 000 FTE years for people aged 15–24 years, and 12.1 [95% CI, 11.6–12.7] WYL/10 000 FTE years for those aged 54–100 years. The WYL proportion attributable to mental health conditions was 5.9% for workers aged 15–24 years (rate: 1.3 [95% CI, 1.1–1.5 WYL/10 000 FTE years), 15.3% for those aged 35–44 years (6.4 [95% CI, 6.1–6.7] WYL/10 000 FTE years), and 11.9% for people aged 54–100 years (7.1 [95% CI, 6.6–7.5] WYL/10 000 FTE years) (Supporting Information, table 5).
The leading specific injury or disease types for all age groups were soft tissue injury caused by trauma (range: 15–24 years, 15.5% to 45–54 years, 16.8% of all WYL) and fractures (excluding skull) (range: 35–44 years, 7.7% to 15–24 years, 13.4% of all WYL). Eight of the ten leading causes of WYL for workers aged 15–24 years involved trauma (62.4% of all WYL), seven of ten for those aged 25–34 years (50.0%), and six of ten for workers aged 45–100 years (46.2%). Mental health problems (reaction to stressors and anxiety/stress disorder) were among the ten leading causes in all age groups except workers aged 15–24 years (25–34 years, 3.8% [reaction to stressors only]; 35–44 years, 9.4%; 45–54 years, 9.0%; 54–100 years, 7.7%) (Supporting Information, table 6).
Discussion
During the five years to June 2017, compensable occupational injury and disease in Australia resulted in lost working time equivalent to more than 41 000 jobs lost per annum, distributed across about 150 000 workers’ compensation claims per year. Our findings illustrate the large impact force of work‐related injury and disease on productivity and the labour. As employment is generally good for health,22 these findings are consistent with those of other authors23 that occupational rehabilitation and programs that support returning to work after injury or disease are as crucial for the health of workers as primary prevention.
The distribution of lost working time by sex reflects the higher labour force participation of men in Australia (70.6% v 62.6% for women in March 2024)24 and the longer periods of time off work following injury or disease for older workers. However, the WYL measure provides new insights into the consequences of occupational injury and disease by combining the prevalence of injury or disease and its impact, reflecting the total work time lost. For example, while 5.6% of granted workers’ compensation claims for lost work time were from workers with mental health problems, these conditions were responsible for 13.0% of all WYL (and 19.2% of all WYL for female workers). Similarly, the proportion of time lost to musculoskeletal disorders (20.7%) was much larger than the proportion of claims related to these conditions (13.0%).
The frequency and incidence of workers’ compensation claims have been the main parameters considered by occupational health and safety policy in Australia,25 and the major objective has been to reduce the frequency and incidence of claims and injury. Our study shows how alternative measures, including WYL, can inform a more nuanced national approach. By incorporating the impact of injury and disease into the burden estimate, the WYL can help direct strategies to areas of greater need, similar to approaches in broader health care planning. For example, health policy is informed by national burden of disease estimates,14 while international estimates of the global burden of injury and disease support efforts to improve health systems and reduce health disparities.26
Limitations
Limitations to analyses of NDS data include the fact that they underestimate the number of occupational injuries and their impact; according to a 2021–22 national survey, only 31% of work‐related injuries are followed by workers’ compensation claims.27 The NDS dataset cannot be used to estimate productivity loss related to presenteeism. The 2012–17 NDS data are the most recent data available; more recent changes in workforce composition and risks to worker health are possible, including substantial changes during the coronavirus 2019 (COVID‐19) pandemic.
Conclusion
We report the first national study using a population‐level occupational health measure that takes both the incidence and the impact of occupational injury and disease into account. We found that compensable occupational injury and disease results in more than 41 000 working years lost each year in Australia by about 150 000 workers. WYL patterns broadly reflect the gender distribution of the labour force and the effects of ageing, but our findings indicate that some medical conditions require more attention than suggested by estimated frequencies of prevalence and compensation claims. The burden of working years lost in specific occupations and industries, and by other social and demographic characteristics, should be further investigated to inform future occupational health and workers’ compensation policy.
Box 1 – Selection of workers’ compensation claims in Australia, 1 July 2012 – 30 June 2017, for inclusion in our analysis
Box 2 – Numbers and rates of working years lost and of granted compensation claims for time lost, Australia, 1 July 2012 – 30 June 2017, by sex, age group, and injury or disease group
|
|
Working years lost per annum |
Claims per annum |
|||||||||||||
|
Characteristic |
Number (95% CI) |
Proportion |
Rate, per 10 000 FTE years (95% CI) |
Number |
Proportion |
Rate, per 10 000 FTE years |
|||||||||
|
|
|||||||||||||||
|
All claimants |
41 194 (41 020–41 368) |
|
41.0 (40.6–41.4) |
151 058 |
|
150.5 |
|||||||||
|
Sex |
|
|
|
|
|
|
|||||||||
|
Men |
25 367 (25 230–25 503) |
61.6% |
42.6 (42.1–43.1) |
94 859 |
62.8% |
159.3 |
|||||||||
|
Women |
15 827 (15 720–15 935) |
38.4% |
38.8 (38.2–39.4) |
56 199 |
37.2% |
137.6 |
|||||||||
|
Age group (years) |
|
|
|
|
|
|
|||||||||
|
15–24 |
2862 (2821–2902) |
6.9% |
21.8 (21.0–22.6) |
20 592 |
13.6% |
157.0 |
|||||||||
|
25–34 |
6814 (6745–6883) |
16.5% |
26.6 (26.0–27.3) |
30 931 |
20.5% |
121.0 |
|||||||||
|
35–44 |
9755 (9669–9840) |
23.7% |
41.8 (41.0–42.6) |
32 793 |
21.7% |
140.5 |
|||||||||
|
45–54 |
12 318 (12 223–12 414) |
29.9% |
55.0 (54.0–55.9) |
38 118 |
25.2% |
170.1 |
|||||||||
|
55–100 |
9445 (9363–9527) |
22.9% |
59.3 (58.1–60.5) |
28 624 |
18.9% |
179.6 |
|||||||||
|
Injury or disease group* |
|
|
|
|
|
|
|||||||||
|
Traumatic joint and muscle injuries |
16 494 (16 388–16 600) |
40.0% |
— |
68 023 |
45.0% |
— |
|||||||||
|
Musculoskeletal disorders |
8547 (8468–8627) |
20.7% |
— |
19 637 |
13.0% |
— |
|||||||||
|
Mental health conditions |
5361 (5301–5421) |
13.0% |
— |
8440 |
5.6% |
— |
|||||||||
|
Fractures |
4276 (4225–4327) |
10.4% |
— |
12 816 |
8.5% |
— |
|||||||||
|
Wounds and lacerations |
3449 (3401–3498) |
8.4% |
— |
26 366 |
17.5% |
— |
|||||||||
|
Other injuries |
1620 (1583–1656) |
3.9% |
— |
9774 |
6.5% |
— |
|||||||||
|
Other diseases |
1367 (1338–1396) |
3.3% |
— |
5609 |
3.7% |
— |
|||||||||
|
Other claims |
79 (71–86) |
0.2% |
— |
393 |
0.3% |
— |
|||||||||
|
|
|||||||||||||||
|
CI = confidence interval; FTE = full‐time equivalent years worked by workers covered by workers’ compensation. * Australian workers’ compensation bodies routinely record the primary injury or disease resulting for a compensation claim, but not other injuries or diseases. |
|||||||||||||||
Box 3 – Working years lost (WYL: granted workers’ compensation claims for time lost), Australia, 1 July 2012 – 30 June 2017, by sex and major injury type*
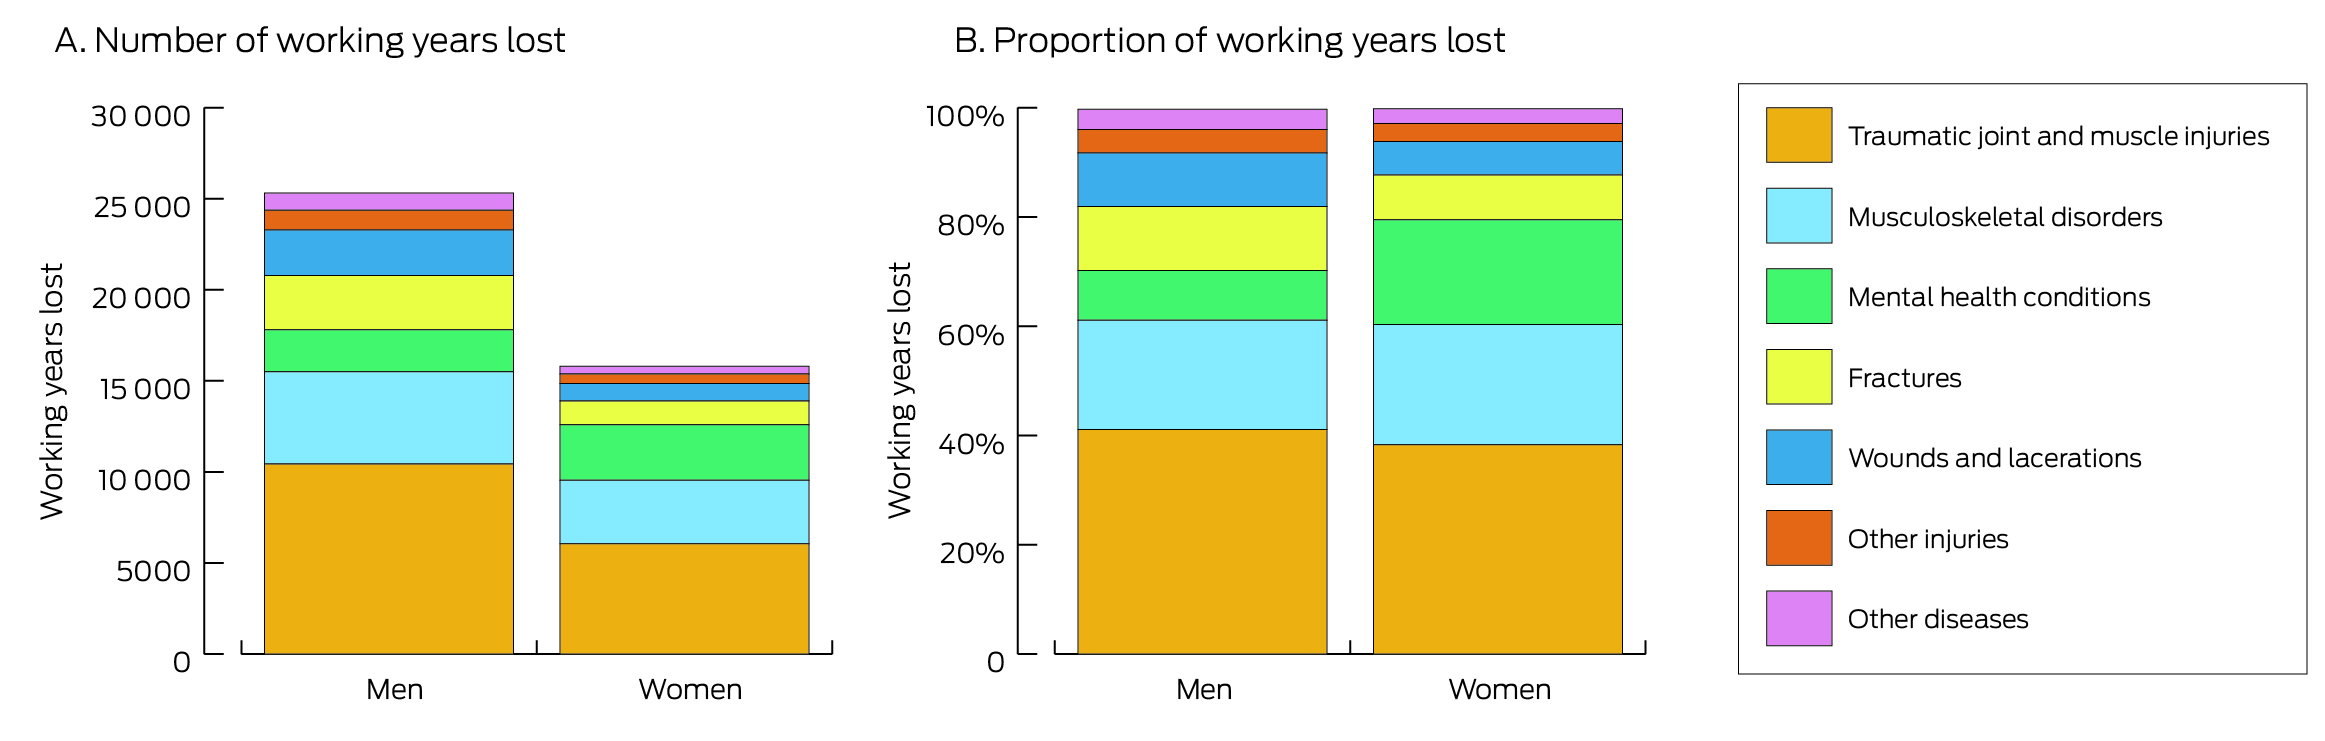
* “Other claims” category not included because of very low WYL numbers, but are included in the Supporting Information, table 4.
Received 6 June 2023, accepted 10 November 2023
- Alex Collie1
- Luke Sheehan1
- Monash University, Melbourne, VIC
Open access:
Open access publishing facilitated by Monash University, as part of the Wiley – Monash University agreement via the Council of Australian University Librarians.
Data sharing:
The study data cannot be publicly shared for ethics and privacy reasons. Access, however, may be granted upon request to Safe Work Australia.
The study was funded by an Australian Research Council (ARC) Discovery Project grant (DP190102473) and a grant from Safe Work Australia. Alex Collie holds an ARC Future Fellowship (FT190100218). Safe Work Australia provided access to data used in the study, but had no role in study design, analysis or interpretation, or publication.
Alex Collie has received grant funding (paid to his institution) from the National Health and Medical Research Council, the ARC, Safe Work Australia, WorkSafe Victoria, the State Insurance Regulatory Authority of NSW, Workcover Queensland, Comcare, and Insurance and Care NSW.
- 1. van der Noordt M, IJzelenberg H, Droomers M, Proper KI. Health effects of employment: a systematic review of prospective studies. Occup Environ Med 2014; 71: 730‐736.
- 2. Hegenrather KC, Zeglin RJ, McGuire‐Kuletz M, Rhodes SD. Employment as a social determinant of health: a systematic review of longitudinal studies exploring the relationship between employment status and physical health. Rehabil Res Policy Educ 2015; 29: https://doi.org/10.1891/2168‐6653.29.1.2.
- 3. Collie A, Sheehan L, McAllister A. Health service use of Australian unemployment and disability benefit recipients: a national, cross‐sectional study. BMC Health Serv Res 2021; 21: 249.
- 4. Murayama H, Takasi M, Watanabe S, et al. Employment in old age and all‐cause mortality: a systematic review. Geriatr Gerontol Int 2022; 22: 705‐714.
- 5. Collie A, Sheehan L, Lane TJ, Iles R. Psychological distress in workers’ compensation claimants: prevalence, predictors and mental health service use. J Occup Rehabil 2020; 30: 194‐202.
- 6. Nylén L, Voss M, Floderus B. Mortality among women and men relative to unemployment, part time work, overtime work, and extra work: a study based on data from the Swedish twin registry. Occup Environ Med 2001; 58: 52‐57.
- 7. Mason V. The prevalence of back pain in Great Britain: a report on OPCS Omnibus Survey data produced on behalf of the Department of Health. London: Her Majesty's Stationery Office, 1994.
- 8. Collie A, Gray SE. The relationship between work disability and subsequent suicide or self‐harm: a scoping review. PLoS Glob Public Health 2022; 2: e0000922.
- 9. van den Berg S, Burdorf A, Robroek SJW. Associations between common diseases and work ability and sick leave among health care workers. Int Arch Occup Environ Health 2017; 90: 685‐693.
- 10. Hakkarainen P, Moilanen L, Hänninen V, et al. Work ability among Finnish workers with type 1 diabetes. Occup Med (Lond) 2016; 66: 446‐453.
- 11. World Health Organization. WHO/ILO joint estimates of the work‐related burden of disease and injury, 2000–2016: global monitoring report. Geneva: WHO; International Labour Organization, 2021. https://iris.who.int/bitstream/handle/10665/345242/9789240034945‐eng.pdf?sequence=1 (viewed June 2023).
- 12. Safe Work Australia. The cost of work‐related injury and illness for Australian employers, workers and the community: 2012–13. Nov 2015. https://www.safeworkaustralia.gov.au/system/files/documents/1702/cost‐of‐work‐related‐injury‐and‐disease‐2012‐13.docx.pdf (viewed June 2023).
- 13. Rueda S, Chambers L, Wilson M, et al. Association of returning to work with better health in working‐aged adults: a systematic review. Am J Public Health 2012; 102: 541‐556.
- 14. Australian Institute of Health and Welfare. Australian Burden of Disease Study 2022. 13 Dec 2022. https://www.aihw.gov.au/getmedia/d9ae4bfa‐df27‐4e3c‐9846‐ba452bef6ac5/aihw‐bod‐37.pdf (viewed June 2023).
- 15. Safe Work Australia. Comparison of workers’ compensation arrangements in Australia and New Zealand 2021. 28th edition. Canberra: Safe Work Australia, 2022. https://www.safeworkaustralia.gov.au/book/comparison‐workers‐compensation‐arrangements‐australia‐and‐new‐zealand‐2021‐28th‐edition (viewed June 2023).
- 16. Collie A, Lane TJ, Hassani‐Mahmooei B, et al. Does time off work after injury vary by jurisdiction? A comparative study of eight Australian workers’ compensation systems. BMJ Open 2016; 6: e010910.
- 17. Safe Work Australia. National dataset for compensation‐based statistics, 3rd edition (revision 1). Oct 2012. https://data.safeworkaustralia.gov.au/about‐our‐datasets/workers‐compensation‐data (viewed Apr 2024).
- 18. Gray SE, Collie A. Comparing time off work after work‐related mental health conditions across Australian workers’ compensation systems: a retrospective cohort study. Psychiatr Psychol Law 2018; 25: 675‐692.
- 19. Collie A, Beck D, Gray SE, Lane TJ. Impact of legislative reform on benefit access and disability duration in workers’ compensation: an interrupted time series study. Occup Environ Med 2020; 77: 32‐39.
- 20. Australian Safety and Compensation Council. Type of occurrence classification system. Third edition, revision 1. May 2008. https://www.safeworkaustralia.gov.au/system/files/documents/1702/typeofoccurrenceclassificationsystemtoocs3rdeditionrevision1.pdf (viewed June 2023).
- 21. National Health and Medical Research Council. National statement on ethical conduct in human research 2007 (updated 2018). July 2018. https://www.nhmrc.gov.au/about‐us/publications/national‐statement‐ethical‐conduct‐human‐research‐2007‐updated‐2018 (viewed May 2024).
- 22. Australasian Faculty of Occupational and Environmental Medicine; Royal Australasian College of Physicians. Australian and New Zealand consensus statement on the health benefits of work. Realising the health benefits of work [Position statement]. Oct 2011. https://www.racp.edu.au/docs/default‐source/advocacy‐library/realising‐the‐health‐benefits‐of‐work.pdf (viewed June 2023).
- 23. Cullen KL, Irvin E, Collie A, et al. Effectiveness of workplace interventions in return‐to‐work for musculoskeletal, pain‐related and mental health conditions: an update of the evidence and messages for practitioners. J Occup Rehabil 2018; 28: 1‐15.
- 24. Australian Bureau of Statistics. Participation. In: Labour force, Australia, March 2024. 18 April 2024. https://www.abs.gov.au/statistics/labour/employment‐and‐unemployment/labour‐force‐australia/latest‐release#participation (viewed May 2024).
- 25. Safe Work Australia. Australian work health and safety (WHS) strategy, 2023–2033. 2023. https://www.safeworkaustralia.gov.au/sites/default/files/2023‐02/Australian%20WHS%20Strategy%202023‐33.pdf (viewed June 2023).
- 26. GBD 2019 Diseases and Injuries Collaborators. Global burden of 369 diseases and injuries in 204 countries and territories, 1990–2019: a systematic analysis for the global burden of disease study 2019. Lancet 2020; 396: 1204‐1222.
- 27. Safe Work Australia. Analysis of ABS work‐related injuries survey data, 2021–22. Apr 2023. https://www.safeworkaustralia.gov.au/sites/default/files/2023‐04/safe_work_australia_analysis_of_abs_work‐related_injuries_data_0.pdf (viewed June 2023).
Abstract
Objectives: To determine the national burden of working time lost to occupational injury and disease in Australia compensable by workers’ compensation schemes; to characterise the distribution of time lost by age, sex, and injury and disease type.
Study design: Retrospective population‐based study; analysis of National Dataset for Compensation‐based Statistics (NDS) data.
Setting, participants: Granted workers’ compensation claims by people aged 15–100 years including payment of wage replacement benefits for time off work lodged in Australia, 1 July 2012 – 30 June 2017.
Main outcome measures: Working years lost (WYL) per annum (total number of years of wage replacement benefits paid to injured and ill workers), overall and by sex, age, and injury and disease type; WYL per 10 000 fulltime equivalent (FTE) years worked.
Results: A total of 755 330 eligible claims with complete data for analysis variables by people aged 15–100 years were identified, for compensable injuries and disease that led to 41 194 (95% confidence interval [CI], 41 020–41 368) WYL/year. The annual WYL number and rate were each higher for men (25 367 [95% CI, 25 230–25 503] WYL/year; 42.6 [95% CI, 42.1–43.1] WYL/10 000 FTE years) than for women (15 827 [95% CI, 15 720–15 935] WYL/year; 38.8 [95% CI, 38.2–39.4] WYL/10 000 FTE years). Workers aged 45–100 years made 66 742 claims per year (44.1% of all claims) but incurred 21 763 WYL/year (52.8% of all WYL). Traumatic joint and muscle injuries led to 16 494 WYL/year (40.0% of all WYL), musculoskeletal disorders to 8547 WYL/year (20.7%), mental health conditions to 5361 WYL/year (13.0%), fractures to 4276 WYL/year (10.4%), and wounds and lacerations to 3449 WYL/year (8.4%).
Conclusions: Occupational injury and disease covered by workers’ compensation result in lost working time in Australia equivalent to more than 41 000 fulltime jobs. Distribution of the burden reflects the greater labour force participation of men, slower recovery of older workers, and the impact of common occupational injuries and diseases. Population‐based monitoring of lost working time could support effective occupational health surveillance and allocation of resources for protecting the health of Australian workers.