


The known Pancreatectomy is a complex procedure that requires multidisciplinary specialist care. It is reported internationally that pancreatectomy is underused.
The new The pancreatectomy rate is low in some NSW areas, and the difference in rates is clinically significant.
The implications Population-level survival for patients with pancreatic cancer could be improved by increasing resection rates. Improving awareness of and access to specialist centres with the resources for managing complex cases would facilitate this increase. Given the geographic and socio-demographic challenges to providing such access, a whole-of-system approach that links primary and tertiary care is needed, as well as patient information and support.
Pancreatic cancer is the fourth most common cause of cancer-related death for men and women in Australia.1 The 5-year post-diagnosis survival rate is the lowest of any cancer in New South Wales (6%) or Australia (5%).1,2 Reasons for low survival include the high rates of presentation at an advanced stage of disease and the lack of effective systemic therapies.
Survival for people presenting with loco-regional disease can be improved by surgical resection.3,4 However, there is international evidence that surgical resection is underused in patients with pancreatic cancers.3 When leading surgeons were told of variation between NSW Local Health Districts (hereafter: “regions”) in the resection rate of residents diagnosed with pancreatic cancer, the two major responses were that regions with higher resection rates may select patients inappropriately, increasing short term morbidity and mortality; and that not enough people were being offered surgery, compromising long term survival across the population. Our study assessed the relative merits of these two positions.
We firstly assessed variation between regions in the resection rate, with unexplained variation potentially reflecting systemic variation in the use of pancreatectomy. We then examined two hypotheses:
The regional pancreatic cancer resection rate does not influence short term post-operative outcomes. If higher proportions of people being resected were associated with poorer post-operative outcomes, it may indicate clinically futile surgery in some people.
The regional pancreatic cancer resection rate does not influence long term survival. If survival were higher in regions with higher proportions of people being resected, it would suggest that resection is systematically underused.
We also explored institutional pancreatectomy caseload as a factor that potentially influences resection rates, as it is a modifiable factor in the context of system performance improvement.
Methods
Our cohort study analysed de-identified, linked, population-based cancer registry and hospital data. Cancer incidence and surgery data for 2005–2013 were ascertained from linked hospital admission data in the NSW Admitted Patient Data Collection (APDC) of the Admitted Patient, Emergency Department Attendance and Deaths Register (APEDDR),5 accessed via Secure Analytics for Population Health Research and Intelligence (SAPHaRI). The APEDDR was established by the NSW Ministry of Health under the Public Health Act 2010. NSW Central Cancer Registry (CCR) data were analysed to assess the impact of resection on post-diagnosis survival, as the CCR captures the date of diagnosis. Cancer incidence data to 2009 (the latest year with complete incidence data at the time of data extraction) were obtained from the CCR; surgical information was obtained from linked APDC data. Ethics approval for the CCR–APDC data linkage was obtained from the NSW Population and Health Services Research Ethics Committee (reference, HREC/12/CIPHS/58). The Centre for Health Record Linkage performed the linkage using probabilistic, privacy-preserving protocols (estimated false positive rate, 3 per 1000 records).
Study population
The study population comprised NSW adults (aged 18 years or more) diagnosed with pancreatic cancer (International Classification of Diseases, 10th revision, Australian modification [ICD-10-AM] code C25) between 2005 and 2013, excluding neuroendocrine and other rare histological types. Residents of four of the 15 regions were excluded (12% of patients) because interstate treatment resulted in incomplete capture of resection use.
Age at diagnosis, sex, primary tumour site, histology type and region were obtained from the CCR and APDC. Charlson comorbidity scores were calculated from diagnoses recorded in the patient’s first hospital admission for pancreatic cancer.6 For people who underwent resection, Charlson score, procedure type, information about whether vascular or arterial resection was undertaken, urgency of admission, and urgency of procedure (the emergency modifier of the anaesthetic procedure code) were obtained for that admission.
Outcomes
Resection use was classified using the Australian Classification of Health Interventions block 978, “Pancreatectomy”. Post-operative mortality within 90 days and one-year survival were determined for patients who underwent pancreatectomy, with follow-up to 30 November 2013. Five-year post-diagnosis survival time was calculated for people with a case recorded in the CCR, with follow-up to 30 April 2014. Dates of death were obtained from linked NSW Registry of Births Deaths and Marriages data and from the National Death Index for CCR data. Linkage to the National Death Index was assisted by the Australian Institute of Health and Welfare (AIHW) and was approved by the AIHW Ethics Committee (reference, EO 2014/2/89).
Statistical analysis
The resection rates for Local Health Districts were the main study factor, and were defined as the percentage of residents with pancreatic cancer who underwent pancreatectomy, whether inside or outside their region of residence. Regions were grouped into categories according to resection rates (< 10%; 10–15%; > 15%) that corresponded to lower, middle and higher resection rates in other jurisdictions.7-9 The regions each managed public hospitals and provided public outpatient and health support services, but did not directly manage primary health care services. Private sector hospital data were also included.
Variations between regions in resection rate were assessed by multivariable logistic regression, adjusted for age, sex and Charlson score. The number of additional people who would be resected if the 80th percentile regional rate applied in regions with lower resection rates was calculated. A sensitivity analysis excluded people aged 80 years or more to reduce the impact of differing proportions of older people in the various regions.
Associations between resection use by region and post-operative 90-day mortality and one-year survival were investigated, adjusted for age at admission, sex, Charlson score, resection type and urgency. A multi-level, cross-classified logistic model, with region and hospital as random effects, was used because some patients underwent surgery outside their region of residence. An association between resection rate by region of residence and 5-year post-diagnosis survival rate was assessed with a Cox proportional hazards model with robust error estimation, adjusted for age at diagnosis, sex and Charlson score. Cases with death certificate-only notifications to the CCR (154 patients, 4%) were excluded from post-diagnosis survival analyses because survival times could not be defined. Risk-adjusted survival percentages (with 95% confidence intervals [CIs]) were calculated with the direct adjustment method.10
An association between resection rate and pancreatectomy volume for pancreatic and periampullary cancers of hospitals within regions was examined in a multilevel model that modelled the relationship of the odds of resection with the maximum average annual hospital volume, adjusting for patient age, sex and Charlson score.
Statistical analyses were conducted in Stata/MP 13.0 (StataCorp) and SAS/Stat 12.1 (SAS Institute).
Results
Resection rates
Demographic and clinical characteristics of people diagnosed with pancreatic cancer in NSW during 2005–2013 are summarised in Box 1. About 12% of people diagnosed during 2005–2009 underwent pancreatectomy (APEDDR, 403 of 3473 patients); the proportion increased to 14% during 2010–2013 (APEDDR, 431 of 3064 patients).
There was significant variation between regions in the odds of resection in each study period, differences that remained after adjusting for age, sex and Charlson score (P < 0.001). Five regions remained in the same resection rate category across the two periods, and six regions moved to a higher resection rate category in the second period. During 2010–2013, the proportion of patients resected ranged between 8% and 21% (Box 2). If the 80th percentile regional resection rate (18%) had applied in regions with lower resection rates, an additional 32 people would have been resected each year during 2010–2013. In the sensitivity analysis (excluding people aged 80 years or more), the predicted number of additional resections was 27.
Post-operative outcomes
Overall 90-day post-operative mortality during the 2005–2009 period was 6.5% (26 of 403 patients), compared with 4.8% (19 of 392 patients) for 2010–2013. Higher resection rates were not associated with increased 90-day mortality. For 2010–2013, the adjusted odds ratios (aORs) for regions with resection rates of 10–15% or > 15% (v regions with resection rates < 10%) were greater than one, but these results were not statistically significant (Box 3).
Compared with regions with resection rates below 10%, one-year post-operative survival during 2010–2013 was higher in regions with 10–15% resection rates (aOR, 2.8; 95% CI, 1.2–6.4) and was similar for regions with resection rates greater than 15% (aOR, 1.7; 95% CI, 0.8–3.6). Overall one-year post-operative survival was 67.5% during 2005–2009 and 66.6% during 2010–2013 (Box 3).
Vascular resection was not included in the risk adjustment models because of recording differences between hospitals, but was noted more frequently in pancreatectomy records from 2010–2013 (14.5%) than in those from 2005–2009 (8.2%).
Post-diagnosis survival
The 5-year survival rate after diagnosis was 5.1% (95% CI, 4.4–5.9) for people diagnosed during 2005–2009 (CCR data). After adjusting for differences in age, sex and Charlson score, survival was significantly higher (P < 0.001) in regions with higher pancreatectomy rates (Box 4). Compared with regions with resection rates below 10%, the risk-adjusted hazard ratio for regions with a resection rate of 10–15% was 0.9 (95% CI, 0.8–0.9) and for regions with rates greater than 15% it was 0.7 (95% CI, 0.7–0.8). Risk-adjusted survival by region ranged between 2.9% (95% CI, 1.9–4.5%) and 7.9% (95% CI, 6.3–9.9%; Box 5). Assessing resection rate as a continuous variable, a 10-percentage point increase in the proportion of residents resected corresponded to an estimated 16% reduction in the 5-year mortality rate (data not shown).
Institutional resection volume
There was a positive association between the odds of resection and the maximum average annual hospital volume of pancreatectomy for cancer by region (Box 6); the association for the period 2005–2009 was statistically significant (aOR, 1.06; 95% CI, 1.03–1.09; P < 0.001) but not for 2010–2013 (aOR, 1.02; 95% CI, 0.99–1.06; P = 0.16). During 2010–2013, six of the 11 regions had a higher volume hospital (more than ten resections per year) within their boundaries; a total of 39 NSW hospitals performed pancreatectomy for cancer. On average, the residents with pancreatic cancer in any region attended a total of ten different hospitals for pancreatectomy during 2010–2013; 25–90% of patients (depending on the region) were resected in a hospital in their region of residence. Fewer people underwent surgery in lower volume hospitals (fewer than six resections per year) during 2010–2013 (89 of 431, 21%) than during 2005–2009 (166 of 403 resections, 41%).
Discussion
We identified regional differences in pancreatectomy rates that were not explained by differences in age, sex or comorbidity status. Fourteen per cent of people with pancreatic cancer underwent pancreatectomy during 2010–2013, with regional rates ranging between 8% and 21%. Post-operative outcomes in NSW compared favourably with outcomes reported internationally,3,11 although our NSW population figure for one-year post-operative survival (67%) was lower than that reported from an Australian case–control study (77%).12
We did not find an association between higher resection rates and poorer post-operative outcomes up to one year after surgery. Although the analyses of 90-day mortality may have been underpowered for detecting clinically relevant differences, one-year survival during 2010–2013 was greater in regions with higher resection rates. Coupled with our finding that risk-adjusted 5-year post-diagnosis survival was twice as high in regions with resection rates greater than 15% than in those where it was less than 10% (Box 4), these results suggest that more resections could be performed in NSW without harming post-operative outcomes, and that this may increase long term survival at the population level. We estimated that an additional 32 people per year would be resected if rates in lower rate regions were increased to the 80th percentile level (18%), an increase of 30% above the current annual average for our NSW study area (108 resections for pancreatic cancer).
The resection rate we found is similar to published international and national figures of about 15%.13,14 Apparent underuse of pancreatectomy for pancreatic cancer at the population level, by geographic region, or across socio-demographic groups has been described in the United States, the United Kingdom, and elsewhere.3,7-9,15,16 System-related factors at the primary and tertiary care levels and patient-related factors may all affect the accessibility and uptake of pancreatic surgery.
At the individual level, disparity in outcomes have been reported for patients with pancreatic and other cancers that was related to geographic remoteness and socio-demographic factors.15-17 Even when reviewed at a specialist service, the uptake of treatment by people at greater social disadvantage can be lower.15,18,19 One-fifth of people with resectable pancreatic cancer in NSW and Queensland were reported to have declined surgery.14 We chose not to adjust our analyses for remoteness, socio-economic status or country of birth because associated risk factors, such as acceptability of services and health literacy, may be modifiable. Factors that reduce access to treatment need to be identified so that practicable advice can be delivered to health care providers and policy makers.
At the primary care level, referral pathways may affect the number of people receiving staging and surgical evaluation in multidisciplinary settings. Few studies have examined the impact of primary care referral on treating pancreatic and other cancers. A US study reported that people with loco-regional pancreatic cancer who had a regular primary care doctor were 37% more likely to receive surgical evaluation, reflecting the positive influence of primary care.15 A strong operational link between primary care and multidisciplinary care is needed to optimise cancer treatment outcomes,20 especially for cancers that will rarely be encountered by primary care physicians in a lifetime of work.
At the hospital level, careful patient selection that balances the potential benefits and risks at the individual level will depend on the available services and expertise in pancreatico-biliary and vascular surgery, interventional radiology, anaesthesia, rehabilitation, and the management of comorbidities. Pre-operative staging with specialist imaging and multidisciplinary review, including pancreatico-biliary surgeons, is important for identifying and planning resections of tumours with vascular or adjacent organ involvement, and can reduce the number of incomplete resections by identifying unresectable disease early.20,21 A recent study in Queensland and NSW reported that 24% of attempted resections were not completed,14 while another reported a higher completion rate in Queensland hospitals with higher pancreatectomy volumes.12 We found a positive association between regional resection rate and hospital volume of pancreatectomy for cancer.
An extensive literature has reported higher mortality in lower volume hospitals performing complex pancreatic surgery;22 a recent Australian study found an association between lower volume surgeons and poorer outcomes.23 In addition to mortality, other crucial quality measures include access to multidisciplinary services, complication rates, and time from operation to adjuvant therapy.24,25 Standardised data collection, analysis and national reporting would help elucidate the reasons for variations in practice.
The clinical details available to us in this study were limited. Information on clinical staging, adjuvant therapy, multidisciplinary team referral, patient contraindications for surgery, access of patients to health services and their treatment preferences are needed to assess their impact on resection use and long term survival. The strengths of our study were that it was population-based and spanned 9 years of care to 2013. Our findings therefore reflect current surgical rates and outcomes for people diagnosed with pancreatic cancer in NSW.
Our results indicate that in some areas of NSW patients who may potentially benefit from pancreatectomy are not receiving it. The finding that overall survival from pancreatic cancer was higher in regions with higher resection rates is important, as optimising the use of resection has the potential to improve survival at the individual and population levels.7 Increasing knowledge and awareness of hospitals with the expertise and resources for managing complex cases should enable more people to undergo surgery. In NSW, regions face different and unequal challenges in providing equity of access to multidisciplinary care. Although there is a compelling case for reducing the number of sites performing pancreatic cancer surgery in NSW, as has been described for other cancer surgery types,26 there are geographic and socio-demographic barriers to doing so. There also needs to be a whole-of-system approach, linking primary and tertiary care, as well as patient information and support, to optimise outcomes for patients.
Box 1 – Demographic and tumour characteristics of people with an incident case of pancreatic cancer, New South Wales, 2005–2013, recorded in the NSW Central Cancer Registry (CCR) or the Admitted Patient, Emergency Department Attendance and Deaths Register (APEDDR)
CCR2005–2009 |
APEDDR2005–2009 |
APEDDR2010–2013 |
|||||||||||||
Total number |
3552 |
3473 |
3064 |
||||||||||||
Sex |
|||||||||||||||
Men |
1798 (50.6%) |
1771 (51.0%) |
1577 (51.5%) |
||||||||||||
Women |
1754 (49.4%) |
1702 (49.0%) |
1487 (48.5%) |
||||||||||||
Age at diagnosis/first admission |
|||||||||||||||
<60 years |
552 (15.5%) |
558 (16.1%) |
494 (16.1%) |
||||||||||||
60–69 years |
754 (21.2%) |
758 (21.8%) |
741 (24.2%) |
||||||||||||
70–79 years |
1102 (31.0%) |
1088 (31.3%) |
869 (28.4%) |
||||||||||||
≥80 years |
1144 (32.2%) |
1069 (30.8%) |
960 (31.3%) |
||||||||||||
Charlson comorbidity score (index admission) |
|||||||||||||||
0 |
2798 (78.8%) |
2869 (82.6%) |
2687 (87.7%) |
||||||||||||
1 |
235 (6.6%) |
238 (6.9%) |
135 (4.4%) |
||||||||||||
≥2 |
346 (9.7%) |
366 (10.5%) |
242 (7.9%) |
||||||||||||
No admission |
173 (4.9%) |
— |
— |
||||||||||||
Primary site of tumour |
|||||||||||||||
Pancreas head (ICD-10-AM, C25.0) |
1508 (42.5%) |
1622 (46.7%) |
1486 (48.5%) |
||||||||||||
Body and tail (ICD-10-AM, C25.1-2) |
450 (12.7%) |
481 (13.8%) |
484 (15.8%) |
||||||||||||
Other pancreas (ICD-10-AM, C25.3–8) |
188 (5.3%) |
162 (4.7%) |
155 (5.1%) |
||||||||||||
Pancreas, not otherwise specified (ICD-10-AM, C25.9) |
1406 (39.6%) |
1208 (34.8%) |
939 (30.6%) |
||||||||||||
Histology |
|||||||||||||||
Adenocarcinoma |
1963 (55.3%) |
1592 (45.8%) |
1621 (52.9%) |
||||||||||||
Unspecified |
1589 (44.7%) |
1525 (43.9%) |
1065 (34.8%) |
||||||||||||
Unknown |
— |
356 (10.3%) |
378 (12.3%) |
||||||||||||
Extent |
|||||||||||||||
Local |
552 (15.5%) |
— |
— |
||||||||||||
Regional |
562 (15.8%) |
— |
— |
||||||||||||
Distant |
1651 (46.5%) |
— |
— |
||||||||||||
Unknown |
787 (22.2%) |
— |
— |
||||||||||||
Resection |
|||||||||||||||
Yes |
435 (12.2%) |
403 (11.6%) |
431 (14.1%) |
||||||||||||
No |
3117 (87.8%) |
3070 (88.4%) |
2633 (85.9%) |
||||||||||||
Region of residence resection rate |
|||||||||||||||
<10% |
671 (18.9%) |
1147 (33.0%) |
748 (24.4%) |
||||||||||||
10–15% |
1960 (55.2%) |
1800 (51.8%) |
887 (28.9%) |
||||||||||||
>15% |
921 (25.9%) |
526 (15.1%) |
1429 (46.6%) |
||||||||||||
ICD-10-AM=International Classification of Diseases, 10th revision, Australian modification. | |||||||||||||||
Box 2 – Proportion of residents in New South Wales administrative health regions (Local Health Districts) diagnosed with pancreatic cancer who underwent resection, 2005–2009 and 2010–2013 (APEDDR data)*
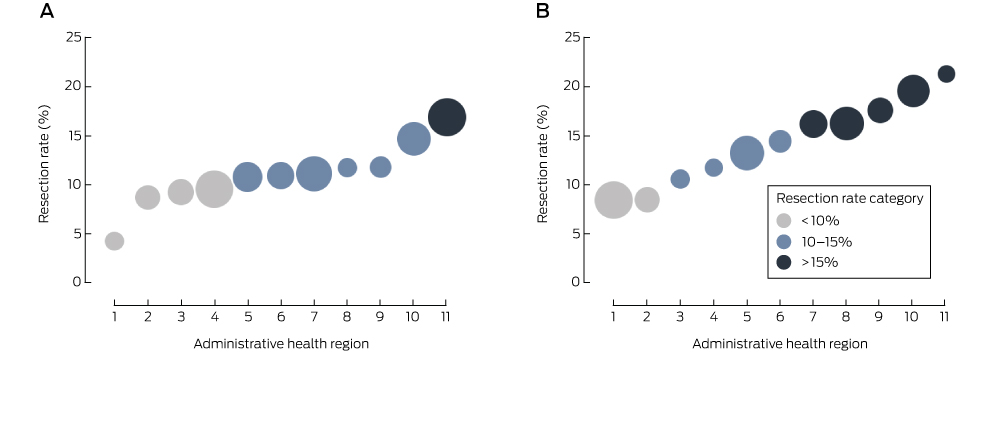
APEDDR=Admitted Patient, Emergency Department Attendance and Deaths Register. *Regions are ordered by resection rate; the size of the symbols is proportional to the number of cases of pancreatic cancer in a region.
Box 3 – Post-operative pancreatectomy outcomes by regional resection rate, New South Wales, 2005–2013 (APEDDR data)
|
2005–2009 |
2010–2013* |
||||||||||||||
|
90-day mortality |
One-year survival |
90-day mortality |
One-year survival |
||||||||||||
% (n/N) |
aOR† (95% CI) |
P‡ |
% (n/N) |
aOR† (95% CI) |
P‡ |
% (n/N) |
aOR† (95% CI) |
P‡ |
% (n/N) |
aOR† (95% CI) |
P‡ |
||||
Resection rate |
0.67 |
0.96 |
0.39 |
0.06 |
|||||||||||
<10% |
8% (8/99) |
1 |
66% (65/99) |
1 |
2% (1/53) |
1 |
54% (21/39) |
1 |
|||||||
10–15% |
6.5% (14/215) |
0.9 (0.3–2.4) |
68.4% (147/215) |
1.1 (0.6–1.9) |
3% (3/105) |
2.7 (0.2–33) |
78% (62/80) |
2.8 (1.2–6.4) |
|||||||
>15% |
4% (4/89) |
0.6 (0.2–2.0) |
67% (60/89) |
1.1 (0.5–2.2) |
6.4% (15/234) |
4.3 (0.5–40) |
64.6% (122/189) |
1.7 (0.8–3.6) |
|||||||
Total |
6.5% (26/403) |
67.5% (272/403) |
4.8% (19/392) |
66.6% (205/308) |
|||||||||||
aOR=adjusted odds ratio; APEDDR=Admitted Patient, Emergency Department Attendance and Deaths Register; n=number of deaths within 90 days (mortality) or people alive at one year (survival); N=total number of pancreatectomies in resection rate category. *Resections to 1 September 2013 for 90-day mortality and to 30 November 2012 for one-year survival, to ensure complete follow-up. †Adjusted for sex, age group at admission, comorbidity status, type of surgery and urgency of admission for the 2005–2009 period, and urgency of procedure for the 2010–2013 period (the completeness of urgency of procedure data was insufficient for it to be included in models for the 2005–2009 period). ‡Wald test for categorical variables. | |||||||||||||||
Box 4 – Relationship between 5-year post-diagnosis survival and regional resection rate, New South Wales, 2005–2009 (CCR data)
Number of patients |
Unadjusted 5-year survival (95% CI) |
Adjusted 5-year survival* (95% CI) |
Adjusted hazard ratio* (95% CI) |
P† |
|||||||||||
Resection rate |
<0.001 |
||||||||||||||
<10% |
631 |
1.9% (1.1–3.4) |
3.4% (2.6–4.4) |
1 |
|||||||||||
10–15% |
1888 |
5.7% (4.7–6.8) |
5.2% (4.4–6.1) |
0.9 (0.8–0.9) |
|||||||||||
>15% |
879 |
6.2% (4.8–8.0) |
7.2% (6.0–8.7) |
0.7 (0.7–0.8) |
|||||||||||
Total |
3398 |
5.1% (4.4–5.9) |
|||||||||||||
CCR=NSW Central Cancer Registry. *Adjusted for sex, age group at diagnosis and comorbidity status. †Wald test for categorical variables. | |||||||||||||||
Box 5 – Risk-adjusted 5-year post-diagnosis survival from pancreatic cancer and regional resection rate, New South Wales, 2005–2009 (CCR data, resected and unresected patients)
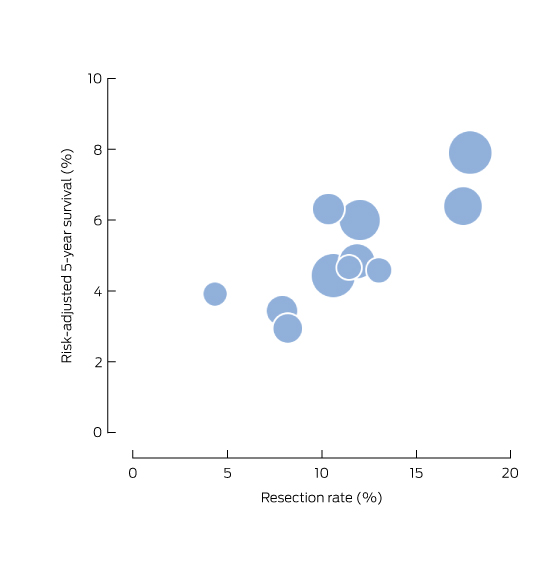
CCR=NSW Central Cancer Registry. The size of the symbols is proportional to the number of cases of pancreatic cancer in a region.
Box 6 – Regional resection rate and maximum hospital volume of pancreatectomy for pancreatic and periampullary cancer, New South Wales, 2005–2009 (A) and 2010–2013 (B) (APEDDR data)
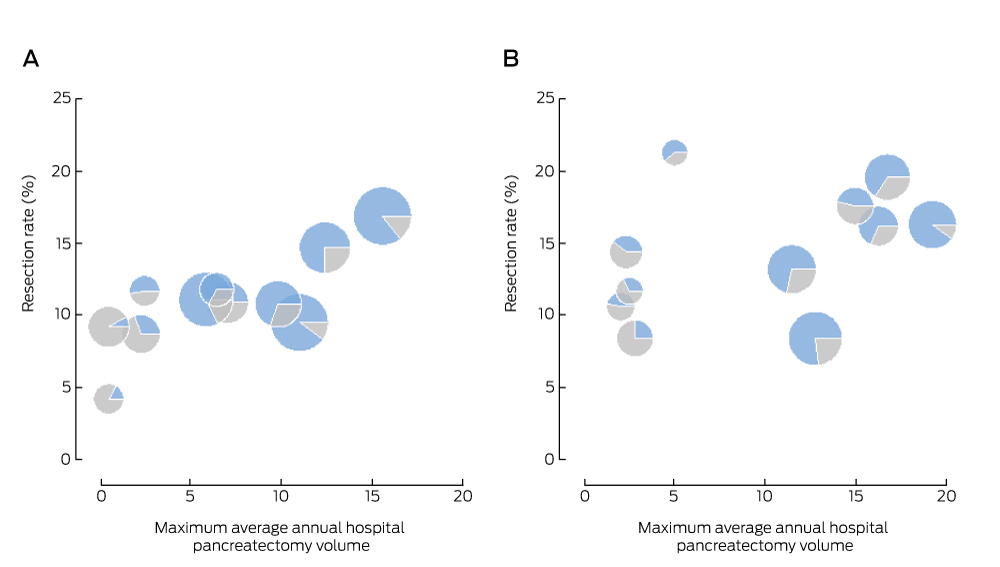
APEDDR = Admitted Patient, Emergency Department Attendance and Deaths Register. The size of the symbols is proportional to the number of cases of pancreatic cancer in a region; the blue area represents the proportion of administrative health region residents with pancreatic cancer resected within their region of residence.
Received 9 February 2016, accepted 20 June 2016
- Nicola Creighton1
- Richard Walton1
- David M Roder2
- Sanchia Aranda3
- Arthur J Richardson4,5
- Neil Merrett6
- David Currow1
- 1 Cancer Institute New South Wales, Sydney, NSW
- 2 Centre for Population Health Research, University of South Australia, Adelaide, SA
- 3 Cancer Council Australia, Sydney, NSW
- 4 Westmead Hospital, Sydney, NSW
- 5 Sydney Medical School, Sydney, NSW
- 6 University of Western Sydney, Penrith, NSW
We thank Douglas Fenton-Lee, Ross Smith and Michael Cox for reviewing the manuscript and providing constructive suggestions for improving it. We acknowledge the NSW Ministry of Health for granting access to the population health data, and the Centre for Health Record Linkage for linking the datasets. The Admitted Patient, Emergency Department Attendance and Deaths Register was accessed via Secure Analytics for Population Health Research and Intelligence.
No relevant disclosures.
- 1. Australian Institute of Health and Welfare. Cancer in Australia: an overview 2014. Canberra: AIHW, 2014. http://www.aihw.gov.au/publication-detail/?id=60129550047 (accessed July 2016).
- 2. Cancer Institute NSW. Cancer survival in New South Wales 2002–06. Sydney: Cancer Institute NSW, 2012. https://www.cancerinstitute.org.au/getattachment/1168be14-b79a-408d-9d41-35b99fd4959f/cancer-survival-in-nsw-2002-06.pdf (accessed July 2016).
- 3. Bilimoria KY, Bentrem DJ, Ko CY, et al. National failure to operate on early stage pancreatic cancer. Ann Surg 2007; 246: 173-180.
- 4. McDowell BD, Chapman CG, Smith BJ, et al. Pancreatectomy predicts improved survival for pancreatic adenocarcinoma: results of an instrumental variable analysis. Ann Surg 2015; 264: 740-745.
- 5. Creighton N, Walton R, Roder D, et al. Validation of administrative hospital data for identifying incident pancreatic and periampullary cancer cases: a population-based study using linked cancer registry and administrative hospital data in New South Wales, Australia. BMJ Open 2016; 6: e011161.
- 6. Dobbins TA, Creighton N, Currow DC, et al. Look back for the Charlson index did not improve risk adjustment of cancer surgical outcomes. J Clin Epidemiol 2015; 68: 379-386.
- 7. Coupland VH, Konfortion J, Jack RH, et al. Resection rate, hospital procedure volume and survival in pancreatic cancer patients in England: population-based study, 2005–2009. Eur J Surg Oncol 2016; 42: 190-196.
- 8. Sharp L, Carsin AE, Cronin-Fenton DP, et al. Is there under-treatment of pancreatic cancer? Evidence from a population-based study in Ireland. Eur J Cancer 2009; 45: 1450-1459.
- 9. Gooiker GA, Lemmens VE, Besselink MG, et al. Impact of centralization of pancreatic cancer surgery on resection rates and survival. Br J Surg 2014; 101: 1000-1005.
- 10. Zhang X, Loberiza FR, Klein JP, Zhang MJ. A SAS macro for estimation of direct adjusted survival curves based on a stratified Cox regression model. Comput Methods Programs Biomed 2007; 88:95-101.
- 11. Swanson RS, Pezzi CM, Mallin K, et al. The 90-day mortality after pancreatectomy for cancer is double the 30-day mortality: more than 20,000 resections from the national cancer data base. Ann Surg Oncol 2014; 21: 4059-4067.
- 12. Wylie N, Adib R, Barbour AP, et al. Surgical management in patients with pancreatic cancer: a Queensland perspective. ANZ J Surg 2013; 83: 859-864.
- 13. Cress R, Yin D, Clarke L, et al. Survival among patients with adenocarcinoma of the pancreas: a population-based study (United States). Cancer Causes Control 2006; 17: 403-409.
- 14. Burmeister EA, O’Connell DL, Beesley VL, et al. Describing patterns of care in pancreatic cancer: a population-based study. Pancreas 2015; 44: 1259-1265.
- 15. Riall TS, Townsend CM, Kuo YF, et al. Dissecting racial disparities in the treatment of patients with locoregional pancreatic cancer: a 2-step process. Cancer 2010; 116: 930-939.
- 16. Cheung MC, Yang R, Byrne MM, et al. Are patients of low socioeconomic status receiving suboptimal management for pancreatic adenocarcinoma? Cancer 2010; 116: 723-733.
- 17. Chen TYT, Morrell S, Thomson W, et al. Survival from breast, colon, lung, ovarian and rectal cancer by geographical remoteness in New South Wales, Australia, 2000–2008. Aust J Rural Health 2015; 23: 49-56.
- 18. Vinod SK, Sidhom MA, Gabriel GS, et al. Why do some lung cancer patients receive no anticancer treatment? J Thorac Oncol 2010; 5: 1025-1032.
- 19. Sandroussi C, Brace C, Kennedy ED, et al. Sociodemographics and comorbidities influence decisions to undergo pancreatic resection for neoplastic lesions. J Gastrointest Surg 2010; 14: 1401-1408.
- 20. Pancreatic Section of the British Society of Gastroenterology, Pancreatic Society of Great Britain and Ireland, Association of Upper Gastrointestinal Surgeons of Great Britain and Ireland, et al. Guidelines for the management of patients with pancreatic cancer, periampullary and ampullary carcinomas. Gut 2005; 54 Suppl 5: v1-v16.
- 21. Samra JS, Bachmann RA, Choi J, et al. One hundred and seventy-eight consecutive pancreatoduodenectomies without mortality: role of the multidisciplinary approach. Hepatob Pancreat Dis 2011; 10: 415-421.
- 22. Gooiker GA, van Gijn W, Wouters MWJM, et al. Systematic review and meta-analysis of the volume–outcome relationship in pancreatic surgery. Br J Surg 2011; 98: 485-494.
- 23. Waterhouse MA, Burmeister EA, O’Connell DL, et al. Determinants of outcomes following resection for pancreatic cancer — a population-based study. J Gastrointest Surg 2016: 20: 1-11.
- 24. Kalish B, Vollmer C, Kent T, et al. Quality assessment in pancreatic surgery: what might tomorrow require? J Gastrointest Surg 2013; 17: 86-93.
- 25. Bilimoria KY, Bentrem DJ, Lillemoe KD, et al. Assessment of pancreatic cancer care in the United States based on formally developed quality indicators. J Natl Cancer Inst 2009; 101: 848-859.
- 26. Smith RC, Creighton N, Lord RV, et al. Survival, mortality and morbidity outcomes after oesophagogastric cancer surgery in New South Wales, 2001–2008. Med J Aust 2014; 200: 408-413. <MJA full text>
Abstract
Objective: To examine differences in the proportions of people diagnosed with pancreatic cancer who underwent pancreatectomy, post-operative outcomes and 5-year survival in different New South Wales administrative health regions of residence.
Design, setting and participants: Retrospective analysis of NSW data on pancreatic cancer incidence and surgery, 2005–2013.
Main outcome measures: The proportion of newly diagnosed patients with pancreatic cancer who were resected in each region; 90-day post-operative mortality; one-year post-operative survival; 5-year post-diagnosis survival.
Results: 14% of people diagnosed with pancreatic cancer during 2010–2013 (431 of 3064) underwent pancreatectomy, an average of 108 resections per year. After adjusting for age, sex and comorbidities, the proportion that underwent resection varied significantly between regions, ranging between 8% and 21% (P<0.001). Higher resection rates were not associated with higher post-operative 90-day mortality or lower one-year survival (unadjusted and risk-adjusted analyses). Higher resection rates were associated with higher 5-year post-diagnosis survival: the mean survival in regions with resection rates below 10% was 3.4%, compared with 7.2% in regions with rates greater than 15% (unadjusted and adjusted survival analyses; P<0.001). There was a positive association between regional resection rate and the pancreatectomy volume of hospitals during 2005–2009. An additional 32 people would be resected annually if resection rates in low rate regions were increased to the 80th percentile regional resection rate (18%).
Conclusion: There is significant geographic variation in the proportion of people with pancreatic cancer undergoing pancreatectomy, and the 5-year survival rate is higher in regions where this proportion is higher.