


The known: Pay‐for‐performance financial stimuli are widely used to improve quality of care, but little is known about their impact on value for health care expenditure. A pay‐for‐performance incentive program for increasing stroke unit access in Queensland public hospitals was associated with markedly improved access and lower 6‐month mortality.
The new: The pay‐for‐performance program was not associated with increased hospital costs, hospital length of stay, or re‐admission rates for people admitted with stroke.
The implications: By stimulating improved quality of care without increasing costs or hospital demand, the Queensland pay‐for‐performance program increased value for health care spending.
The aim of pay‐for‐performance (P4P) systems is to financially reward health care providers for delivering care that meets pre‐defined targets for quality or outcome indicators.1,2 P4P health care funding has been used overseas in the expectation that providing incentives to adhere to evidence‐based practice and discouraging low value care will economically improve clinical outcomes.3 In Australia, P4P has been introduced in primary care (the Practice Incentive Program4), and also as a form of penalty‐based P4P in public hospitals, in that hospital episodes that include “sentinel events” (serious, wholly preventable adverse events) are not funded.5 The private health insurer Medibank has similarly listed 165 hospital‐acquired complications for which it does not reimburse treatment costs for private hospital patients.6 Despite widespread use, information on the overall impact of hospital P4P programs on the value of health care is limited.7,8
For people admitted to hospital with stroke, the risk of death or disability by one‐year follow‐up is 24% lower for patients treated in dedicated stroke units than for those treated in other hospital service types.9 In 2012, persistently low access to stroke units in public hospitals prompted Queensland Health to introduce a P4P program (Quality Improvement Payments; QIP) to improve access. The incentives led to marked improvement in access to stroke unit care, 26 percentage points greater than predicted by the historical trend (2009–11) (Supporting Information, figure 1), and in survival; 6‐month post‐stroke mortality had been increasing prior to the program, but absolute mortality was 12.5% (95% confidence interval, 1.9–23.1%) lower during the first 5.5 years of the incentive program than predicted by the historical trend.10
However, stroke unit care is more expensive than general medical ward care,11,12,13,14 and its impact on overall hospital length of stay varies markedly between hospital systems.9 We aimed to examine the effect of the Queensland stroke unit access QIP program on hospital costs, length of stay, and re‐admission rates.
Methods
We undertook a population‐based longitudinal study, analysing linked patient‐level hospital admissions, emergency department, and hospital costs datasets. We assessed the impact of P4P incentives on the levels of and changes in outcomes by comparing them with historical data for stroke and a control condition not affected by the incentives scheme (myocardial infarction) in interrupted time series analyses.
The Quality Improvement Payments stroke unit incentive program
We have described the QIP stroke unit incentive program elsewhere.10 In brief, payments were made to hospitals (not clinicians) based on progressively increasing targets for the proportion of people with stroke admitted to acute stroke units. The total budget for the incentive scheme was $5 000 000 for the first year (2012–13), and $4 000 000 for each of the subsequent two years, paid to qualifying health services as twice yearly payments (Box 1; Supporting Information, part 1). The mean annual payment per hospital during 2012–15 was $218 000. Since July 2015, the payments have been replaced by a 10% loading on Diagnosis Related Group‐based payments for the care of patients with primary diagnoses of stroke admitted to stroke units, embedded in the Queensland public hospital services purchasing and funding model. The QIP focus was providing quality care by admitting patients to stroke units; hospital length of stay, costs, and re‐admissions were not criteria for payment. However, length of stay information was reported to hospitals and clinicians twice a year in state‐wide clinical quality improvement forums.
Study population
We defined three periods for the study:
- the pre‐incentive (historical control) period: 1 July 2009 – 31 December 2011;
- the 12‐month implementation period: 1 January 2012 – 31 December 2012 (ie, the six months preceding the program and the first six months of the program); and
- the P4P period: 1 January 2013 – 30 June 2017. As the outcomes were similar for the initial target‐based payment phase and the subsequent maintenance payment phase, the P4P intervention period was treated as a single period.
We included data for all adult Queensland residents (18 years or older) discharged from acute episodes of care in Queensland public hospitals lasting more than one day with primary discharge diagnoses of either acute stroke or acute myocardial infarction according to primary discharge diagnosis coding (Supporting Information, table 1). We did not include data for people who were not Queensland residents, were admitted to private hospitals only, or had intracerebral haemorrhage and were managed solely in neurosurgical units, in alignment with QIP program criteria. Only the first admission of each person with either condition during the study period was included in our analysis.
Myocardial infarction was selected as the control condition for assessing the impact of the QIP program on acute hospital length of stay and re‐admissions. As people do not typically undergo inpatient rehabilitation after myocardial infarction (3% of included cases in this study), it was not used as a control condition in analyses of rehabilitation length of stay or costs.
Data sources
The Queensland Department of Health Research Linkage Group linked data from the emergency department and admitted patient datasets and the Queensland Department of Health National Hospital Cost Data Collection, and provided it to the research team in de‐identified format. The National Hospital Cost Data Collection uses standardised methods for attributing costs to hospitals at the patient and episode levels, including for staffing, infrastructure, investigations, and intervention costs.16 Admissions and transfers within and between facilities within 24 hours of prior discharge — ie, inter‐hospital transfers, acute, subacute (rehabilitation and palliative care), and non‐acute (awaiting residential care) episodes in multiple hospitals within Queensland — were considered part of the same hospital event.
Outcomes
Acute hospital length of stay was defined according to standard reporting procedures, excluding care episodes classified as an alternative care type (eg, rehabilitation, palliative care, non‐acute care) by the Australian National Subacute and Non‐acute Patient Classification.17 When patients were transferred during the initial linked hospital event, total length of stay for each classification was calculated from the lengths of stay in each facility. Rehabilitation was defined as any admission during the index event classified as rehabilitation or geriatric evaluation and management.
Total hospital length of stay for a series of linked admissions was defined as the time from the initial hospital admission to final discharge, including all acute, rehabilitation, other subacute (eg, palliative care), and non‐acute (waiting for transfer to residential care) components of hospital admission.
Emergency department re‐presentation was defined as an emergency department presentation more than 24 hours but less than 30 days after final discharge from the index hospital event. Non‐elective hospital re‐admission was defined as one more than 24 hours but less than 30 days from final discharge after the index hospital event and within 24 hours of an emergency department presentation. That is, the linked emergency department presentation was deemed to denote non‐elective admissions, as administrative dataset classification coding of elective and non‐elective hospital admissions was unreliable.
We assessed costs for hospital admissions from the perspective of the health service provider. Financial incentives were not included as costs, as they were borne by the health funder. Total hospital costs were derived from the Queensland Department of Health National Hospital Cost Data Collection, calculated by standard national procedures and classified by care type (acute, rehabilitation, total) for all involved facilities during the initial hospital event. The costs for patients who died were included for all episodes of care until their death. Costs are reported in Australian dollars, adjusted to the 2017 level using the total health price index for Australia.18
Statistical analysis
Statistical analyses were performed in Stata/MP 17. We used interrupted time series analysis19 to compare changes in outcomes for people admitted to hospital with stroke or myocardial infarction, before and after the introduction of the QIP program. For binary outcomes, we assessed the proportion of people who reached the outcome each month; for continuous outcomes, we used the median value (with interquartile range, IQR), as the distributions of length of stay and costing data were highly skewed. Data were evaluated for autocorrelation with the Cumby–Huizinga20,21 and Durbin–Watson tests.22 Time series regression models were fitted to monthly data for group (stroke, myocardial infarction) and study period using generalised least squares estimation and Prais–Winsten transformation (lag: one month), which yielded the best correction for autocorrelation.21 We compared change in level (absolute values) and slope (change over time) for the control and P4P periods within and between the stroke and myocardial infarction groups, using Linden's post‐estimation methods.21,23 To estimate the immediate impact of the introduction of the QIP on outcomes, the modelled level at the beginning of the P4P period (January 2013) was compared with a counterfactual control estimate extrapolated from historical control data (July 2009 – December 2011). Analyses were not adjusted for covariates, as the data were derived from a complete, unselected population, and our interest was in the impact of the intervention at the health system level. Data for patients with incomplete or missing costs data were excluded from the corresponding analyses.
Ethics approval
The Prince Charles Hospital Human Research Ethics Committee (EC00168) approved the study; the analysis of public health data was approved under the provisions of the Public Health Act 2005 (Qld).
Results
The inclusion criteria for our hospital length of stay analysis were satisfied by 23 572 people admitted to hospital with stroke and 39 511 admitted with myocardial infarction (Box 2). Costs data for the initial acute event were incomplete for 215 people with stroke (0.8%) and 309 people with myocardial infarction (0.8%); rehabilitation episode costs were incomplete for 593 people with stroke (6.3% of 9460 people who received rehabilitation care). As previously reported,10 the mean age and proportion of women did not vary markedly across the study period for patients with either condition (Supporting Information, figures 2 and 3). The mean age of people admitted with stroke was 72 years (standard deviation [SD], 14 years) in all three study periods; the mean age of those admitted with myocardial infarction was 67 years (SD, 14 or 15 years by period). The proportion of women was 44–47% for stroke, 35% for myocardial infarction (Box 3).
Hospital length of stay
At the start of the historical control period, the median acute hospital length of stay was 1.2 (95% CI, 0.7–1.7) days longer for people admitted with stroke (6.5 [IQR, 6.0–7.0] days) than for people with myocardial infarction (5.3 [IQR, 5.1–5.5] days); the estimated rate of change during this period was more rapid for stroke than myocardial infarction cases (difference, –0.02 [95% CI, –0.04 to –0.01] days per month). The median acute length of stay did not change significantly during the implementation year for either patient group. The rate of decline in acute length of stay was significantly lower during the P4P period than the control period for both groups (stroke: by 0.03 [95% CI, 0.001–0.05] days per month; myocardial infarction: by 0.02 days [95% CI, 0.01–0.02] per month) (Box 4; Supporting Information, table 2).
The median rehabilitation length of stay for people who received such care after stroke declined from 29.9 (IQR, 27.7–32.2) days in July 2009 to 21.9 (IQR, 20.6–23.2) days in July 2017; the rates of decline during the control and P4P periods were not significantly different (Box 4; Supporting Information, table 2).
The median total length of stay was 4.5 (95% CI, 3.1–5.8) days longer for people admitted with stroke (10.0 [IQR, 8.6–11.3] days) than for people with myocardial infarction (5.5 [IQR, 5.3–5.7] days) at the start of the control period; by the end of the P4P period, the difference was 3.2 (95% CI, 2.5–3.9) days (7.8 [IQR, 7.1–8.5] v 4.6 [IQR, 4.5–4.8] days) (Box 4; Supporting Information, table 2).
Hospital costs
The change in median total hospital costs per patient during the implementation year was not statistically significant for people admitted with stroke (–$1692; IQR, –$4440 to $1056); the change for patients with myocardial infarction was significant (–$4278; IQR, –$5280 to –$3275). The median total cost per patient with myocardial infarction increased during the control and the P4P periods, and the difference between the rates was not statistically significant; the increases for patients with stroke were not statistically significant in either period. Rehabilitation costs for patients with stroke did not change significantly by study period (Box 5; Supporting Information, table 3).
The introduction of the QIP was not associated with a statistically significant change in summed Queensland public hospital costs for stroke (–$1.3 [95% CI, –$3.7 to $1.0] million per month), but it was associated with a significant decline in costs for myocardial infarction (–$2.1 million [95% CI, –$3.8 to –$4.2 million] per month). The median costs rose more rapidly during the P4P period for stroke care (from $6.7 [IQR, 6.0–7.4] million to $9.5 [IQR, 8.7–10.3] million per month) than myocardial infarction care (from $7.2 [IQR, 6.8–7.6] million to $8.6 [IQR, 8.0–9.1] million per month) (Supporting Information, table 4). The changes reflect the increase in the total number of admissions with stroke (from 226 per month in the control period to 257 per month in the P4P period) and the decline in the number of admissions with myocardial infarction (from 432 to 397 per month).
Emergency department re‐presentations and hospital re‐admissions
In all three study periods, the proportion of people who presented to emergency departments within 30 days of hospital discharge was larger for those who had been hospitalised with myocardial infarction than for people hospitalised with stroke; each proportion increased from the start of the control period (stroke: 8.7% [95% CI, 7.0–10.5%]; myocardial infarction: 16.5% [95% CI, 15.6–17.4%]) to the end of the P4P period (stroke: 15.1% [95% CI, 13.9–16.3%]; myocardial infarction: 21.5% [95% CI, 20.2–22.7%]). Differences in the rate of change between the control and P4P periods were not statistically significant (stroke: 0.02 [95% CI, –0.09 to 0.14]; myocardial infarction: 0.02 [95% CI, –0.06 to 0.10]) (Box 6; Supporting Information, table 5).
The proportion of non‐elective hospital re‐admissions was consistently larger following myocardial infarction than stroke, and both proportions increased from the start of the control period (stroke: 5.9% [95% CI, 4.3–7.4%]; myocardial infarction: 13.1% [95% CI, 12.3–13.8%]) to the end of the P4P period (stroke: 11.3% [95% CI, 10.1–12.5%]; myocardial infarction: 16.9% [95% CI, 15.8–18.0%]) (Box 6; Supporting Information, table 5).
Discussion
We found that the Queensland Health stroke unit QIP program had no impact on hospital costs for stroke care, median patient length of stay, or the proportion of people re‐admitted to hospital after stroke admissions. The clinician‐led pay‐for‐performance incentive program substantially improved stroke unit access, reduced regional differences in access, and was followed by a sustained decline in mortality following stroke in Queensland public hospitals.10 Although the program did not explicitly target length of stay or costs, improved quality of care and outcomes without increased costs or hospital use indicate that it was associated with improved value for health care expenditure.
P4P financial incentives are generally introduced to improve the value of health care, but evidence for their effectiveness in achieving this aim is very limited. The few P4P programs associated with reduced length of hospital stay targeted surgical processes of care (time to surgical fixation of hip fractures, post‐surgery complications), presumably leading to fewer complications and more rapid recovery.24,25,26 Reduced complication rates may explain the better outcomes achieved with stroke unit care,27 but the reductions in length of stay in randomised clinical trials have been variable and modest.9 Our findings support the view that the primary value of P4P in hospitals is that it improves quality of care. If reduced length of stay or costs are desired, P4P would be best directed to areas in which substantial improvements in quality of care are both achievable and strongly linked with reduced length of stay or costs. Reduced hospital use and costs have been reported for P4P schemes that target various chronic conditions throughout the continuum of care, including diabetes28 and chronic obstructive pulmonary disease.29 Using P4P to improve the efficiency of hospital care might be more effective if the hospital component is incorporated into schemes that span both hospital and community care.
Systemic changes to the organisation of hospital care could affect costs and use in either direction. Stroke unit care is more expensive than general medical ward care,11,12,13,14 including in Queensland,30 and its impact on hospital length of stay is not consistent.9 It is, however, cost‐effective because of the improved outcomes achieved.12,13 It is reassuring that, in our whole of system study, we found that length of stay and hospital costs were not significantly influenced by the QIP incentives, indicating that improved quality of care can be associated with greater efficiency and value. The declines in length of stay for people hospitalised with stroke or myocardial infarction were consistent with reported changes for all Australian hospitalisations, including the slower rate of decline in recent years.31 Further, the extra costs to the health funder of incentive payments (first year, $5 million; following two years, $8 million), may have been offset by the (statistically not significant) initial reduction in total hospital costs of $15.6 million during the implementation year ($1.3 million per month).
The Queensland Health stroke unit QIP program continues, but whether it is required to maintain its impact is uncertain. Discontinuation of other P4P programs has had different effects on processes of care indicators.32,33 Concerns have been raised about financial incentives shifting costs between health care sectors, such as from hospitals to skilled nursing facilities in the United States.34,35 In Australia, inpatient rehabilitation costs for stroke care are similar to those for acute hospital costs;36 our analysis did not find any evidence of shifting of care or costs from acute to rehabilitation care. Cost shifting could be more significant in countries where the costs of acute care and rehabilitation are borne by different providers.
The increasing hospital re‐admission rates for people with stroke or myocardial infarction in our study suggests the possibility of broader systemic trends. General increases in hospital re‐admission rates have been reported in Denmark37 and England.38 Reporting of re‐admission rates in Australia is limited to those following surgical admissions;39 data on re‐admissions after vascular events have not been systematically collected.40 Broader investigation of re‐admission rates in Australia is needed.
One might expect that multidisciplinary care in a stroke unit would reduce the risk of re‐admission. However, successful re‐admission reduction programs have involved post‐discharge community interventions;41 like several successful chronic disease P4P programs,28,29 interventions that promote integration across the continuum of care may more effectively reduce re‐admission rates.
Limitations
The decline in acute and total hospital costs for admissions of people with myocardial infarction when the stroke unit QIP program was introduced complicates comparisons and limits the value of this group as a control condition for our cost analysis. No changes to the costing system or guidelines related to cost attributions were made during this period (personal communication, Queensland Healthcare purchasing, funding and performance management branch, and the Queensland Cardiac Clinical Network, November 2022). Two new cardiac catheterisation laboratories in regional hospitals may have contributed to this change, as they reduced the need to transfer people with myocardial infarction and consequently their overall hospital length of stay.
Our study was observational in nature, and causal associations cannot be directly drawn from our analyses. Other factors may have influenced the outcomes assessed, including changes in the composition of the study population, policy, or outcome assessments. Our use of appropriate time series analysis components, including a large amount of pre‐intervention data, comparison with a clinical control condition not affected by the program, and including all Queensland adult residents with the study conditions, mean these factors were unlikely to have substantially influenced our findings.
As we examined costs from the hospital perspective, our study is not a comprehensive cost‐effectiveness analysis. However, hospital costs per patient did not immediately increase after program implementation, and the subsequent rise in costs was slower for stroke than for myocardial infarction care, indicating that the QIP was not associated with cost escalation.
Conclusions
A P4P incentive program that substantially improved stroke unit access and reduced 6‐month mortality among people with stroke was not associated with increased hospital length of stay or costs. Emergency department re‐presentation or hospital re‐admission rates were not affected by the program; each continued to rise for people who had been hospitalised with either stroke or myocardial infarction. The potential of P4P and funding incentives to improve value in health care is supported by our findings, primarily by improving outcomes rather than by reducing costs or the demand for hospital resources.
Box 1 – The Queensland Health Quality Improvement Payment stroke unit access program: target calculations and payments*
|
Time period |
Stroke unit access target |
Denominator for access calculation |
Additional requirements |
Monetary incentive |
|||||||||||
|
|
|||||||||||||||
|
July–December 2012 |
|
Stroke unit sites (identified by QSSCN planning) |
|
$117 500 per site‡ |
|||||||||||
|
January–June 2013 |
|
Stroke admissions to stroke unit hospital |
|
$117 500 per site† |
|||||||||||
|
July–December 2013 |
|
Stroke admissions to stroke unit hospital |
|
$105 000 per site† |
|||||||||||
|
January–June 2014 |
|
Health district stroke admissions§ |
|
Proportional to health district admissions¶ |
|||||||||||
|
July 2014 – June 2015 |
|
Health district stroke admissions§ |
|
Proportional to health district admissions** |
|||||||||||
|
Since July 2015 |
|
|
|
10% loading on activity‐based funding payment |
|||||||||||
|
|
|||||||||||||||
|
AuSCR = Australian Stroke Clinical Registry; QSSCN = Queensland Statewide Stroke Clinical Network. * Source: reference 10. Reproduced under Creative Commons licence. † According to national guidelines.15 ‡ Total 6‐month funding pool: $2 500 000. § Stroke unit to act as regional hub for stroke admissions from across their geographic health service. ¶ Total 6‐month funding pool: $2 500 000; allocation based on number of admissions per year (incorporates rural and regional site loading). ** Total 12‐month funding pool: $4 000 000. †† Performance within two standard deviations of mean performance for Queensland hospitals for eight indicators of quality of clinical care. |
|||||||||||||||
Box 2 – Selection of adults admitted to Queensland public hospitals with stroke or myocardial infarction, 2009–2017, for inclusion in our analyses of the impact of the Quality Improvement Payments program (stroke unit access) on hospital costs, length of stay, and re‐admissions
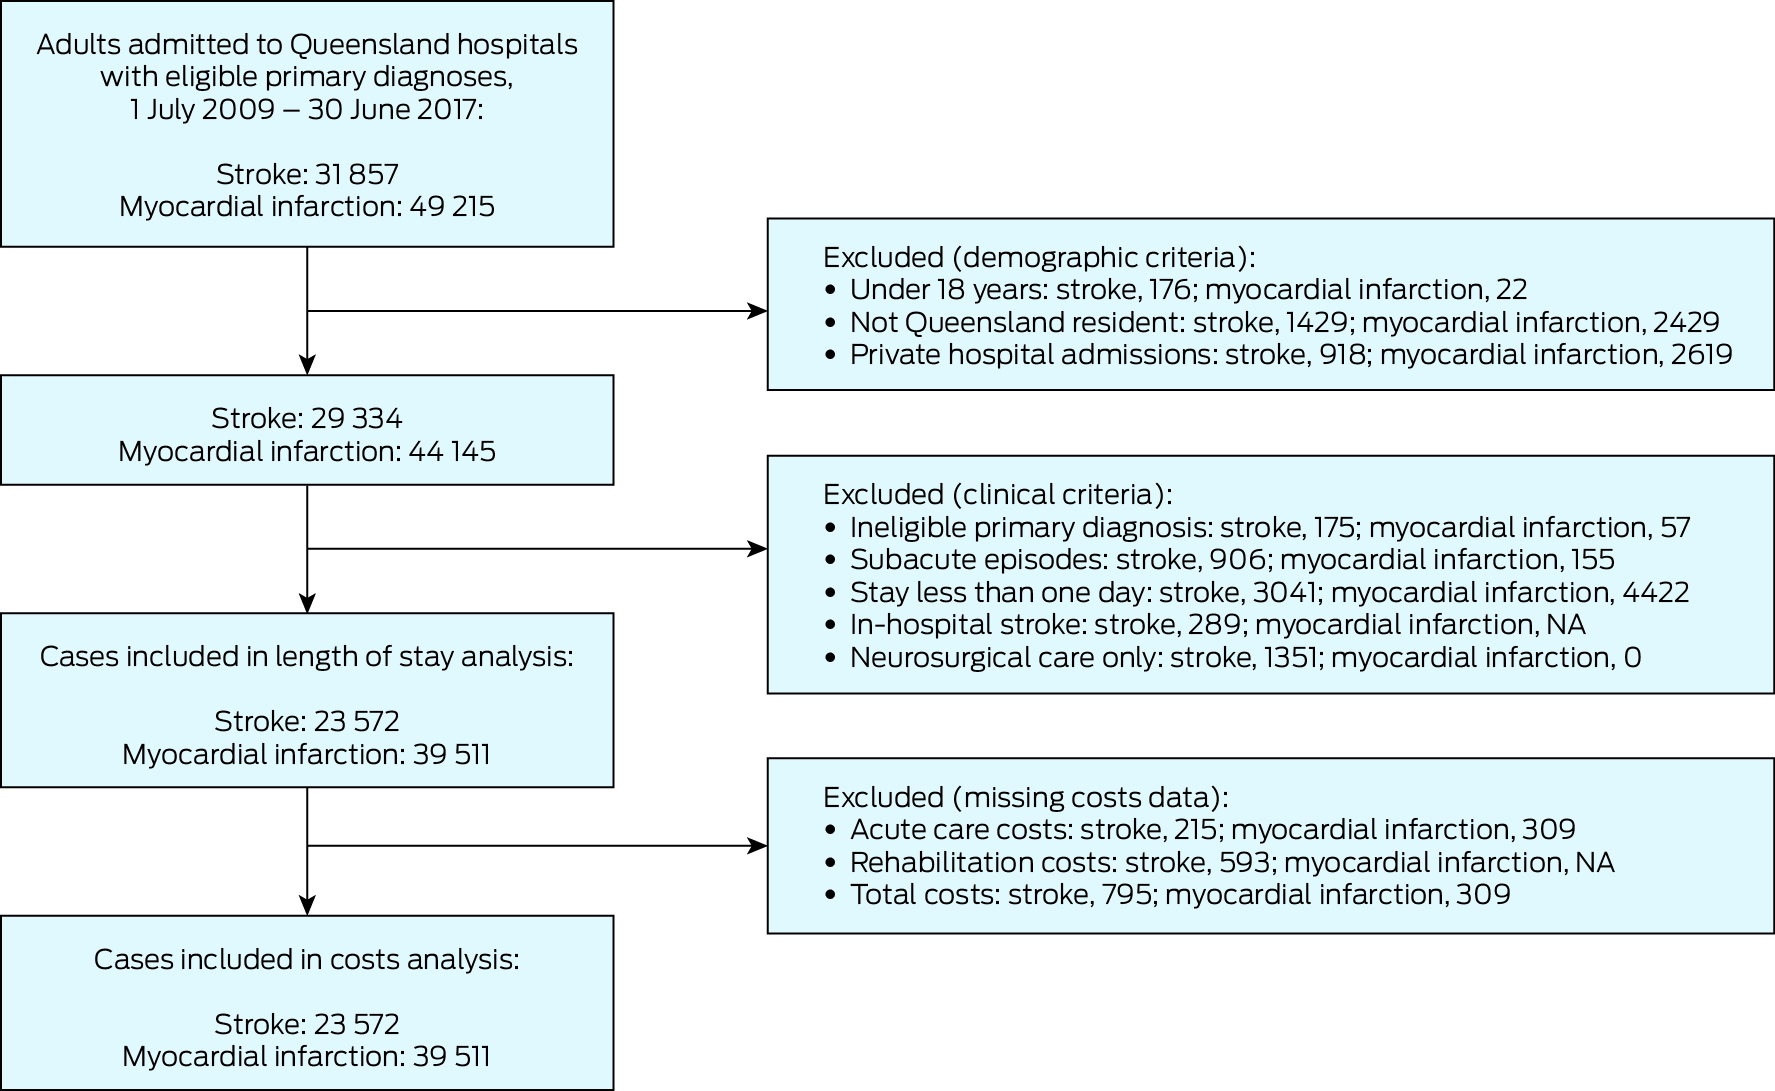
NA = not applicable.
Box 3 – Demographic characteristics and hospital use and costs for people admitted to Queensland public hospitals with stroke or myocardial infarction, 2009–2017, by study period
|
Characteristic |
Historical control period: July 2009 – December 2011 |
12‐month implementation period: January–December 2012 |
Pay‐for‐performance period: January 2013 – June 2017 |
||||||||||||
|
Stroke |
Myocardial infarction |
Stroke |
Myocardial infarction |
Stroke |
Myocardial infarction |
||||||||||
|
|
|||||||||||||||
|
All patients |
6776 |
12 963 |
2921 |
5105 |
13 875 |
21 443 |
|||||||||
|
Age (years), mean (SD) |
72 (14) |
67 (14) |
72 (14) |
67 (15) |
72 (14) |
67 (14) |
|||||||||
|
Sex (women) |
3167 (47%) |
4567 (35%) |
1294 (44%) |
1780 (35%) |
6349 (46%) |
7519 (35%) |
|||||||||
|
Admitted to specialty unit* |
2056 (30%) |
8895 (69%) |
1334 (46%) |
3501 (69%) |
11 048 (80%) |
15 659 (73%) |
|||||||||
|
Inpatient rehabilitation |
2484 (37%) |
338 (3%) |
1206 (41%) |
195 (4%) |
5770 (42%) |
681 (3%) |
|||||||||
|
Length of stay (days) median (IQR) |
|
|
|
|
|
|
|||||||||
|
Acute hospital |
6.6 (3.6–12.4) |
5.0 (3.3–8.8) |
5.7 (3.1–9.9) |
4.7 (3.0–8.2) |
5.0 (2.9–8.8) |
4.3 (2.9–7.8) |
|||||||||
|
Total hospital |
11.3 (4.8–35.0) |
5.2 (3.5–9.2) |
10.3 (4.4–33.0) |
4.9 (3.2–8.8) |
9.3 (4.0–30.5) |
4.6 (3.1–8.2) |
|||||||||
|
Rehabilitation† |
27.8 (13.0–51.7) |
19.3 (8.2–37.5) |
24.0 (12.0–49.0) |
14.9 (5.9–26.8) |
22.6 (11.0–40.9) |
16.0 (7.8–10.2) |
|||||||||
|
Costs‡ |
|
|
|
|
|
|
|||||||||
|
Missing data |
410 (6.1%) |
272 (2.1%) |
39 (0.8%) |
0 |
346 (2.5%) |
37 (0.2%) |
|||||||||
|
Acute care, median (IQR) |
$8762 ($4768–16 647) |
$12 710 ($7365–20 139) |
$8218 ($4710–14 717) |
$12 788 ($7400–21 429) |
$8231 ($5022–7276) |
$12 079 ($7276–18 918) |
|||||||||
|
Rehabilitation, median (IQR)† |
$25 157 ($11 681–48 436) |
$21 055 ($8276–43 739) |
$22 850 ($10 157–46 627) |
$16 277 ($6480–32 623) |
$24 507 ($10 655–48 113) |
$18 121 ($8424–33 159) |
|||||||||
|
Total costs, median (IQR) |
$14 392 ($6962–38 649) |
$13 842 ($8422–21 738) |
$14 631 ($7371–38 000) |
$14 324 ($8647–23 353) |
$14 642 ($7543–38 892) |
$13 380 ($8540–20 714) |
|||||||||
|
Subsequent hospital use |
|
|
|
|
|
|
|||||||||
|
Emergency department presentations (30 days) |
730 (11%) |
2186 (17%) |
342 (12%) |
934 (18%) |
1846 (13%) |
4372 (20%) |
|||||||||
|
Hospital re‐admissions (30 days) |
516 (8%) |
1710 (13%) |
230 (8%) |
712 (14%) |
1365 (10%) |
3483 (16%) |
|||||||||
|
|
|||||||||||||||
|
IQR = interquartile range; SD = standard deviation. * Stroke or coronary care units, as appropriate. † For people who received rehabilitation care. ‡ 2017 Australian dollars. |
|||||||||||||||
Box 4 – Effect of the Quality Improvement Payments program (stroke unit access) on median hospital lengths of stay for people admitted with stroke or myocardial infarction, 2009–2017: interrupted time series analysis*
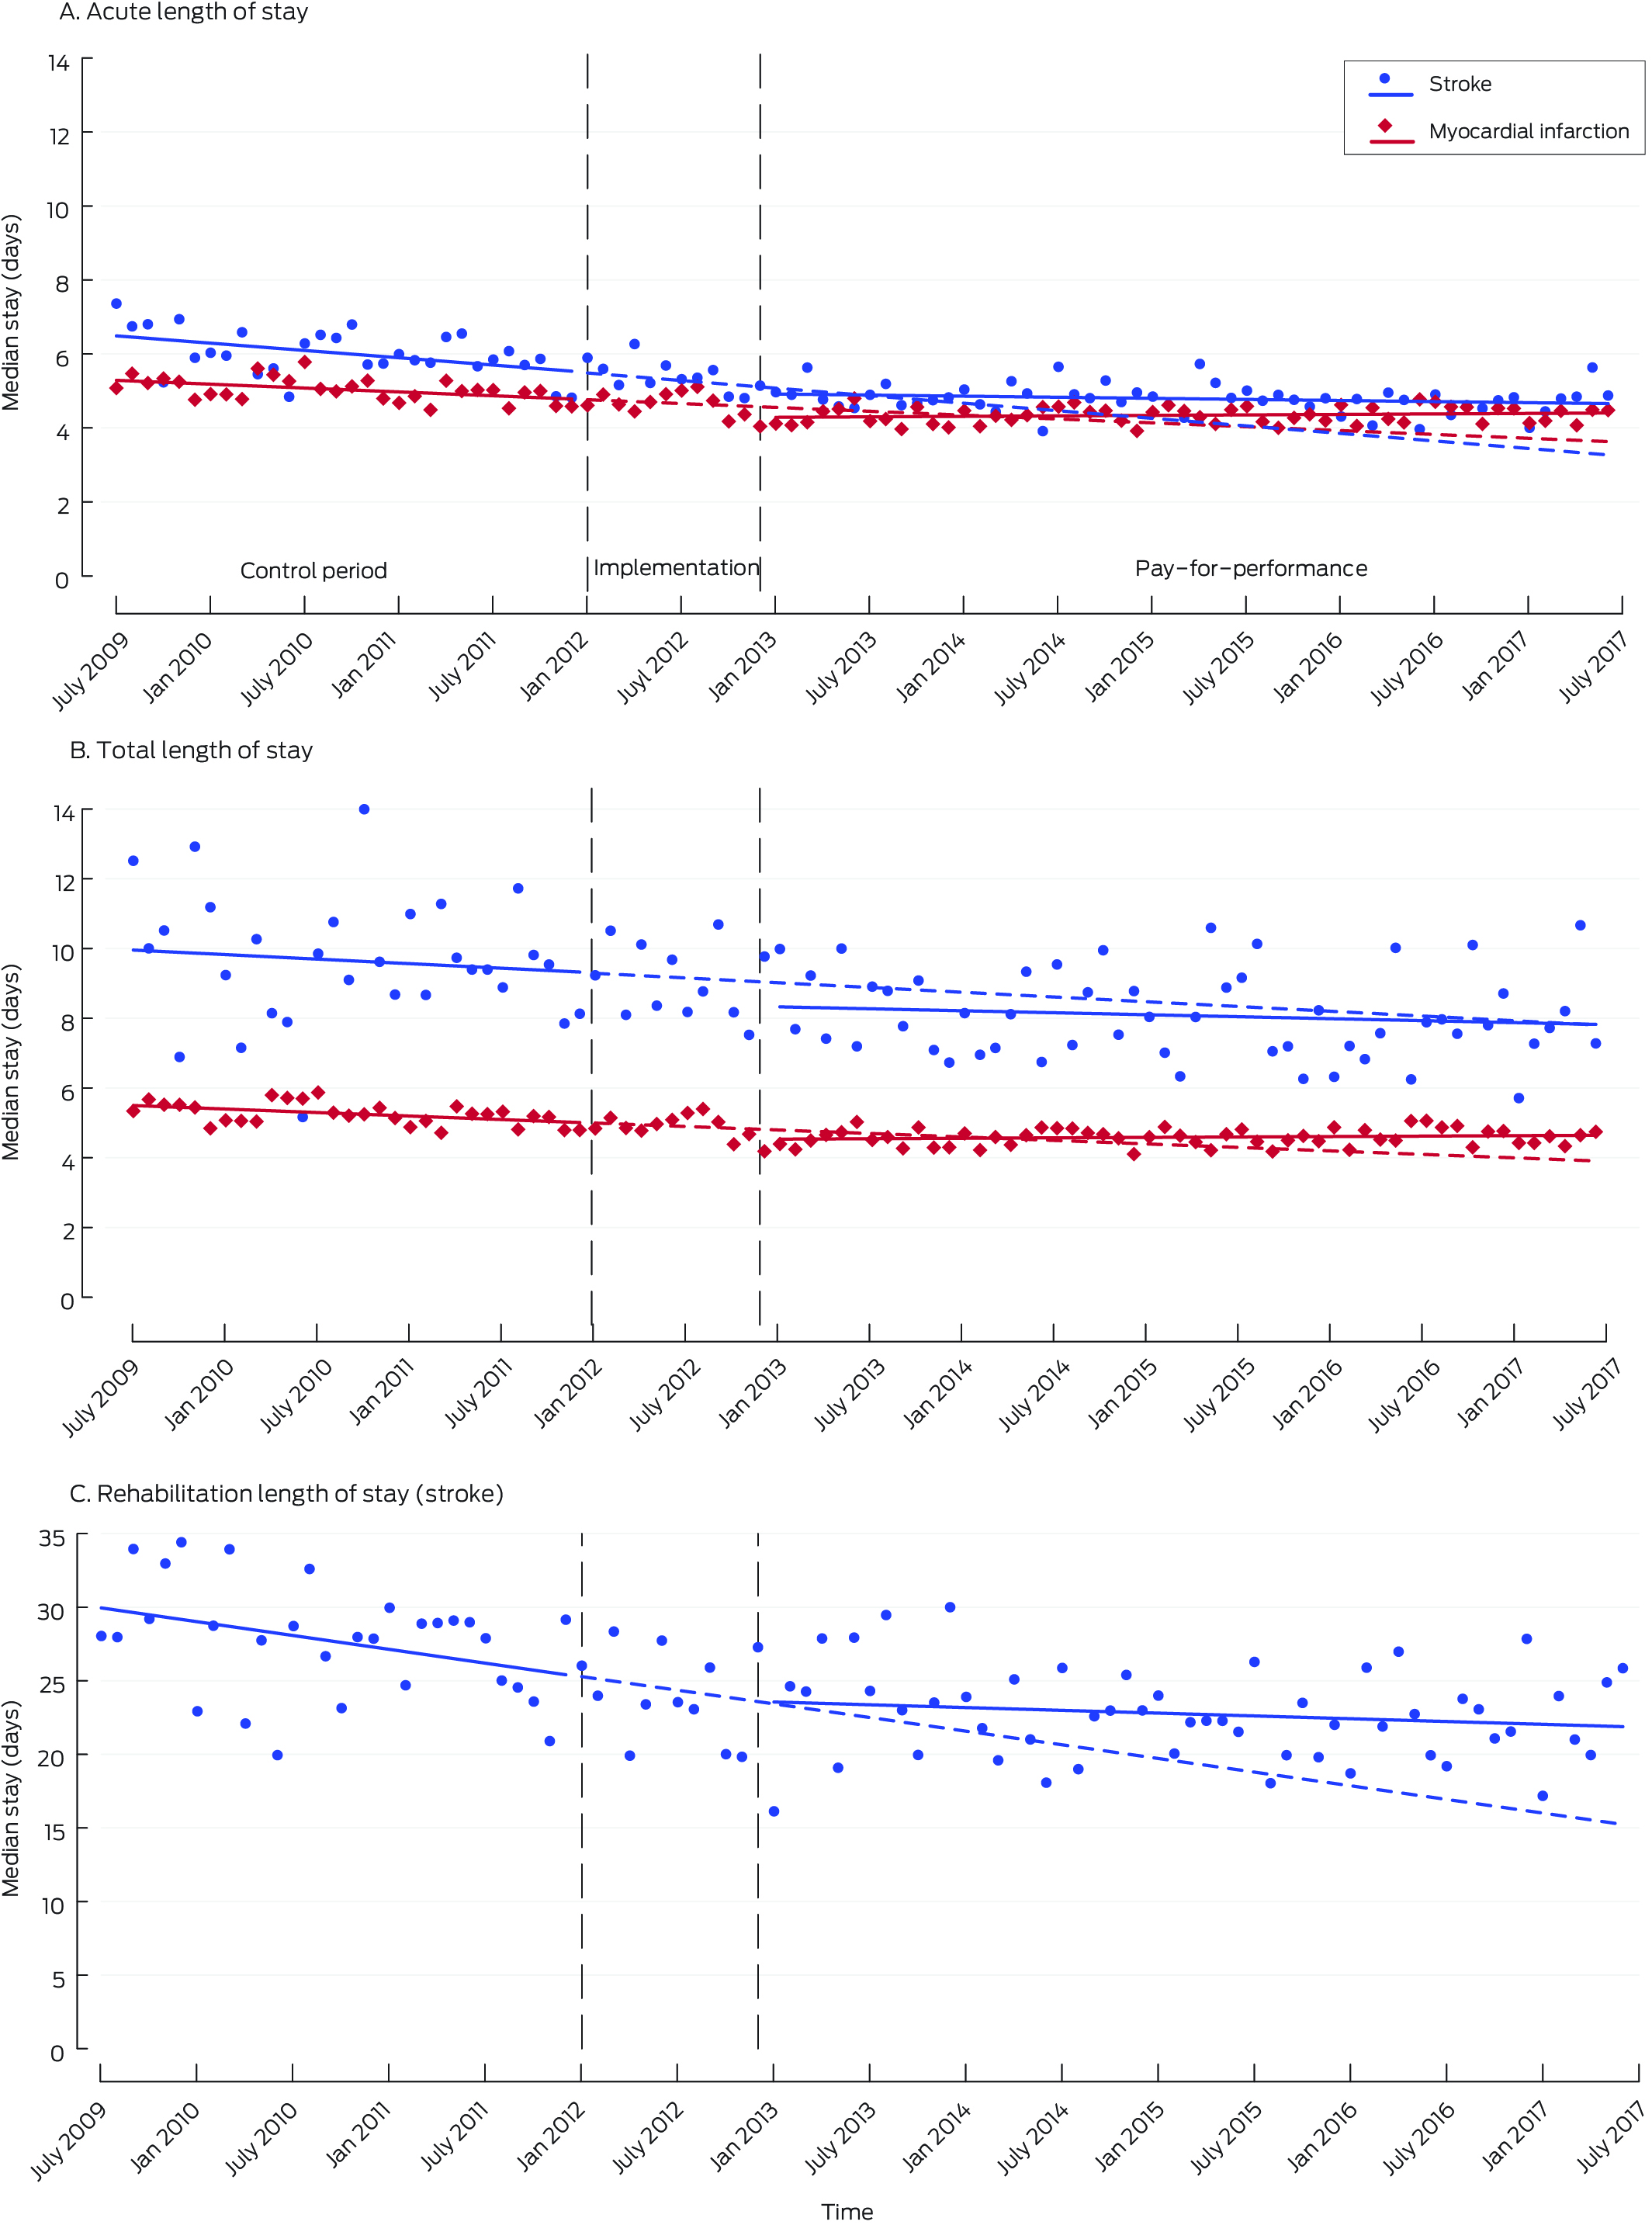
* Points indicate the median length of stay for each month; vertical dashed lines indicate the three study periods. The solid lines were separately fitted to the control and intervention periods using regression models; the dashed lines in the intervention period depict the continuation of control period trends.
Box 5 – Effect of the Quality Improvement Payments program (stroke unit access) on median hospital costs per patient (2017 dollars) for patients admitted with stroke or myocardial infarction, 2009–2017: interrupted time series analysis*
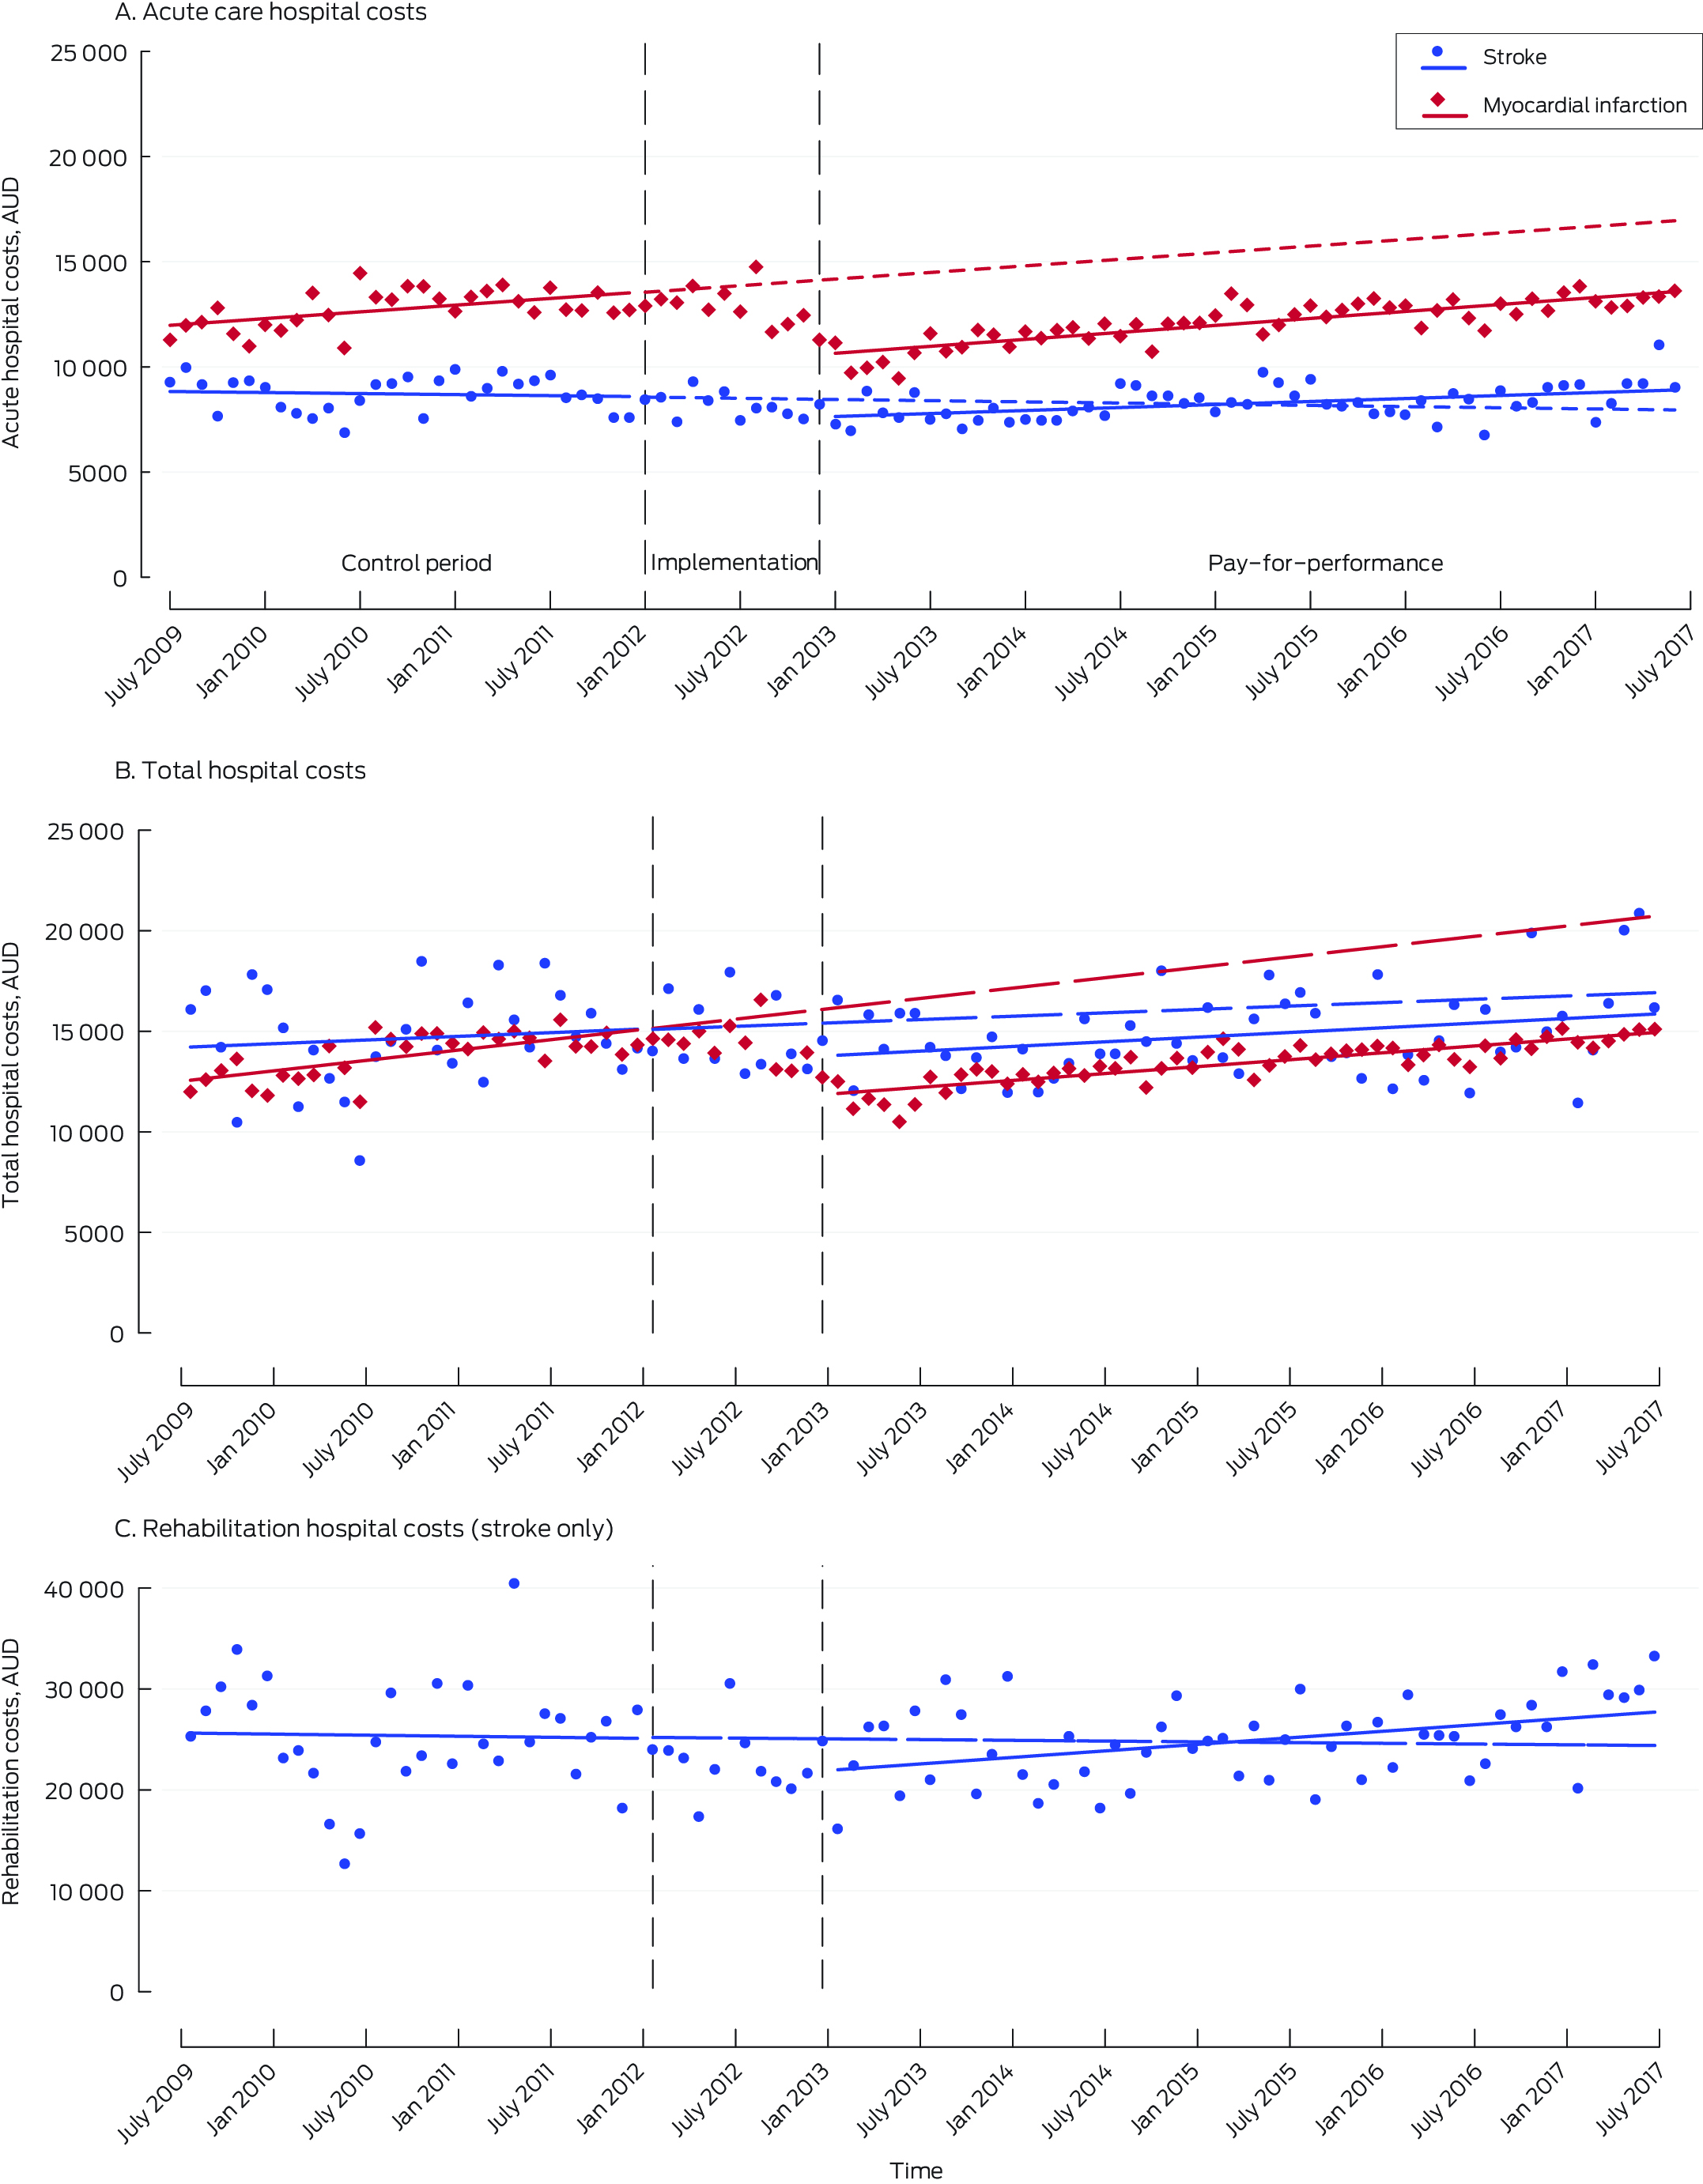
* Points indicate the median length of stay for each month; vertical dashed lines indicate the three study periods. The solid lines were separately fitted to the control and intervention periods using regression models; the dashed lines in the intervention period depict the continuation of control period trends.
Box 6 – Effect of the Quality Improvement Payments program (stroke unit access) on emergency department re‐presentations and non‐elective hospital re‐admissions within 30 days of discharge for patients admitted with stroke or myocardial infarction: interrupted time series analysis*
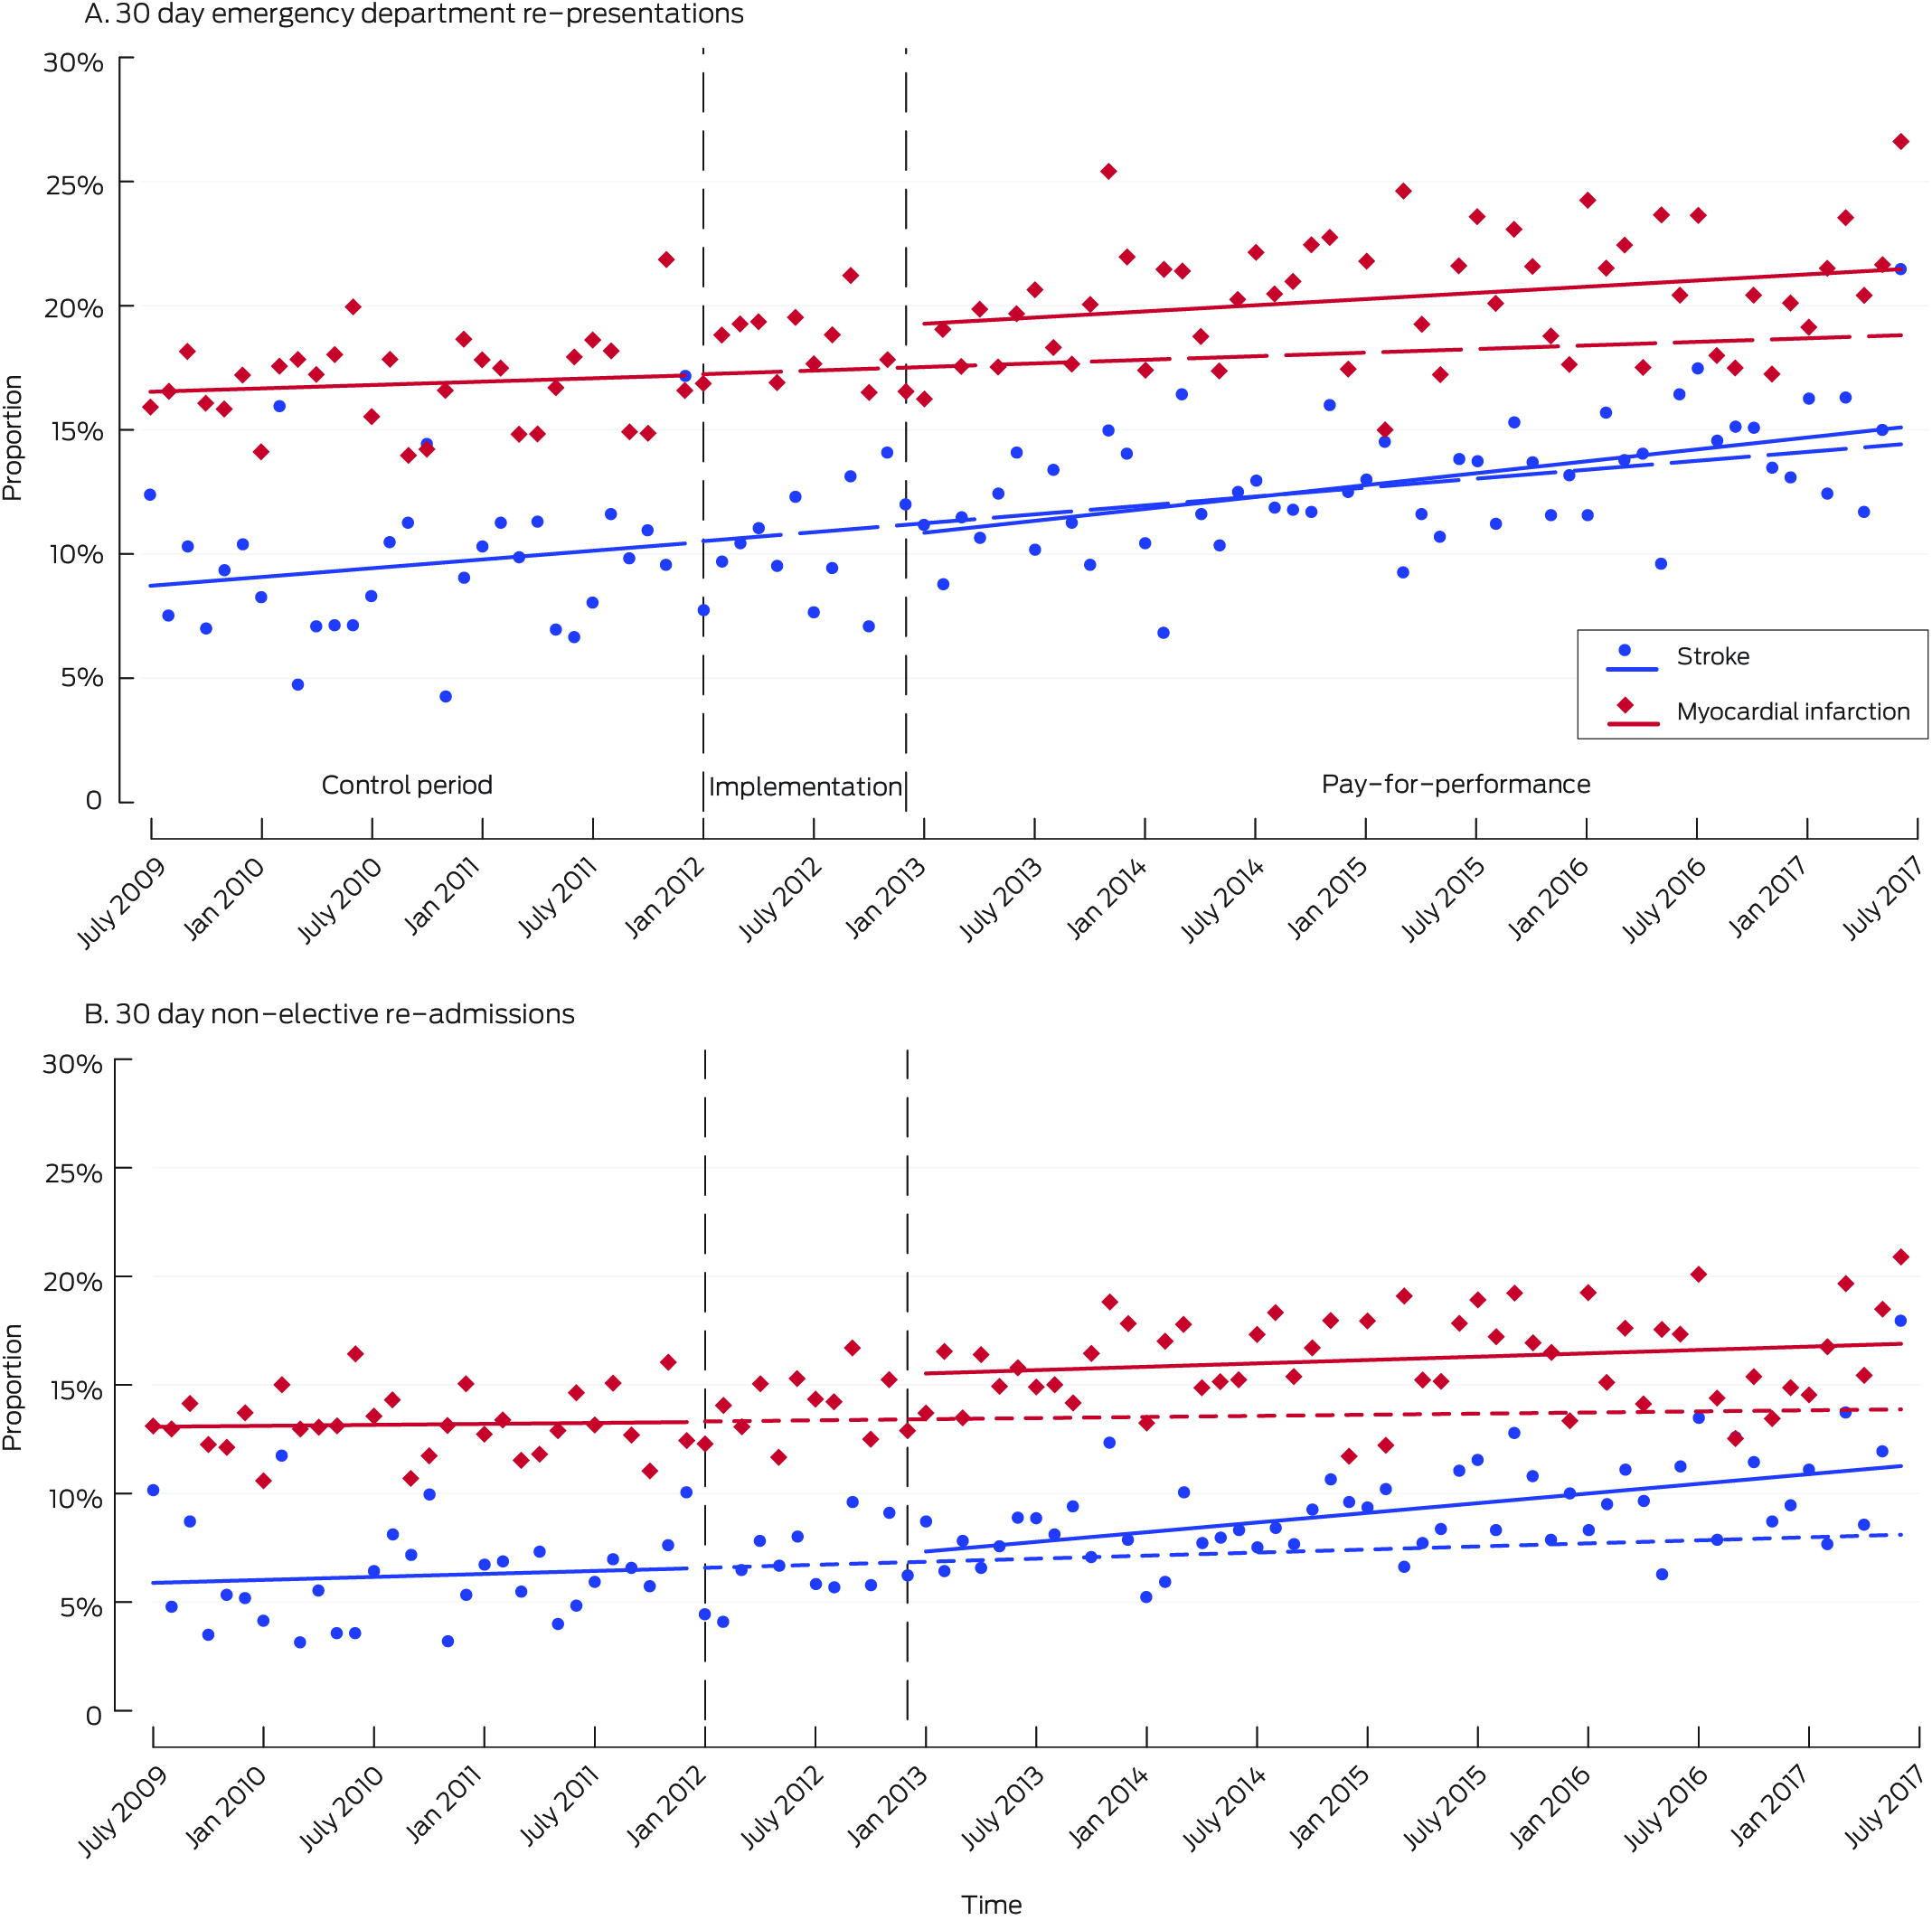
* Points indicate the median length of stay for each month; vertical dashed lines indicate the three study periods. The solid lines were separately fitted to the control and intervention periods using regression models; the dashed lines in the intervention period depict the continuation of control period trends.
Received 23 May 2024, accepted 26 August 2024
- Rohan Grimley1,2
- Joosup Kim3
- Helen M Dewey4
- Nadine E Andrew5,6
- Taya A Collyer5
- Eleanor S Horton7
- Greg Cadigan7
- Dominique A Cadilhac3,8
- 1 Sunshine Coast University Hospital, Kawana Waters, QLD
- 2 Griffith University, Kawana Waters, QLD
- 3 Monash Health, Monash University, Melbourne, VIC
- 4 Eastern Health Clinical School, Monash University, Melbourne, VIC
- 5 Peninsula Clinical School, Monash University, Melbourne, VIC
- 6 National Centre for Healthy Ageing, Monash University, Melbourne, VIC
- 7 Queensland Health, Brisbane, QLD
- 8 Florey Institute of Neuroscience and Mental Health, Melbourne, VIC
Open access:
Open access publishing facilitated by Griffith University, as part of the Wiley – Griffith University agreement via the Council of Australian University Librarians.
Data Sharing:
Legislative restrictions prevent person‐level data from this study being shared, but aggregated data are available from the corresponding author on reasonable request, following approval from the relevant data custodians.
Rohan Grimley was supported in this study by a Queensland Health Queensland Advancing Clinical Research Fellowship. Dominique Cadilhac was supported by a National Health and Medical Research Council Senior Research Fellowship (1154273). The funders had no input into the planning, conduct, writing, or decision to publish this research.
We thank the members of the Queensland State‐wide Stroke Clinical Network and the Queensland Healthcare Purchasing and System Performance Branch for their contributions to the design and implementation of the Queensland Health stroke unit Quality Improvement Payments program.
Rohan Grimley and Greg Cadigan are employed by Queensland Health. Rohan Grimley has received travel support from Boehringer Ingelheim for an educational meeting. Dominique Cadilhac has received grants paid to her institution from the Boehringer Ingelheim – Angels Initiative program, Amazon Web Services, Moleac, Bristol‐Myers Squibb, and Medtronic.
- 1. Mathes T, Pieper D, Morche J, et al. Pay for performance for hospitals. Cochrane Database Syst Rev 2019: 7: CD011156.
- 2. Kondo KK, Damberg CL, Mendelson A, et al. Implementation processes and pay for performance in healthcare: a systematic review. J Gen Intern Med 2016; 31 (Suppl 1): 61‐69.
- 3. Milstein R, Schreyoegg J. Pay for performance in the inpatient sector: a review of 34 P4P programs in 14 OECD countries. Health Policy 2016; 120: 1125‐1140.
- 4. Australian Department of Health and Aged Care. Practice Incentive Program Quality Improvement Incentive: guidance. Updated 3 Apr 2023. https://www1.health.gov.au/internet/main/publishing.nsf/Content/PIP‐QI_Incentive_guidance (viewed Mar 2024).
- 5. Independent Health and Aged Care Pricing Authority. Pricing and funding for safety and quality: sentinel events fact sheet. 17 Aug 2021. https://www.ihacpa.gov.au/resources/pricing‐and‐funding‐safety‐and‐quality‐sentinel‐events‐fact‐sheet (viewed Mar 2024).
- 6. Productivity Commission. Shifting the dial: 5 year productivity review. Supporting paper no. 3: Comparative performance indicators. 3 Aug 2017. https://www.pc.gov.au/inquiries/completed/productivity‐review/report/productivity‐review‐supporting3.docx (viewed Mar 2024).
- 7. Sutton M, Nikolova S, Boaden R, et al. Reduced mortality with hospital pay for performance in England. N Engl J Med 2012; 367: 1821‐1828.
- 8. Emmert M, Eijkenaar F, Kemter H, et al. Economic evaluation of pay‐for‐performance in health care: a systematic review. Eur J Health Econ 2012; 13: 755‐767.
- 9. Langhorne P, Ramachandra S; Stroke Unit Trialists Collaboration. Organised inpatient (stroke unit) care for stroke: network meta‐analysis. Cochrane Database Syst Rev 2020; 4: CD000197.
- 10. Grimley RS, Collyer TA, Andrew NE, et al. Impact of pay‐for‐performance for stroke unit access on mortality in Queensland, Australia: an interrupted time series analysis. Lancet Reg Health West Pac 2023; 41: 100921.
- 11. Launois R, Giroud M, Mégnigbêto AC, et al. Estimating the cost‐effectiveness of stroke units in France compared with conventional care. Stroke 2004; 35: 770‐775.
- 12. Te Ao BJ, Brown PM, Feigin VL, Anderson CS. Are stroke units cost effective? Evidence from a New Zealand stroke incidence and population‐based study. Int J Stroke 2012; 7: 623‐630.
- 13. Mihalopoulos C, Cadilhac DA, Moodie ML, et al. Development and application of Model of Resource Utilization, Costs, and Outcomes for Stroke (MORUCOS): an Australian economic model for stroke. Int J Technol Assess Health Care 2005; 21: 499‐505.
- 14. Moodie M, Cadilhac D, Pearce D, et al; SCOPES Study Group. Economic evaluation of Australian stroke services: a prospective, multicenter study comparing dedicated stroke units with other care modalities. Stroke 2006; 37: 2790‐2795.
- 15. Stroke Foundation. Australian and New Zealand living clinical guidelines for stroke management. 2024. https://informme.org.au/en/Guidelines/Clinical‐Guidelines‐for‐Stroke‐Management (viewed Jan 2025).
- 16. Independent Hospital Pricing Authority. National Hospital Cost Data Collection. Undated. https://www.ihacpa.gov.au/health‐care/costing/national‐hospital‐cost‐data‐collection (viewed Mar 2024).
- 17. Green J, Gordon R, Blanchard M, et al. Development of the Australian National Subacute and Non‐acute Patient Classification, version 4. Final report [Centre for Health Service Development, University of Wollongong]. Apr 2015. https://www.ihacpa.gov.au/sites/default/files/2022‐08/an‐snap_classification_version_4_final_report_0.pdf (viewed Mar 2024).
- 18. Australian Institute of Health and Welfare. Health expenditure Australia 2017–18: supplementary tables. 25 Sept 2019. https://www.aihw.gov.au/reports/health‐welfare‐expenditure/health‐expenditure‐australia‐2017‐18/data (viewed Mar 2024).
- 19. Kontopantelis E, Doran T, Springate DA, et al. Regression based quasi‐experimental approach when randomisation is not an option: interrupted time series analysis. BMJ 2015; 350: h2750.
- 20. Cumby RE, Huizinga J. Testing the autocorrelation structure of disturbances in ordinary least squares and instrumental variables regressions. Econometrica 1992; 60: 185‐195.
- 21. Linden A. Conducting interrupted time‐series analysis for single‐ and multiple‐group comparisons. Stata J 2018; 15: 480‐500.
- 22. Turner SL, Karahalios A, Forbes AB, et al. Design characteristics and statistical methods used in interrupted time series studies evaluating public health interventions: a review. J Clin Epidemiol 2020; 122: 1‐11.
- 23. Linden A. A comprehensive set of postestimation measures to enrich interrupted time‐series analysis. Stata J 2017; 17: 73‐88.
- 24. Uri O, Folman Y, Laufer G, Behrbalk E. A reimbursement system based on a 48‐hour target time for surgery shortens the waiting time for hip fracture fixation in elderly patients. J Orthop Trauma 2020; 34: 248‐251.
- 25. Kim KM, White JS, Max W, et al. Evaluation of clinical and economic outcomes following implementation of a Medicare pay‐for‐performance program for surgical procedures. JAMA Netw Open 2021; 4: e2121115.
- 26. Zogg CK, Metcalfe D, Judge A, et. al. Learning from England's best practice tariff: process measure pay‐for‐performance can improve hip fracture outcomes. Ann Surg 2022; 275: 506‐514.
- 27. Govan L, Langhorne P, Weir CJ; Stroke Unit Trialists Collaboration. Does the prevention of complications explain the survival benefit of organized inpatient (stroke unit) care? Further analysis of a systematic review. Stroke 2007; 38: 2536‐2540.
- 28. Cheng SH, Lee TT, Chen CC. A longitudinal examination of a pay‐for‐performance program for diabetes care: evidence from a natural experiment. Med Care 2012; 50: 109‐116.
- 29. Cheng SL, Li YR, Huang N, et al. Effectiveness of nationwide COPD pay‐for‐performance program on COPD exacerbations in Taiwan. Int J Chron Obstruct Pulmon Dis 2021; 16: 2869‐2881.
- 30. Kim J, Grimley R, Kilkenny MF, et al. Costs of acute hospitalisation for stroke and transient ischaemic attack in Australia. Health Inf Manag 2023; 52: 176‐184.
- 31. Reid N, Gamage T, Duckett SJ, Gray LC. Hospital utilisation in Australia, 1993–2020, with a focus on use by people over 75 years of age: a review of AIHW data. Med J Aust 2023; 219: 113‐119. https://www.mja.com.au/journal/2023/219/3/hospital‐utilisation‐australia‐1993‐2020‐focus‐use‐people‐over‐75‐years‐age
- 32. Benzer JK, Young GJ, Burgess JF, et al. Sustainability of quality improvement following removal of pay‐for‐performance incentives. J Gen Intern Med 2013; 29: 127‐132.
- 33. Brown K, El Husseini N, Grimley R, et al. Alternative payment models and associations with stroke outcomes, spending, and service utilization: a systematic review. Stroke 2022; 53: 268‐278.
- 34. Popescu I, Sood N, Joshi S, et al. Trends in the use of skilled nursing facility and home health care under the hospital readmissions reduction program: an interrupted time‐series analysis. Med Care 2019; 57: 757‐765.
- 35. Brown K, El Husseini N, Grimley R, et al. Alternative payment models and associations with stroke outcomes, spending, and service utilization: a systematic review. Stroke 2022; 53: 268‐278.
- 36. Dewey HM, Thrift AG, Mihalopoulos C, et al. Cost of stroke in Australia from a societal perspective: results from the North East Melbourne Stroke Incidence Study (NEMESIS). Stroke 2001; 32: 2409‐2416.
- 37. Bogh SB, Fløjstrup M, Möller S, et al. Readmission trends before and after a national reconfiguration of emergency departments in Denmark. J Health Serv Res Policy 2023; 28: 42‐49.
- 38. Blunt I, Bardsley M, Grove A, Clarke A. Classifying emergency 30‐day readmissions in England using routine hospital data 2004–2010: what is the scope for reduction? Emerg Med J 2015; 32: 44‐50.
- 39. Australian Commission on Safety and Quality in Health Care. Avoidable hospital readmissions: report on Australian and international indicators, their use and the efficacy of interventions to reduce readmissions. June 2019. https://www.safetyandquality.gov.au/publications‐and‐resources/resource‐library/avoidable‐hospital‐readmission‐literature‐review‐australian‐and‐international‐indicators (viewed Mar 2024).
- 40. Labrosciano C, Air T, Tavella R, et al. Readmissions following hospitalisations for cardiovascular disease: a scoping review of the Australian literature. Aust Health Rev 2020; 44: 93‐103.
- 41. Leppin AL, Gionfriddo MR, Kessler M, et al. Preventing 30‐day hospital readmissions: a systematic review and meta‐analysis of randomized trials. JAMA Intern Med 2014; 174:1095‐1107.
Abstract
Objectives: To assess the impact of pay‐for‐performance financial incentives for improving stroke unit access in Queensland public hospitals on hospital costs and use.
Study design: Population‐based longitudinal study; interrupted time series analysis of linked hospital admissions, emergency department, and hospital costs data.
Setting, participants: First admissions with stroke or myocardial infarction of adult Queensland residents (18 years or older) to public hospitals for more than one day during 1 July 2009 – 31 December 2011 (pre‐incentive period), 1 January 2012 – 31 December 2012 (intervention implementation period), and 1 January 2013 – 30 June 2017 (intervention period). Admissions to neurosurgical wards of people with intracerebral haemorrhage were excluded.
Intervention: Queensland Health pay‐for‐performance program: Quality Improvement Payments (QIP). Initial three years: payments to hospitals contingent on progressively increasing targets for the proportion of people with stroke admitted to acute stroke units. Subsequent years: 10% loading on Diagnosis Related Group‐based payments for the care of patients with primary diagnoses of stroke admitted to stroke units.
Main outcome measures: Changes in level and rates of change of outcomes (hospital length of stay, patient‐attributed hospital costs, non‐elective hospital re‐admissions) for admissions of people with stroke or myocardial infarction (as control condition) before and after the introduction of the QIP.
Results: We analysed data for 23 572 people admitted with stroke and 39 511 admitted with myocardial infarction. The median acute length of stay did not change significantly during the implementation year for either patient group; and pre‐intervention downward trends declined to near zero for both groups. The difference between the pre‐incentive and implementation periods in median total hospital costs per patient with stroke was not statistically significant (–$1692; interquartile range [IQR], –$4440 to $1056), in contrast to the difference for patients with myocardial infarction (–$4278; IQR, –$5280 to –$3275). The proportion of non‐elective hospital re‐admissions was consistently larger following myocardial infarction than stroke; both proportions increased from the start of the control period to the end of the intervention period (for stroke: from 5.9%; 95% confidence interval [CI], 4.3–7.4% to 11.3%; 95% CI, 10.1–12.5%).
Conclusions: Pay‐for‐performance quality incentives had no impact on hospital length of stay, costs, or re‐admissions. By improving quality of care and survival without increasing hospital use or costs, the QIP was associated with improved value for health care expenditure.