The known: Robust evidence on the economic burden of long COVID in Australia is limited.
The new: Long COVID potentially peaked in late July or early August 2022, based on COVID‐19 case numbers for the period January 2021 to April 2023. The estimated cost of long COVID in 2022 was about $1.7 billion to $6.3 billion — a fraction of a percentage point of Australia's gross domestic product. Labour market analysis indicates that more working age Australians than expected may now be unable to work, potentially because of long COVID.
The implications: Long COVID likely had a small but perceptible impact on the Australian economy, which can provide insights for shaping Australia's policy response.
Long COVID, or post‐coronavirus disease 2019 condition, is a chronic condition that emerged as a widely recognised phenomenon towards the end of 2020. A wide spectrum of long COVID symptoms have been documented, including extreme fatigue and dysautonomia through to imaging‐confirmed impacts on the cardiovascular and neurological systems.1 The mechanisms of long COVID pathogenesis are unclear and contested, as are potential therapies.1
Estimating the true prevalence of long COVID after a severe acute respiratory syndrome coronavirus 2 (SARS‐CoV‐2) infection has been contentious, with very wide‐ranging estimates2,3,4,5 and complex challenges in identifying control groups.6 The initial burden of long COVID in Australia was low,6 mainly due to the successful containment of coronavirus disease 2019 (COVID‐19) during 2020 and 2021. However, this situation changed with the advent of widespread COVID‐19 infections during 2022 and 2023. International evidence confirmed that the combination of high levels of COVID‐19 vaccination and lower risks from Omicron and subsequent SARS‐CoV‐2 variants would result in lower levels of long COVID than those seen overseas in 2020 and 2021.7 There has, however, been no ongoing program to monitor the prevalence of long COVID in Australia to date. To our knowledge, only a very small number of clinical cohort studies and population surveys have been conducted, from which estimates of long COVID prevalence have been reported as ranging from 4.7% to 18.2% at 90 days after SARS‐CoV‐2 infection.8,9,10
In more severely affected nations, concerns have been expressed that long COVID has driven a large increase in the number of people unable to work due to disability or long term sickness, with potentially profound negative economic impacts on individuals, households and wider economic productivity.11,12 Similar concerns have been expressed in Australia, but clear estimates of long COVID prevalence and of disability or long term sickness are difficult to obtain. A recent modelling study of the overall costs of COVID‐19 in Australia estimated baseline annual direct costs of $0.59 billion and indirect costs of $6.55 billion attributable to long COVID, assuming some 990 000 long COVID cases.13 The Australian situation is complicated by current record low levels of unemployment and high levels of participation in the labour force.14 Long COVID might itself be contributing to today's tight labour market conditions, plus people unwell with long COVID might find themselves forced to remain in the labour market due to current cost‐of‐living pressures.
In this article, we aim to shed light on the potential economic burden of long COVID in Australia by combining three approaches:
- updating earlier modelling of the likely number of Australians with any and severe long COVID symptoms;
- applying estimates of the economic costs experienced by people with myalgic encephalomyelitis/chronic fatigue syndrome (ME/CFS) — a condition increasingly viewed as sharing many similarities with long COVID — to estimate potential population‐based costs; and
- analysing official Australian labour market and social security statistics to identify trends which might be consistent with the hypothesised impacts of long COVID.
Methods
Modelling long COVID cases in Australia
We updated and re‐ran our existing national model of likely long COVID case numbers over time.15 A simple tree model, adapted from our previous published study,16 was developed in Excel (Microsoft Corporation). The numbers of long COVID cases were estimated by multiplying the probability of developing long COVID6,17,18 with the numbers of COVID‐19 survivors.19,20 The numbers of COVID‐19 survivors were estimated by subtracting the total deaths due to COVID‐19 from the total numbers of COVID‐19 cases,19 stratified by vaccination status by using a NSW Health surveillance report.20 Our 2022 long COVID prevalence model relied on point estimates of long COVID and did not account for the impact of recovery trajectories over time. To address this limitation, a stock‐and‐flow model was developed and used to estimate weekly numbers of people with long COVID symptoms. In this model, “new” long COVID cases are added on a weekly basis three months after each patient's original infection (based on reported SARS‐CoV‐2 infection numbers), while “recovered” long COVID cases are removed from the model in line with assumed recovery trajectories up to 12 months after the infection. The model was then used to estimate the number of people who will be “limited a lot” by their symptoms based on United Kingdom's Office for National Statistics self‐reported data: 20.2% (95% confidence interval [CI], 19.6–20.9%) at three months, and 20.5% (95% CI, 19.7–21.3%) at one year.
Sensitivity and scenario analyses
Three different scenarios for long COVID prevalence following infection and for subsequent recovery were modelled:
- 5% prevalence of long COVID at 14 weeks after infection, with recovery trajectory based on decay function according to UK Office for National Statistics data on double‐ and triple‐vaccinated people with Omicron infections (model 1);17,18
- 3.7% prevalence of long COVID at three months after infection, as estimated from US Institute for Health Metrics and Evaluation data, with 15% of people still experiencing symptoms 1 year after infection (model 2);6 and
- Australian population estimates of the likely number of people experiencing long COVID in August 2022 used as baseline, based on research conducted at Australian National University,10 to which recovery trajectories were fitted from the previous two scenarios (models 3 and 4 respectively).
Uncertainty analyses were conducted by running 2000 iterations of the model using Monte Carlo simulations via the Ersatz version 1.35 add‐in tool for Excel (EpiGear International).21 The following variables and assumptions were tested to check the robustness of the model results: long COVID probabilities, severity of long COVID symptoms, and impact of COVID‐19 vaccine in preventing long COVID. Full details are provided in the original report and technical appendix.15 The original model run was extended by including nationally reported SARS‐CoV‐2 infections to 3 March 2023, generating long COVID estimates to 4 June 2023.
Applying ME/CFS patient‐level costs to long COVID
In the absence of current Australian data on costs relating to the impact of long COVID or quality‐adjusted life‐year/disability‐adjusted life‐year weights for the impact of long COVID, we used data from our recent study on the health economics and epidemiology of ME/CFS.22 Strong similarities between long COVID and ME/CFS have been repeatedly noted overseas and in Australia.1,23 Our study of the economic burden of ME/CFS in Australia used patient cost diaries and linked administrative data (from the Medicare Benefits Schedule and Pharmaceutical Benefits Scheme) to collect detailed cost data on direct health care costs (including out‐of‐pocket costs), lost work and productivity costs, and informal carer costs for 175 patients who had ME/CFS. Given our focus on those most severely affected by long COVID, we used cost data on patients with ME/CFS who reported severe fatigue as a proxy for patients severely affected by long COVID; in this group, the total annual economic cost per person was $77 663 (or $1493 per week) in 2021 Australian dollars. Full details are provided in the Supporting Information, appendix 1. We then combined these costs with model estimates of numbers of patients with long COVID over time, and compared the resulting costs with Australian Bureau of Statistics (ABS) data on gross domestic product (GDP) using current Australian dollar values as published for the period December 2021 to March 2023.24
Analysis of labour market statistics
We analysed ABS labour force data for people not working or not wanting to work due to long term sickness or disability from two overall ABS survey collections: data on barriers and incentives to labour force participation, for which quarterly results are published in alternate years;25 and data on potential workers from the Participation, Job Search and Mobility survey, which is collected annually each February.26 To assess whether changing trends in these variables were visible in the post‐COVID‐19 period, we used a negative binomial regression approach to estimate excess numbers of people not working or not wanting to work due to self‐reported long term sickness or disability, accounting for seasonal differences. Full details are provided in the Supporting Information, appendix 2. We also examined data from the Department of Social Services to identify any trends in data on Disability Support Pensions, Carer Allowances and Carer Payments, and people receiving JobSeeker who had reduced capacity to work.27
Ethics approval
Ethics approval was not required for this study as it was based on publicly available data.
Results
Likely numbers of people with long COVID
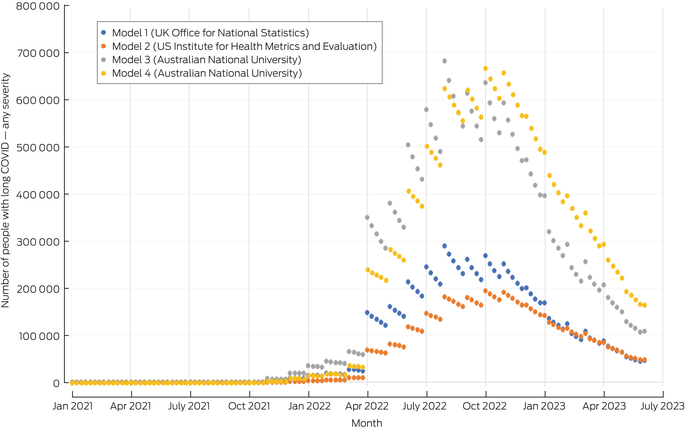
Summary outputs of the long COVID models are provided in Box 1 (which shows numbers of people with long COVID symptoms of any severity) and Box 2 (which shows numbers of people with long COVID symptoms that limited their daily activities a lot). Full weekly model outputs are provided in the Supporting Information, appendix 3. The trends in Box 1 indicate that the number of people with any long COVID symptoms likely peaked in late July or early August 2022, with a minimum of 181 000 people experiencing some level of long COVID and a possible maximum as high as 682 000 people affected at any level. These numbers then fell consistently through the rest of 2022 and early 2023; by early June 2023, between 46 000 and 164 000 Australians might have been expected to be experiencing any long COVID symptoms.
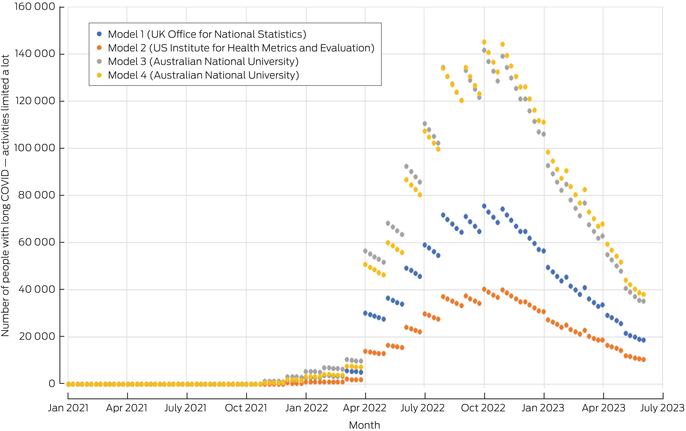
The number of people with long COVID symptoms that limited their activities a lot is, however, likely to be a much more important quantity to consider from an economic and policy perspective. The trends in Box 2 show that the likely number of severely affected people similarly peaked during the third quarter of 2022, at somewhere between 40 000 and 145 000 people. The models suggest that by early June 2023, the number of people still experiencing severely limiting long COVID symptoms had fallen to between 10 000 and 38 000.
Likely economic costs of long COVID
Using costs from people experiencing severe fatigue due to ME/CFS as a proxy for the economic costs likely to be experienced by people with severely limiting long COVID, these model outputs can provide estimates of the likely economic burden of severe long COVID on Australian society. The data shown in Box 3 indicate that most of these costs were incurred during 2022, when the models suggest that long COVID cases were at their peak. During 2022, estimated costs of long COVID ranged between $1.7 billion and $6.3 billion. When expressed as a proportion of total Australian GDP in 2022 (Box 4), the economic burden of severe long COVID was likely to have been between 0.07% and 0.26% of GDP.
Labour market participation
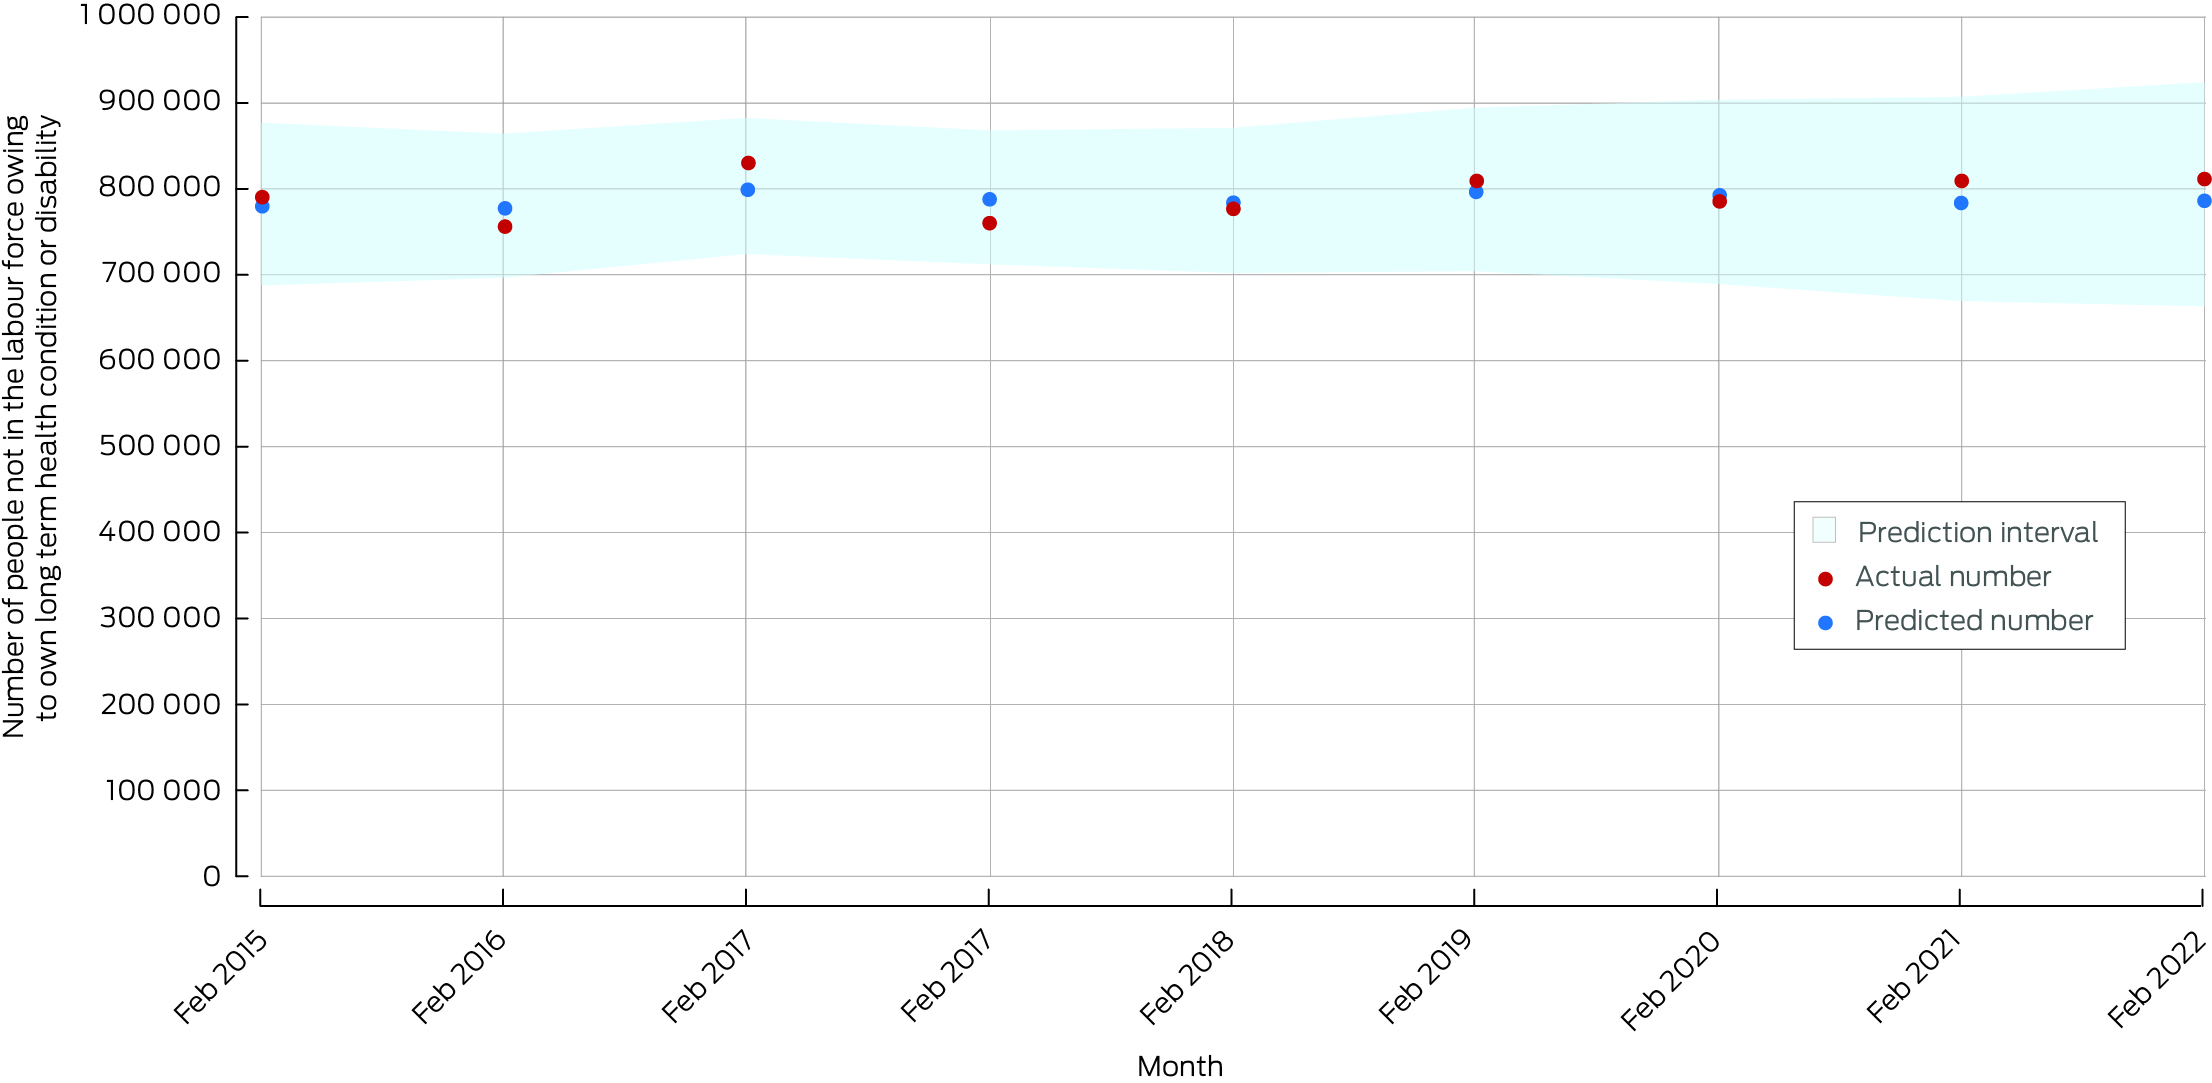
Box 5 shows data from the ABS on the actual and predicted numbers of people aged 18–64 years reporting that they did not want to work for the main reason of “long‐term sickness or disability” (Supporting Information, appendix 2).25 These data show that the actual numbers of people not wanting to work due to long term sickness have consistently exceeded model‐predicted values (compared with pre‐COVID‐19 years) since March 2021. In March 2023, the excess number of people in this category was 87 000 above the predicted level based on pre‐pandemic trends; this rose to an excess of 103 000 people not wanting to work due to long term sickness or disability in June 2023. Box 6 shows data from the ABS on the actual and predicted numbers of people not in the labour force who reported their main activity as “own long‐term health condition or disability” (Supporting Information, appendix 2).26 These data show that the actual numbers of people in this category exceeded the predicted numbers in both February 2022 and February 2023, with an excess of more than 25 000 people in both years.
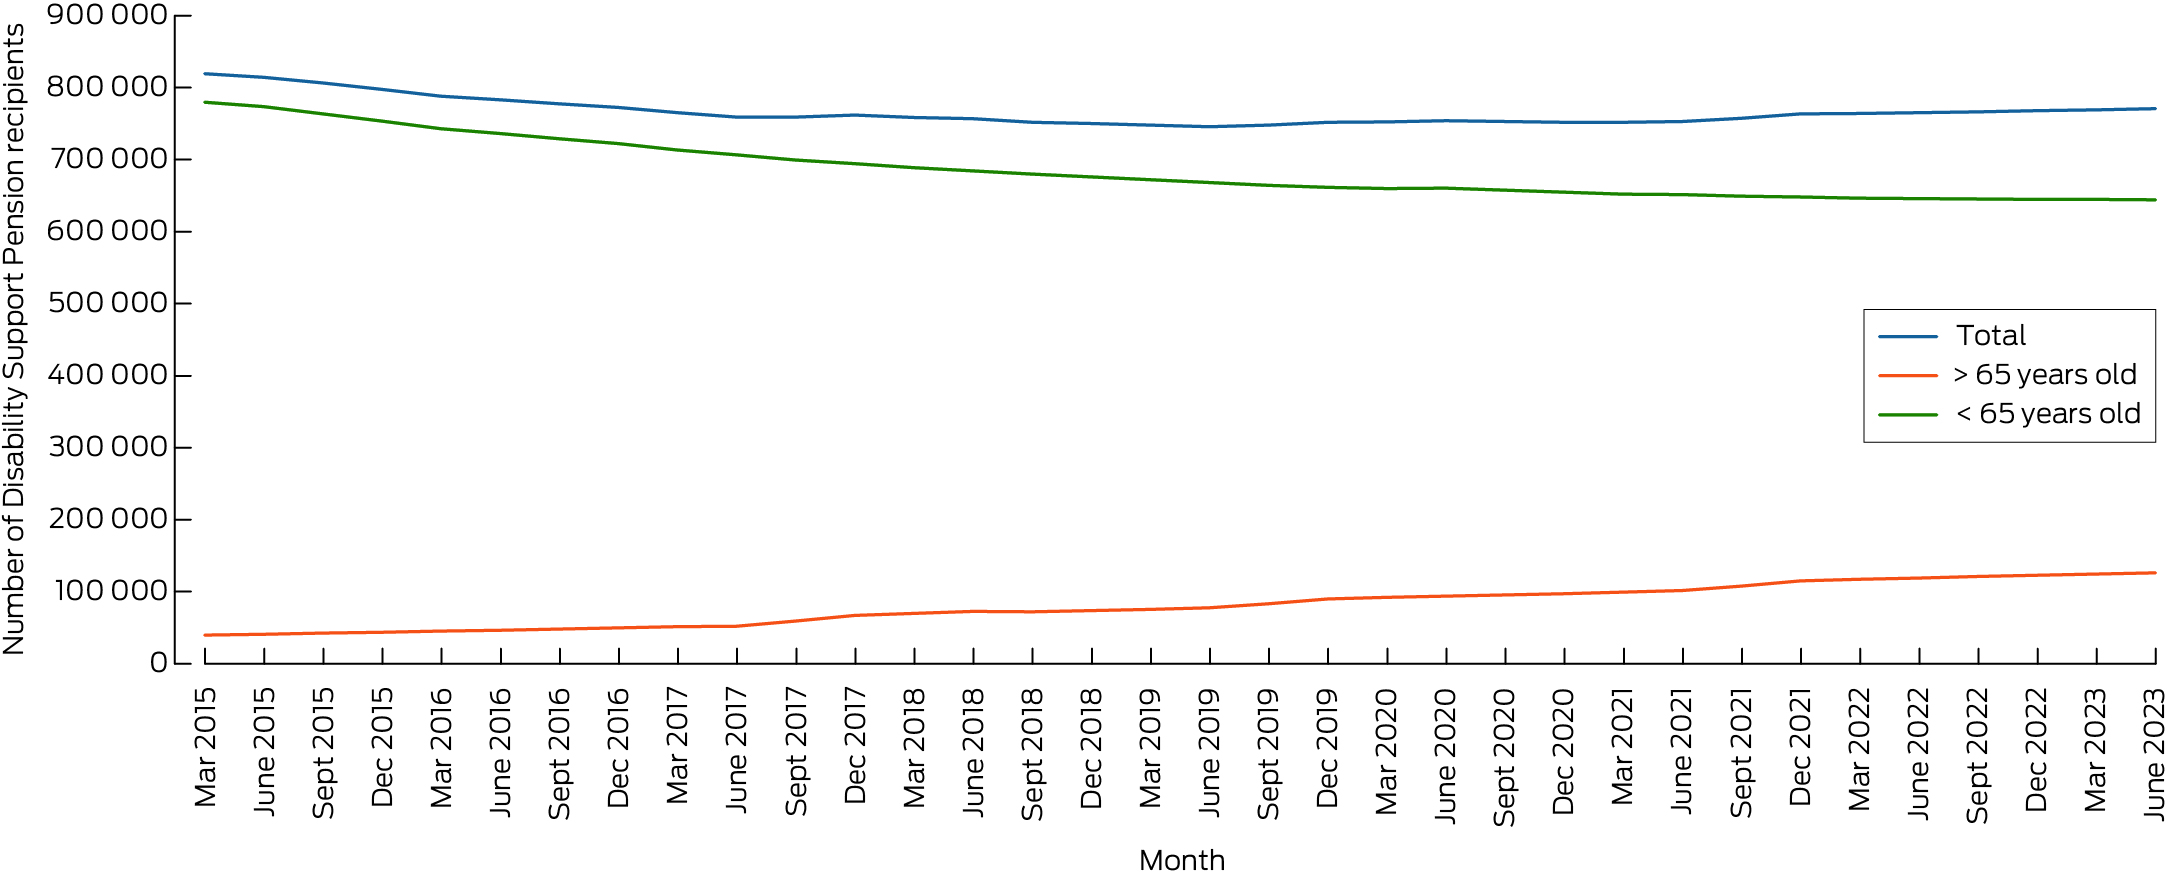
Box 7 shows Department of Social Services data on the total number of Disability Support Pension recipients, with a split by those aged < 65 years and ≥ 65 years. This pension has highly restrictive eligibility criteria (eg, “your condition is likely to persist for more than 2 years”, “your condition will stop you working at least 15 hours a week in the next 2 years”), and the process for qualifying is likely to involve a long lead time. Only those most seriously affected by long COVID would be likely to qualify for it, and even these individuals may not yet have negotiated the assessment process.
The total number of Disability Support Pension recipients fell steadily from 891 455 in March 2015 to a low of 745 673 in June 2019, after which it steadily increased to 770 495 in June 2023, so the inflection preceded the COVID‐19 pandemic. Box 7 also shows that the number of Disability Support Pension recipients aged ≥ 65 years has steadily grown, while the number of recipients aged < 65 years has fallen, which is likely to reflect ageing of the existing cohort of Disability Support Pension recipients.
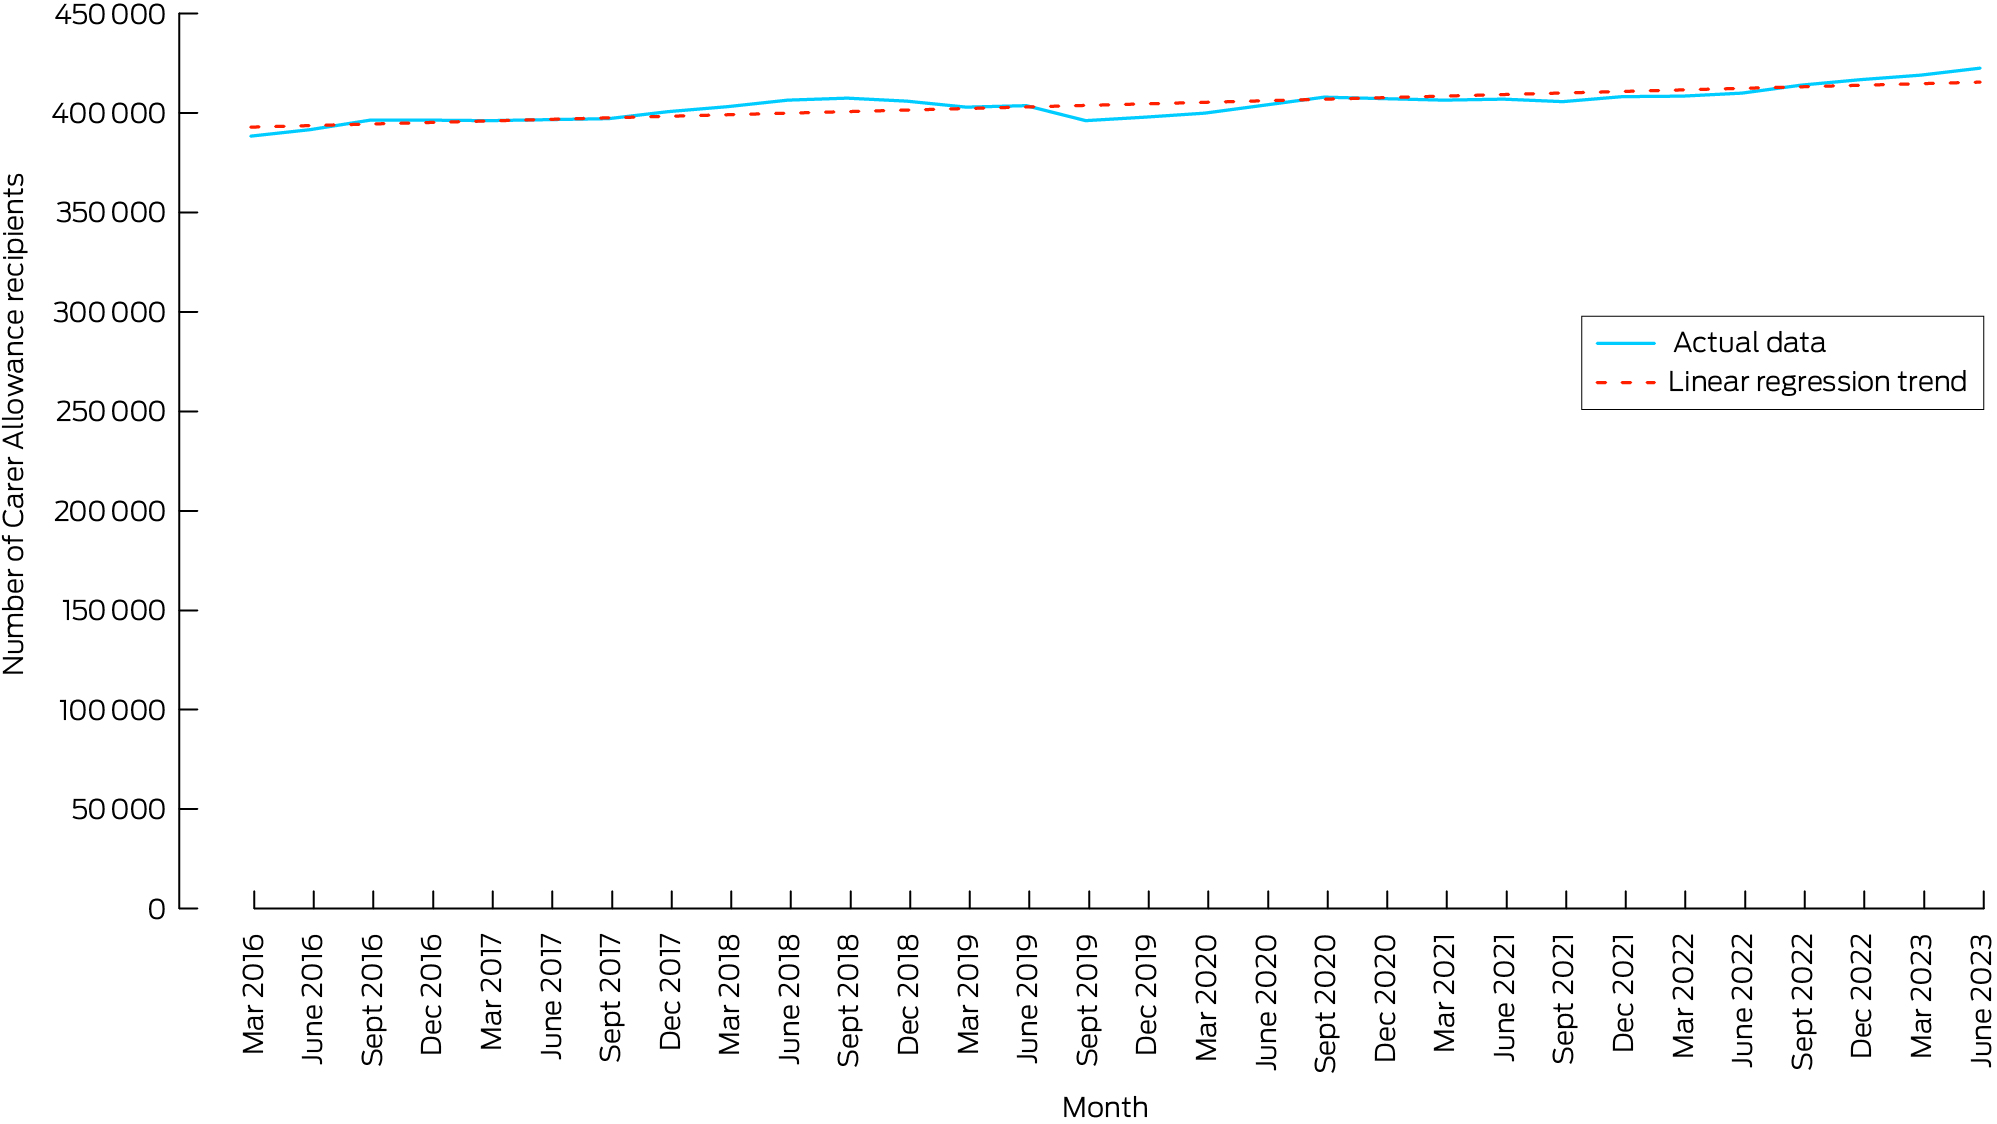
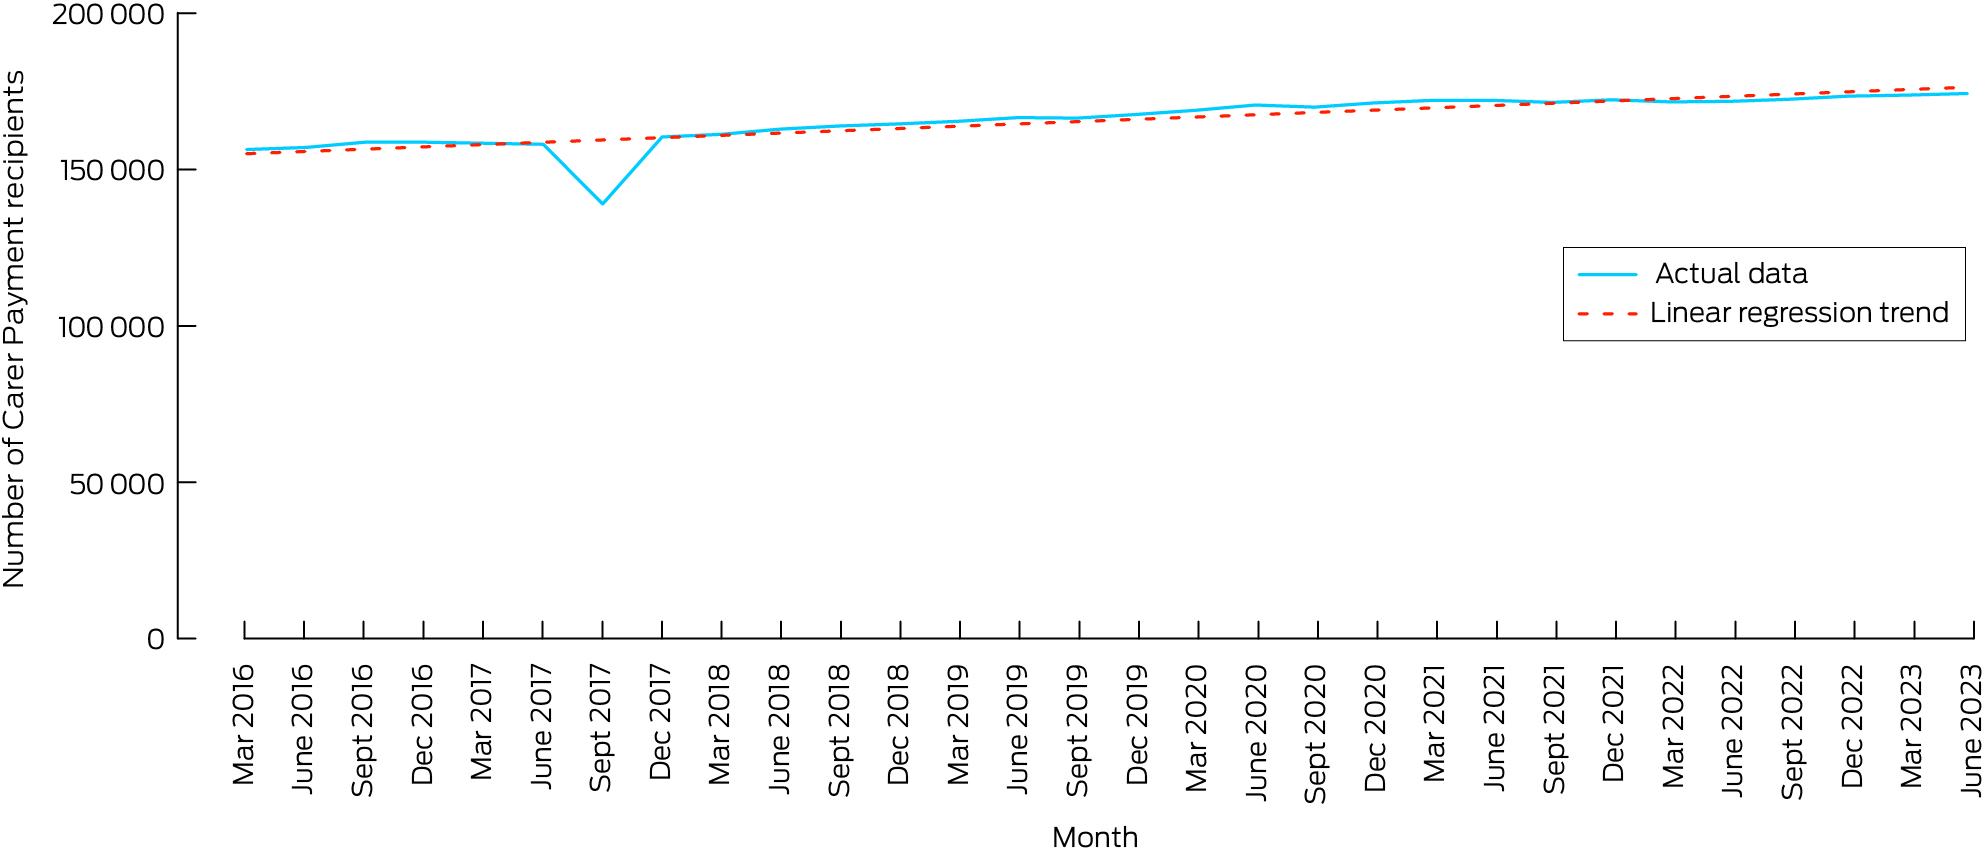
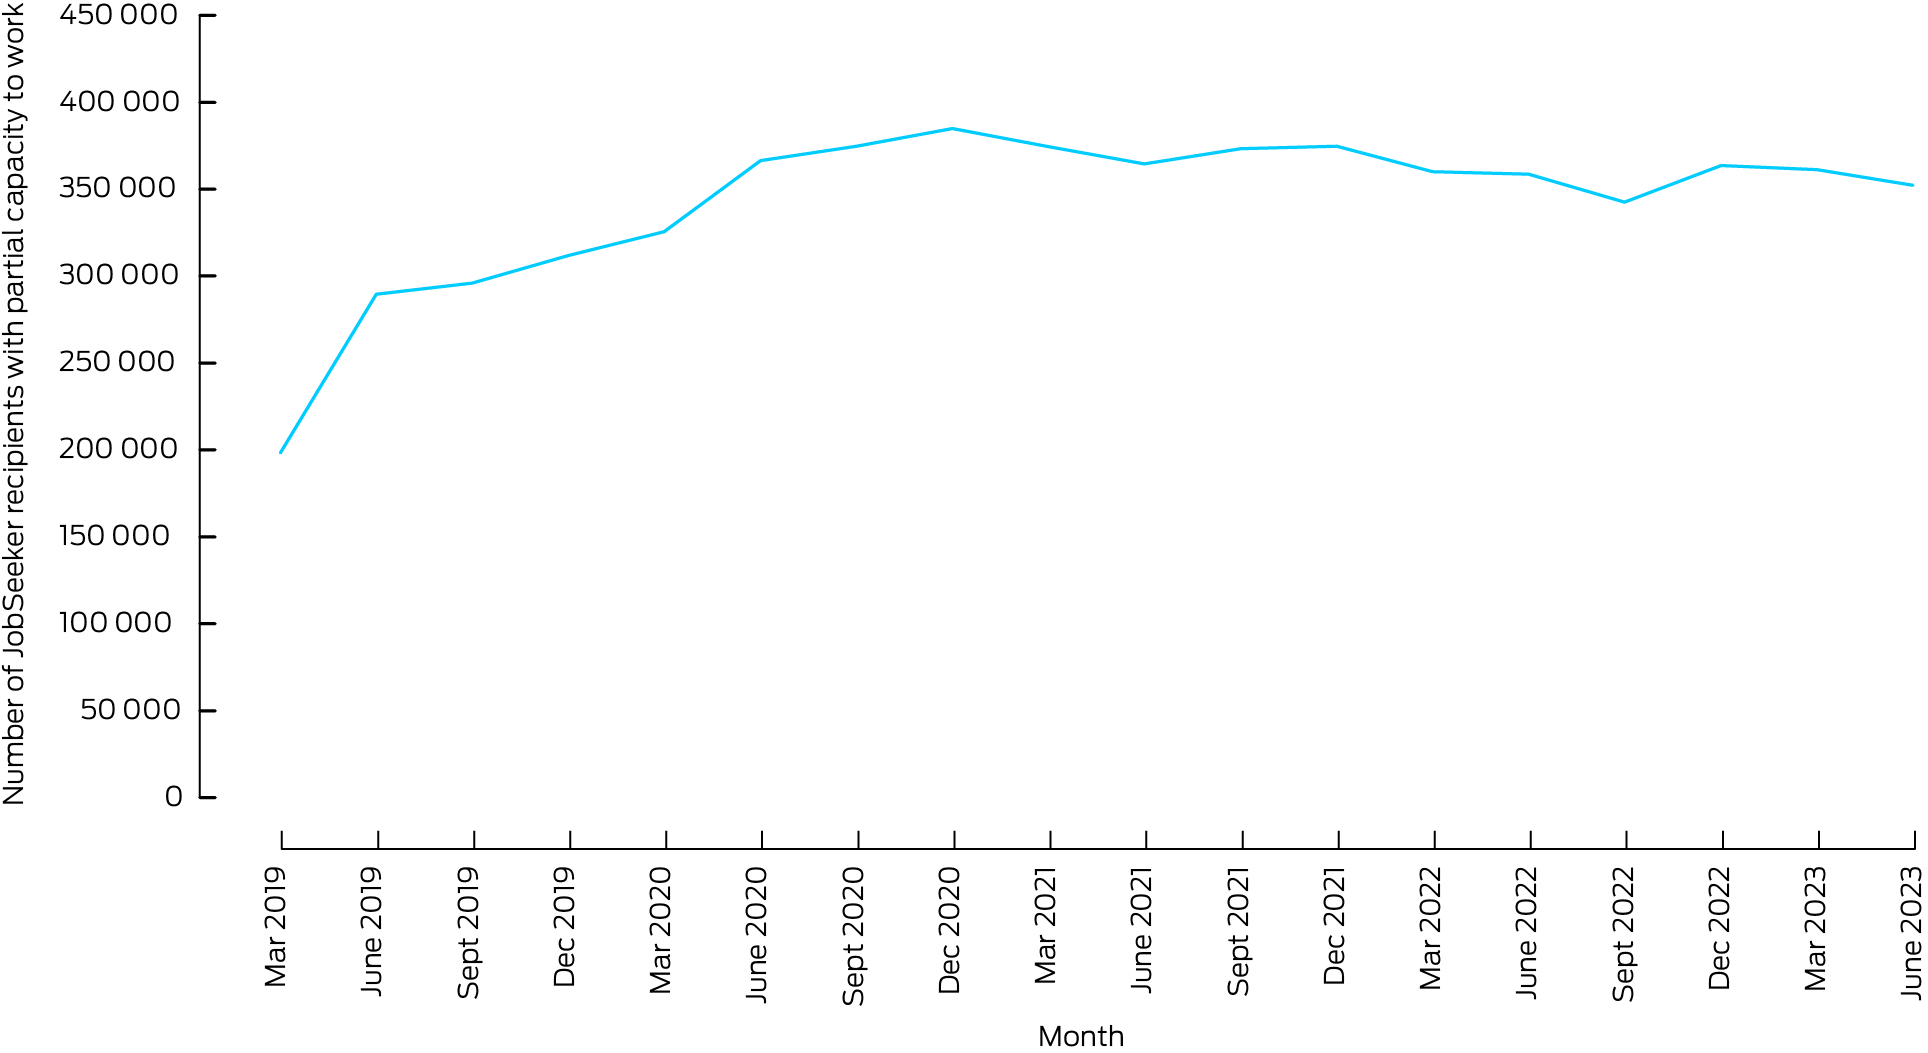
Box 8 and Box 9 show numbers of Carer Allowance recipients and Carer Payment recipients, respectively, caring for persons aged < 65 years, with actual data plotted against a linear regression trend line. While the longer term trend for Carer Allowance is clearly upwards for recipients aged < 65 years, there is some suggestion in these data of an acceleration in the rate of increase from early 2022 to June 2023. The longer term trend for Carer Payments for recipients aged < 65 years is also upwards, but with no deviation from a slow trend of increasing recipient numbers. Finally, the numbers of JobSeeker claimants recording “partial capacity to work” (primarily due to health reasons) have slowly but steadily decreased since 2020 (Box 10).
Discussion
In the absence of ongoing surveillance of long COVID case numbers in Australia, it is not possible to validate our model results against reality. However, Australian studies have provided long COVID prevalence estimates ranging from 4.7% to 18.2%,8,9,10,28 which are consistent with the proportions used in our model.15 This should increase the confidence in our modelled results. It is also possible to compare our results with ABS labour market statistics. Our models estimated that at the end of February 2023, between 21 000 and 76 000 people had severely limiting long COVID (Supporting Information, appendix 3), and ABS data suggest that about 25 000 more people than expected were out of the workforce with a main activity of own long term health condition or disability at this time. Our models also estimated that at the end of March 2023, between 18 600 and 67 000 people had severely limiting long COVID (Supporting Information, appendix 3, table 2), and ABS data suggest that there was an excess of up to 87 000 working age people who did not want to work due to long term sickness or disability at this time.
While the ABS data we used cannot isolate specific causes and measured two different concepts which are not directly comparable, our model outputs for long COVID are broadly compatible with the estimates of excess numbers of people pushed out of the labour force by ill health. It is also important to emphasise that these increased numbers of people out of the workforce due to long term sickness occurred at a time when unemployment was at a historic low, and labour force participation was at a historic high. A tight labour market and inflationary pressures are leading more people to enter or re‐enter the Australian labour force. We also recognise that many people significantly affected by long COVID will not stop working altogether, but respond through a combination of reduced hours and/or flexible working arrangements, so they would not have been represented in the ABS data we used. It is also important to note that the trends we saw in the ABS data may have been due to the effects of COVID‐19 or to a range of other factors. However, we can still see a signal that growing numbers of people have been forced out of the workforce due to illness.
Nonetheless, even if higher rates of non‐participation in the workforce are being driven by long COVID, welfare benefits data do not yet suggest that they are translating into additional Disability Support Pension claims. It is noteworthy that the numbers of Carer Allowance recipients aged < 65 years appear to have grown more rapidly in the 12 months to June 2023 than they did previously, although this increase is of the order of some 20 000 people.
Our analyses have several important limitations. As noted, the true prevalence of long COVID in people following SARS‐CoV‐2 infection is unknown and contested. From late 2022, the completeness of reporting of SARS‐CoV‐2 infections fell away rapidly, which may have led our model to underestimate case numbers. Also, our model was truncated at one year post‐infection, again leading to underestimation if some patients remained sick for longer. Moreover, there are several limitations on the parameters that we used to estimate the number of individuals experiencing long COVID. In particular, accurate data on individuals with COVID‐19 stratified by vaccination status were not available at the time of model development, and evidence on probabilities of developing long COVID is uncertain. However, we relied on the best available evidence.6,10,17,18,20 Another limitation is that our cost estimates rest on the assumption that ME/CFS is a reasonable proxy for severe long COVID, and we acknowledge that long COVID comprises a wider range of symptoms than those seen in ME/CFS. To develop a full estimate of the impact of long COVID on Australian GDP, different techniques would be required (eg, a computable general equilibrium model). However, Australia currently lacks data on the scale and impact of long COVID that would be required to feed such a model. Finally, any apparent changes visible in labour market or welfare benefit statistics cannot be assumed to be causally linked to long COVID, as other factors might also explain them.
Combining our model of long COVID cases with our ME/CFS cost estimates provides important insights on the likely economic burden of severe long COVID. It suggests that the aggregate impact of long COVID has thus far probably been small — a cost of only a fraction of a percentage point of GDP. Our upper estimate of total economic costs of severe long COVID (about $6.3 billion during 2022) is very similar to the baseline estimate generated by MSD, albeit by quite different methods.13 Yet, these estimates highlight starkly that the costs are likely to be very high for the individuals concerned — an annual cost per person of $77 663, set against Australian GDP per capita of $95 555 or net national disposable income per capita of $68 535.24 Notwithstanding today's tight labour market, this suggests that the economic policy imperative for dealing with long COVID is less the condition's aggregate productivity impacts and more the need to ensure that individuals and households do not slip into destitution because of illness.
The new Governor of the Reserve Bank of Australia recently reinforced the expectation of the bank's board that unemployment will rise to 4.5% by late 2024, in the process of reducing inflation to its target level.29 Yet, high employment continues to defy expectations. Our findings indicate that tens of thousands of Australians may have been partially or fully removed from the workforce due to long COVID, potentially providing an additional expectation of the labour market's ongoing tightness, but we lack data from which we can make unambiguous judgements. While some enhancements have been made to improve the frequency of collecting statistics on barriers and incentives to labour force participation that we used in our study,30 these data are still limited and not fully equal to the task of identifying changes in long term illness and disability in the workforce. The continued absence of regular population surveillance to assess the prevalence of long COVID in Australia places us at odds with peer nations such as the UK, the US and Canada. Our results suggest that regular, high quality surveillance data are an essential but lacking ingredient in Australia's policy response to long COVID. They also suggest that optimal surveillance efforts should be targeted towards those who are more seriously affected by this condition, as this is the group that is in most urgent need of support.
Box 1 – Model‐estimated numbers of people in Australia with long COVID of any severity, January 2021 to June 2023
Box 2 – Model‐estimated numbers of people in Australia with long COVID who had significant activity limitations, January 2021 to June 2023
Box 3 – Economic costs of long COVID associated with significant activity limitations
|
|
Mean (95% CI) cost in millions of dollars* |
Extrapolated cost in millions of dollars* |
|||||||||||||
|
|
Model 1 (UK Office for National Statistics) |
Model 2 (US Institute for Health Metrics and Evaluation) |
Model 3 (Australian National University) |
Model 4 (Australian National University) |
|||||||||||
|
|
|||||||||||||||
|
Cumulative |
4565 (3976–5165) |
2391 (751–4874) |
8537 |
8596 |
|||||||||||
|
Jan to Dec 2021 |
16 (16–17) |
5 (2–10) |
31 |
18 |
|||||||||||
|
Jan to Dec 2022 |
3356 (2924–3798) |
1720 (540–3510) |
6276 |
6184 |
|||||||||||
|
Jan to June 2023 |
1193 (1036–1350) |
666 (209–1354) |
2231 |
2393 |
|||||||||||
|
|
|||||||||||||||
|
CI = confidence interval; UK = United Kingdom; US = United States. * In 2021 prices. |
|||||||||||||||
Box 4 – Economic costs of long COVID associated with significant activity limitations as a proportion of Australian gross domestic product
|
|
Mean (95% CI) percentage of gross domestic product |
Extrapolated percentage of gross domestic product* |
|||||||||||||
|
|
Model 1 (UK Office for National Statistics) |
Model 2 (US Institute for Health Metrics and Evaluation) |
Model 3 (Australian National University) |
Model 4 (Australian National University) |
|||||||||||
|
|
|||||||||||||||
|
Cumulative |
0.077% (0.067%–0.087%) |
0.040% (0.013%–0.082%) |
0.144% |
0.145% |
|||||||||||
|
Jan to Dec 2021 |
0.001% (0.001%–0.001%) |
0.000% (0.000%–0.000%) |
0.001% |
0.001% |
|||||||||||
|
Jan to Dec 2022 |
0.137% (0.119%–0.155%) |
0.070% (0.022%–0.143%) |
0.256% |
0.253% |
|||||||||||
|
Jan to June 2023 |
0.093% (0.081%–0.105%) |
0.052% (0.016%–0.105%) |
0.173% |
0.186% |
|||||||||||
|
|
|||||||||||||||
|
CI = confidence interval; UK = United Kingdom; US = United States. |
|||||||||||||||
Box 5 – Excess numbers of people in Australia not wanting to work (aged 18–64 years) with main reason being “long‐term sickness or disability”, based on Australian Bureau of Statistics data, June 2019 to June 202325

Box 6 – Excess number of people in Australia not in the labour force, with main activity being “own long‐term health condition or disability”, based on Australian Bureau of Statistics data, 2015–202326
Received 19 January 2024, accepted 26 August 2024
- Mary Rose Angeles1
- Thi Thu Ngan Dinh2
- Ting Zhao2
- Barbara Graaff2
- Martin Hensher2
- 1 Deakin University, Melbourne, VIC
- 2 University of Tasmania, Hobart, TAS
Open access:
Open access publishing facilitated by University of Tasmania, as part of the Wiley ‐ University of Tasmania agreement via the Council of Australian University Librarians.
Data Sharing:
We confirm that the data supporting the findings of this study are available in the article and its supplementary materials.
No relevant disclosures.
- 1. Davis HE, McCorkell L, Vogel JM, Topol EJ. Long COVID: major findings, mechanisms and recommendations. Nat Rev Microbiol 2023; 21: 133‐146.
- 2. Office for National Statistics (UK). Prevalence of ongoing symptoms following coronavirus (COVID‐19) infection in the UK: 1 April 2021. https://www.ons.gov.uk/peoplepopulationandcommunity/healthandsocialcare/conditionsanddiseases/bulletins/prevalenceofongoingsymptomsfollowingcoronaviruscovid19infectionintheuk/1april2021 (viewed Sep 2022).
- 3. Office for National Statistics. Prevalence of ongoing symptoms following coronavirus (COVID‐19) infection in the UK: 30 March 2023. https://www.ons.gov.uk/peoplepopulationandcommunity/healthandsocialcare/conditionsanddiseases/bulletins/prevalenceofongoingsymptomsfollowingcoronaviruscovid19infectionintheuk/30march2023 (viewed Apr 2023).
- 4. Ford ND, Slaughter D, Edwards D, et al. Long COVID and significant activity limitation among adults, by age — United States, June 1–13, 2022, to June 7–19, 2023. MMWR Morb Mortal Wkly Rep 2023; 72: 866‐870.
- 5. Chen C, Haupert SR, Zimmermann L, et al. Global prevalence of post‐coronavirus disease 2019 (COVID‐19) condition or long COVID: a meta‐analysis and systematic review. J Infect Dis 2022; 226: 1593‐1607.
- 6. Global Burden of Disease Long COVID Collaborators; Wulf Hanson S, Abbafati C, Aerts JG, et al. Estimated global proportions of individuals with persistent fatigue, cognitive, and respiratory symptom clusters following symptomatic COVID‐19 in 2020 and 2021. JAMA 2022; 328: 1604‐1615.
- 7. Office for National Statistics (UK). New‐onset, self‐reported long COVID after coronavirus (COVID‐19) reinfection in the UK: 23 February 2023. https://www.ons.gov.uk/peoplepopulationandcommunity/healthandsocialcare/conditionsanddiseases/bulletins/newonsetselfreportedlongcovidaftercoronaviruscovid19reinfectionintheuk/23february2023 (viewed Apr 2023).
- 8. Woldegiorgis M, Cadby G, Ngeh S, et al. Long COVID in a highly vaccinated but largely unexposed Australian population following the 2022 SARS‐CoV‐2 Omicron wave: a cross‐sectional survey. Med J Aust 2024; 220: 323‐330. https://www.mja.com.au/journal/2024/220/6/long‐covid‐highly‐vaccinated‐largely‐unexposed‐australian‐population‐following
- 9. Liu B, Jayasundara D, Pye V, et al. Whole of population‐based cohort study of recovery time from COVID‐19 in New South Wales Australia. Lancet Reg Health West Pac 2021; 12: 100193.
- 10. Biddle N, Korda R. The experience of COVID‐19 in Australia, including long COVID — evidence from the COVID‐19 Impact Monitoring Survey series, August 2022. Canberra: Australian National University, 2022. https://csrm.cass.anu.edu.au/research/publications/experience‐covid‐19‐australia‐including‐long‐covid‐evidence‐covid‐19‐impact (viewed Sept 2023).
- 11. Reuschke D, Houston D. The impact of long COVID on the UK workforce. Appl Econ Lett 2022; 30: 2510‐2514.
- 12. Cutler DM. The costs of long COVID. JAMA Health Forum 2022; 3: e221809.
- 13. MSD. A neglected burden: the ongoing economic costs of COVID‐19 in Australia. Sydney: MSD, 2023. https://www.msd‐australia.com.au/wp‐content/uploads/sites/19/2023/10/MSD_A‐neglected‐burden_Impact‐of‐COVID‐19‐in‐Australia.pdf (viewed Jan 2024).
- 14. Australian Bureau of Statistics. Labour force, Australia. Canberra: ABS, 2023. https://www.abs.gov.au/statistics/labour/employment‐and‐unemployment/labour‐force‐australia/aug‐2023 (viewed Sept 2023).
- 15. Angeles M, Hensher M. Estimating the current scale and impact of long COVID in Australia. Melbourne: Deakin University, 2022. https://iht.deakin.edu.au/wp‐content/uploads/sites/153/2022/11/LC‐Modelling‐full‐report.pdf (viewed Sept 2023).
- 16. Angeles MR, Wanni Arachchige Dona S, Nguyen HD, et al. Modelling the potential acute and post‐acute burden of COVID‐19 under the Australian border re‐opening plan. BMC Public Health 2022; 22: 757.
- 17. Office for National Statistics (UK). Self‐reported long COVID after infection with the Omicron variant in the UK: 18 July 2022. https://www.ons.gov.uk/peoplepopulationandcommunity/healthandsocialcare/conditionsanddiseases/bulletins/selfreportedlongcovidafterinfectionwiththeomicronvariant/18july2022 (viewed Apr 2023).
- 18. Office for National Statistics (UK). Technical article: updated estimates of the prevalence of post‐acute symptoms among people with coronavirus (COVID‐19) in the UK: 26 April 2020 to 1 August 2021. https://www.ons.gov.uk/peoplepopulationandcommunity/healthandsocialcare/conditionsanddiseases/articles/technicalarticleupdatedestimatesoftheprevalenceofpostacutesymptomsamongpeoplewithcoronaviruscovid19intheuk/26april2020to1august2021 (viewed Sept 2022).
- 19. Mathieu E, Ritchie H, Rodés‐Guirao L, et al. Coronavirus pandemic (COVID‐19). https://ourworldindata.org/coronavirus (viewed Sept 2022).
- 20. NSW Health. NSW respiratory surveillance reports — COVID‐19 and influenza. https://www.health.nsw.gov.au/Infectious/covid‐19/Pages/weekly‐reports.aspx (viewed Apr 2023).
- 21. EpiGear International. Ersatz Version 1.3. Brisbane: EpiGear International, 2016. https://www.epigear.com/index_files/ersatz.html (viewed Oct 2022).
- 22. Zhao T, Cox IA, Ahmad H, et al. The economic burden of myalgic encephalomyelitis/chronic fatigue syndrome in Australia. Aust Health Rev 2023; 47: 707‐715.
- 23. House of Representatives Standing Committee on Health, Aged Care and Sport. Sick and tired: casting a long shadow. Inquiry into long COVID and repeated COVID infections. Canberra: Commonwealth of Australia, 2023. https://www.aph.gov.au/Parliamentary_Business/Committees/House/Health_Aged_Care_and_Sport/LongandrepeatedCOVID/Report (viewed Jan 2024).
- 24. Australian Bureau of Statistics. Australian national accounts: national income, expenditure and product. Canberra: ABS, 2023. https://www.abs.gov.au/statistics/economy/national‐accounts/australian‐national‐accounts‐national‐income‐expenditure‐and‐product/mar‐2023#cite‐window1 (viewed Sept 2023).
- 25. Australian Bureau of Statistics. Barriers and incentives to labour force participation, Australia. Canberra: ABS, 2022. https://www.abs.gov.au/statistics/labour/employment‐and‐unemployment/barriers‐and‐incentives‐labour‐force‐participation‐australia/2020‐21 (viewed Sept 2023).
- 26. Australian Bureau of Statistics. Potential workers. Canberra: Australian Bureau of Statistics, 2023. https://www.abs.gov.au/statistics/labour/employment‐and‐unemployment/potential‐workers/feb‐2023 (viewed Sept 2023).
- 27. Australian Government Department of Social Services. DSS benefit and payment recipient demographics – quarterly data. Canberra: DSS, 2023. https://data.gov.au/data/dataset/dss‐payment‐demographic‐data (viewed Sept 2023).
- 28. Staples LG, Nielssen O, Dear BF, et al. Prevalence and predictors of long COVID in patients accessing a national digital mental health service. Int J Environ Res Public Health 2023; 20: 6756.
- 29. Bullock M. Achieving full employment [speech]. Sydney: Reserve Bank of Australia, 2023. https://www.rba.gov.au/speeches/2023/sp‐dg‐2023‐06‐20.html (viewed Sept 2023).
- 30. Australian Government Treasury. Funding the Australian Bureau of Statistics to better collect data on disadvantage [media release]. Canberra: Australian Government, 2022. https://ministers.treasury.gov.au/ministers/andrew‐leigh‐2022/media‐releases/funding‐australian‐bureau‐statistics‐better‐collect‐data (viewed Sept 2023).


Abstract
Objective: To estimate the potential economic burden of long COVID in Australia.
Design: A stock‐and‐flow model of weekly estimated numbers of people with long COVID (January 2021 to June 2023); application of proxy cost estimates from people living with myalgic encephalomyelitis/chronic fatigue syndrome; time series analysis of labour market and social security datasets.
Setting: The working age Australian population.
Main outcome measures: The likely number of Australians severely impacted by long COVID; the economic cost of long COVID; and the impacts of long COVID, determined by analysis of labour market data.
Results: At its peak in late 2022, between 181 000 and 682 000 Australians may have experienced some long COVID symptoms, of whom 40 000–145 000 may have been severely affected. Severe cases potentially decreased to affecting 10 000–38 000 people by June 2023. The likely economic burden of long COVID in Australia during 2022 was between $1.7 billion and $6.3 billion (some 0.07% to 0.26% of gross domestic product). Labour market data suggest that between 25 000 (February 2023) and 103 000 (June 2023) more working age Australians reported being unable to work due to long term sickness than would have been predicted based on pre‐COVID‐19 trends. This does not appear to have translated into increased claims for Disability Support Pensions, but numbers of working age Carer Allowance recipients have grown markedly since 2022.
Conclusions: Long COVID likely imposed a small but significant aggregate toll on the Australian economy, while exposing tens of thousands of Australians to substantial personal economic hardship and contributing to labour market supply constraints. Yet while some signal from long COVID is discernible in the labour force data, Australia lacks adequate direct surveillance data to securely guide policy making.