


The known: The incidence of type 2 diabetes in Australia began to fall in 2010 in both men and women.
The new: Although the incidence of type 2 diabetes continued to decline among Australian adults during 2010–2019, it increased among people born in Asia, North Africa and the Middle East, and the Pacific Islands from 2011 to 2019.
The implications: As the general decline in type 2 diabetes incidence does not apply to all ethnic groups in Australia, prevention strategies should take differences in diabetes risk into account, including ethnic background and socio‐economic disadvantage.
Type 2 diabetes is a major health problem around the world.1 Incidence is a critical but underused measure of the problem; in contrast to prevalence, it does not rise as mortality falls, and is therefore a more direct measure of population risk. We have previously reported that the incidence of diabetes declined or did not change after 2010 in 19 of 24 data sources (21 countries and jurisdictions), and that it declined in Australia during 2010–2015.2 However, we did not disaggregate data by ethnic background or socio‐economic position, key risk factors for diabetes.
There have been few reports on trends in diabetes incidence by ethnic background. United States reports based on National Health Interview Survey3 and Medicare data4 have described its incidence in Hispanic, non‐Hispanic white, non‐Hispanic black, and non‐Hispanic Asian or Pacific Islanders. Two studies in Canada found changes in diabetes incidence among First Nations people (1986–2003)5 and by Aboriginal status (1995–2007).6 An analysis of Norwegian national registries data determined changes in the incidence of type 2 diabetes by country of birth.7 Two Australian cohort studies8,9 examined the incidence of diabetes by ethnic background, but their modest sample sizes and the likelihood that response rates differed by ethnic group limit the generalisability of their findings. Similar limitations apply to investigation of the influence of socio‐economic position and geographic remoteness on incidence, despite their associations with diabetes.9,10
We therefore analysed National Diabetes Services Scheme (NDSS) data to estimate changes in the incidence of type 2 diabetes in Australia, overall and by age, sex, socio‐economic disadvantage, geographic remoteness, and country of birth. We also examined changes in diabetes diagnostic methods during the study period that may have influenced estimates of type 2 diabetes incidence.
Methods
We analysed NDSS data in a national population‐based study. The NDSS provides subsidised access to diabetes‐related products, and its database includes 80–90% of all Australians with diagnosed diabetes.11,12,13 We included data for all people aged 20 years or older living in the Australian Capital Territory, New South Wales, Queensland, and Victoria registered with the NDSS on 1 January 2005 (about 80% of all people in the NDSS), and all new registrants from these jurisdictions until 31 December 2019. Our report conforms with the Strengthening the reporting of observational studies in epidemiology (STROBE) guidelines.14
Outcome
A person with incident diabetes was defined as one who registered with the NDSS for the first time in a given calendar year. If the registration documents indicated that the onset of diabetes preceded the year of registration, the case was assigned to the earlier year. Diabetes type was based on that recorded by a health care professional at the time of registration and modified by informative clinical characteristics (eg, age at diabetes diagnosis, medication patterns15) (Supporting Information, part 1).
Socio‐economic position and geographic remoteness
NDSS registrants were allocated to Index of Relative Socioeconomic Disadvantage (IRSD) quintiles16 and Australian Statistical Geography Standard remoteness structure17 categories according to their first known postcode. The IRSD ranks areas by relative socio‐economic disadvantage, based on census information. The remoteness structure groups locations into five categories: major city, inner regional, outer regional, remote, and very remote; given the small proportion of NDSS registrants in remote and very remote areas (0.9%), we combined these categories with the outer regional category. Records with missing postcodes (0.8%) were excluded from these analyses.
Country of birth
We used country of birth as a proxy for ethnic background, classified according to the 2016 Standard Australian Classification of Countries,18 and categorised as ten groups that reflect geography and ethnic background (Supporting Information, table 1). The population distribution of the ten groups by 15‐year age group and sex for the four included NDSS jurisdictions were derived from 2011 census data.19 We allocated NDSS registrants without recorded country of birth to incident and prevalent type 2 diabetes according to the frequency distribution of incident and prevalent diabetes for NDSS registrants with recorded country of birth by 15‐year age group and sex.
Medicare Benefits Schedule (MBS) diabetes‐related pathology services
Annual age‐ and sex‐specific service data for biochemistry panel testing (including blood glucose levels: MBS item numbers 66500, 66503, 66506, 66509, 66512, 66515; MBS item 66515 was replaced in 2008 by item 66512), oral glucose tolerance test (MBS item number 66542), and glycated haemoglobin (HbA1c; MBS item numbers 66551 and 66841; the latter item was introduced on 1 November 2014) for the four jurisdictions were obtained from the Services Australia website.20
Statistical analysis
We extracted annual NDSS data for incident type 2 diabetes (the numerator) and prevalent diabetes by sex, 5‐year age group, IRSD quintiles, and the three remoteness categories for the calendar years 2005–2019, and by the ten country of birth groups for the years 2011–2019. The denominator for each subgroup (eg, age group) was calculated for 1 January of each year by subtracting the number of prevalent diabetes cases from the total population for the four jurisdictions; annual population (by age and sex) were obtained from the Australian Bureau of Statistics estimated resident population.21 Population counts by socio‐economic disadvantage quintile16 and remoteness category17 were generated from Australian Bureau of Statistics data.
To model the incidence of type 2 diabetes by age, country of birth, and sex, we used age–period–cohort models (details: Supporting Information, section 2).22 For modelling incidence stratified by socio‐economic disadvantage quintile and remoteness category, we used Poisson regression with a spline effect of time because age‐specific incident counts by socio‐economic disadvantage and remoteness were not available. Analyses were performed in Stata 16. We analysed changes in the incidence of type 2 diabetes and the use of diagnostic tests for diabetes in the general population in Joinpoint 4.9 (National Cancer Institute) (details: Supporting Information, section 3).
Ethics approval
This study was approved by the Alfred Hospital Ethics Committee (project no. 463/18) and the Australian Institute of Health and Welfare Ethics Committee (EO2018/5/501).
Results
During 2005–2019, 741 535 Australian Capital Territory, New South Wales, Queensland, and Victorian people aged 20 years or older with incident type 2 diabetes were registered with the NDSS; 421 190 were men (56.8%) (Box 1; Supporting Information, table 2). The median age at diagnosis was 60.2 years (interquartile range, 50.7 − 69.4 years). The age‐standardised incidence of type 2 diabetes increased during 2005–2010, both among men (annual percentage change [APC], 4.4%; 95% confidence interval [CI], 3.6–5.2%) and women (APC, 2.9%; 95% CI, 2.2–3.7%); it declined during 2010–2019 among both men (APC, –5.2%; 95% CI, –5.4% to –4.9%) and women (APC, –6.5%; 95% CI, –6.8% to –6.2%) (Supporting Information, table 3).
Changes in age‐specific incidence of type 2 diabetes by sex
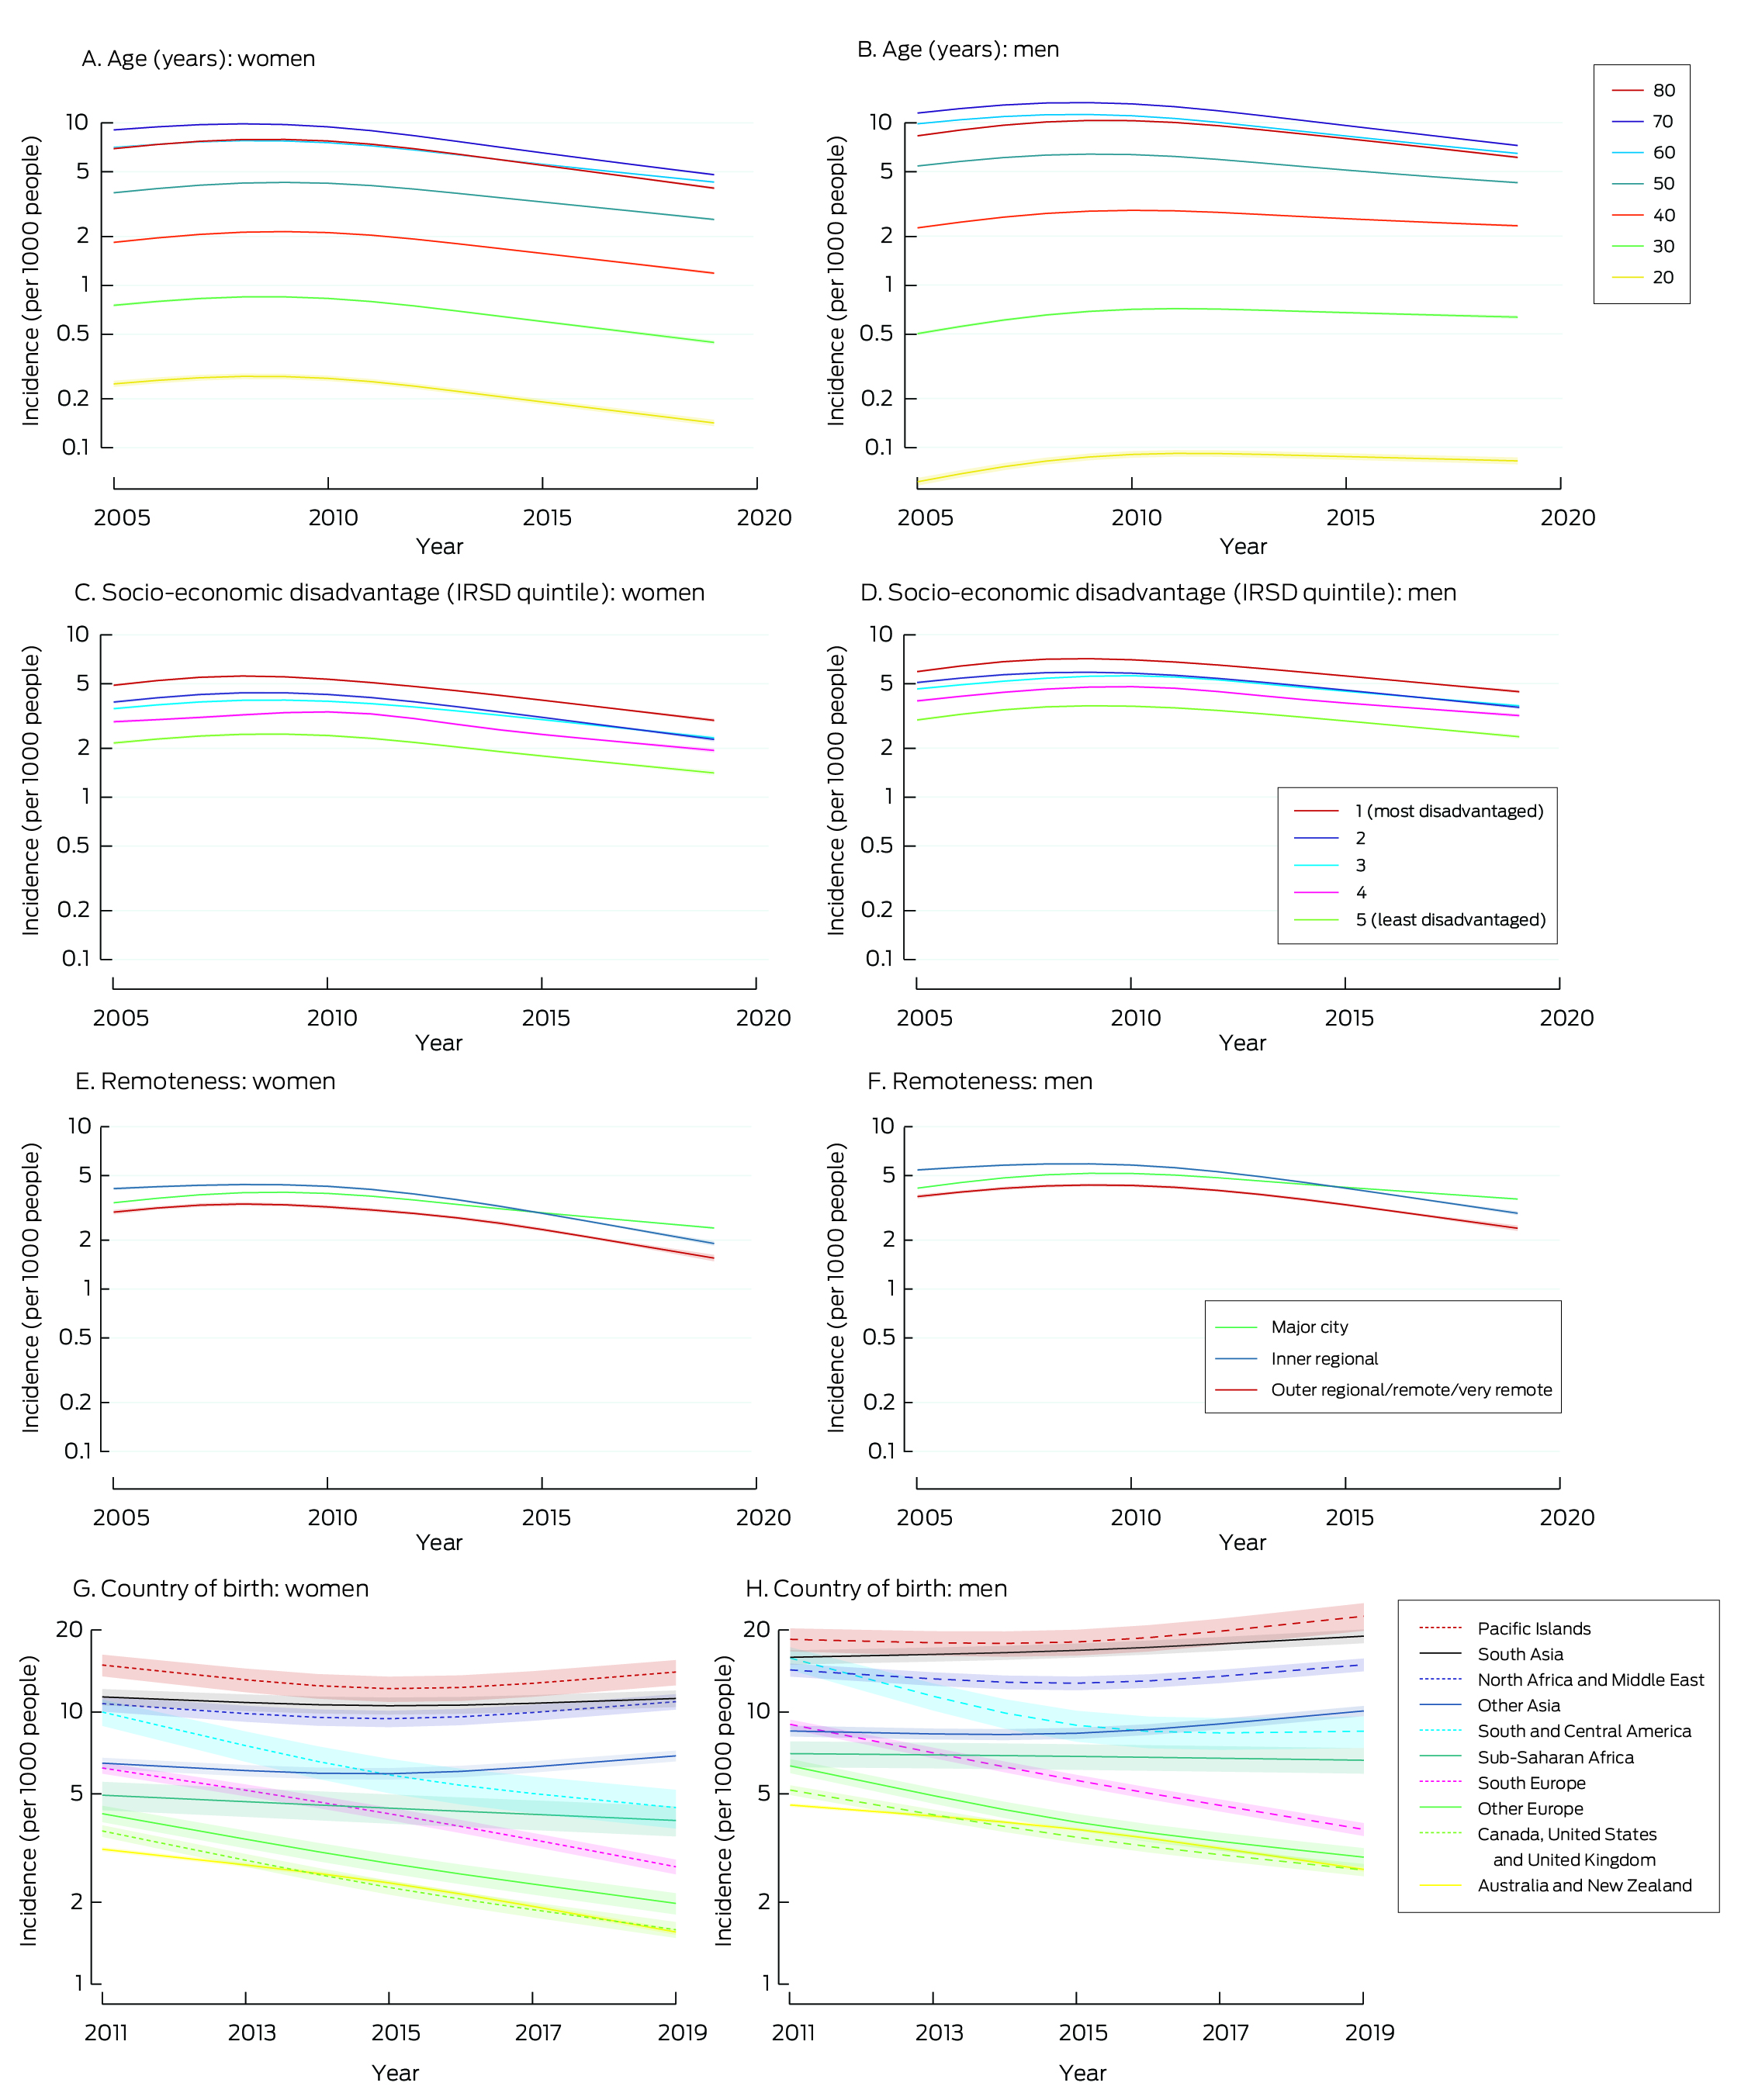
The incidence of type 2 diabetes increased with age (until about age 70 years); in 2012 (middle of the study period) the incidence was 10.5 (95% CI, 10.4–10.6) per 1000 men aged 60 years, 12.4 (95% CI, 12.3–12.5) per 1000 men aged 70 years, and 7.0 (95% CI, 7.0–7.1) per 1000 women aged 60 years, and 8.7 (95% CI, 8.6–8.7) per 1000 women aged 70 years (Box 2).
The incidence of type 2 diabetes increased during 2005–2010 and declined during 2010–2019 in all age groups. The APC for 2010–2019 was smallest for men aged 20 years (–1.1%; 95% CI, –1.4% to –0.8%) and largest for women aged 70 years (–7.4%; 95% CI, –7.6% to –7.1%); it was smaller for men aged 20–40 years (range by age, –1.1% to –2.6%) than for men over 40 years of age (range, –4.5% to –6.4%) and women of any age (range, –5.5% to –7.4%) (Supporting Information, table 3). The incidence of type 2 diabetes was lower in 2019 than 2005 for women in all age groups, and for men more than 40 years of age; it was higher in 2019 than in 2005 for men aged 20–40 years (Box 2).
Changes in incidence of type 2 diabetes by postcode‐level socio‐economic disadvantage and remoteness
The incidence of type 2 diabetes increased with socio‐economic disadvantage for both sexes and in all calendar years. For each IRSD quintile, the incidence increased during 2005–2010 or 2005–2011, and then declined (Box 2). The annual reduction in incidence since 2010 or 2011 was larger for women (range, –5.6% to –6.8%) than for men (–4.6% to –5.2%) (Supporting Information, table 4).
The incidence of type 2 diabetes was higher among people in inner regional areas than among people in major cities or outer regional/remote/very remote areas during 2005–2015; after 2015, incidence was highest among people in major cities (Box 2). For each remoteness category and for both sexes, the incidence increased or did not change during 2005–2010 or 2005–2011, and then declined (Box 2). The APCs for the declines since 2010 or 2011 were smaller for major cities than for inner or outer regional/remote/very remote areas for both sexes (Supporting Information, table 4).
Changes in the incidence of type 2 diabetes by country of birth
The age‐standardised incidence of type 2 diabetes declined during 2011–2019 among men and women born in Australia or New Zealand, other English‐speaking countries, south Europe, other Europe, South and Central America, and sub‐Saharan Africa; it increased during 2011–2019 among South Asian men. Among men and women from other Asia, North Africa and the Middle East, and Pacific Islands and among women from South Asia, the incidence of type 2 diabetes declined during 2011–2015 and rose during 2015–2019 (Box 2; Supporting Information, table 5).
Changes in proportions of people tested for diabetes
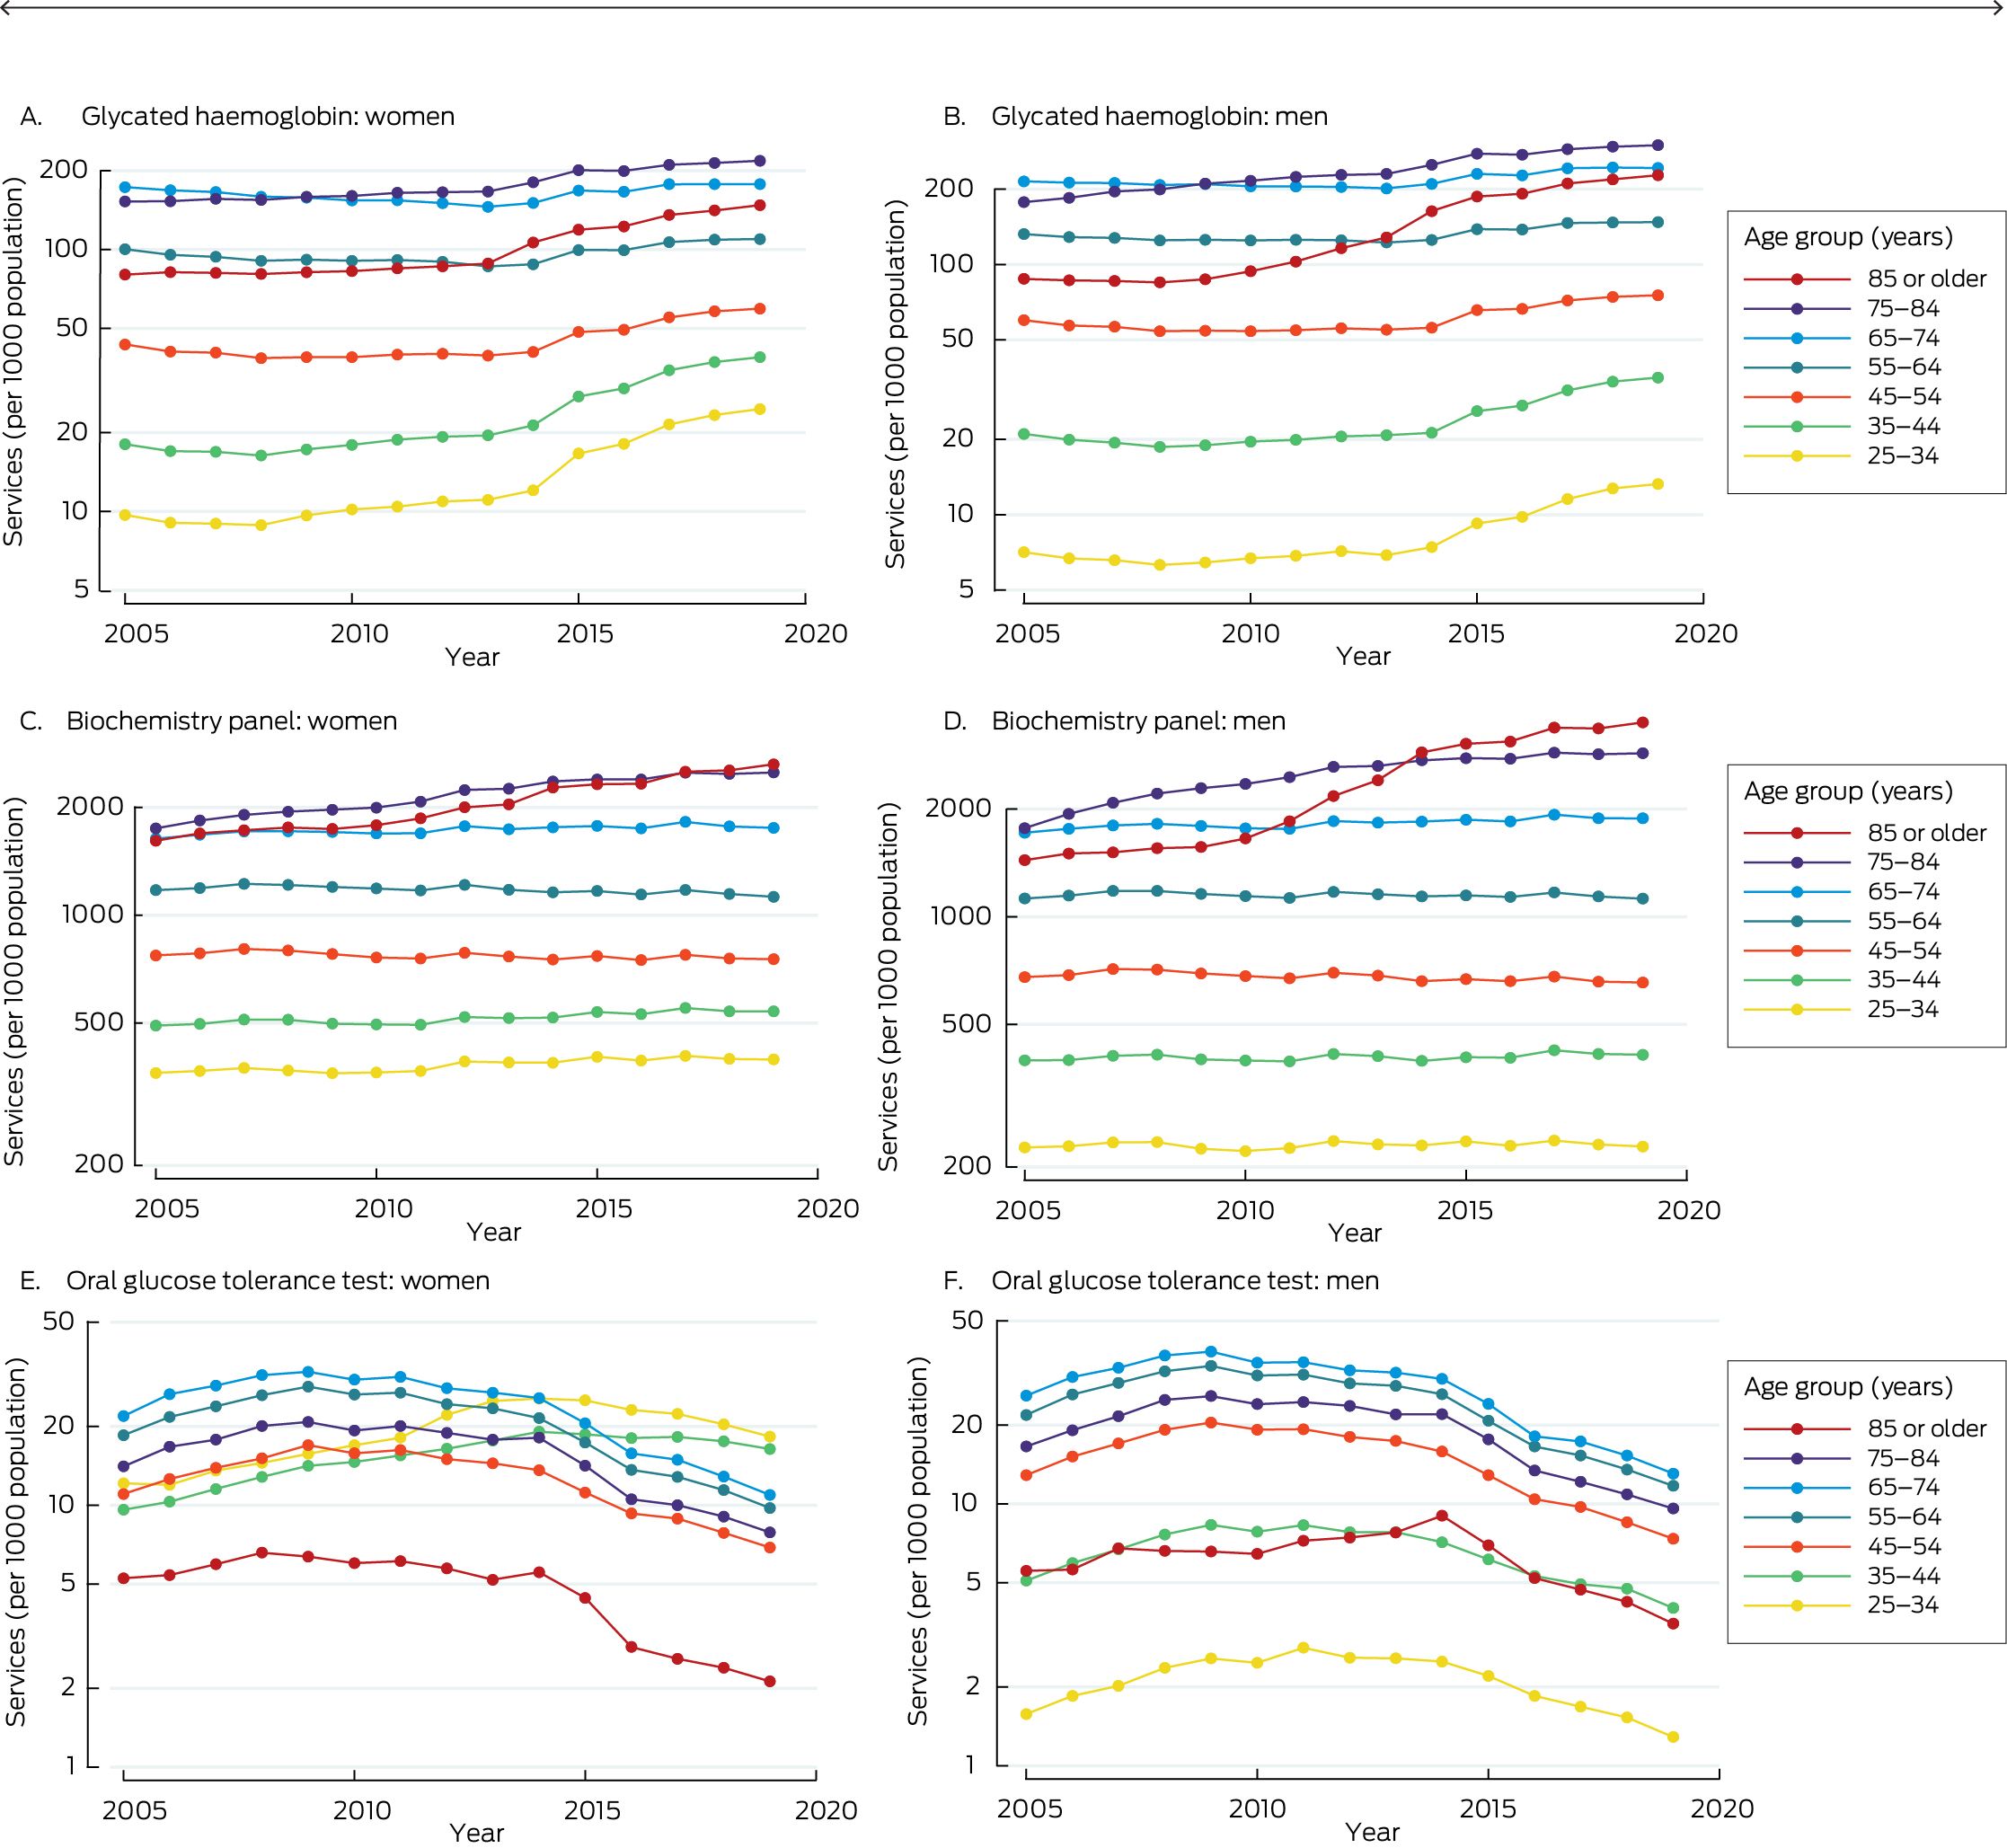
The proportion of people for whom biochemistry panel testing was undertaken did not change or rose in most age groups during 2005–2019 (exceptions: small declines for men aged 45–54 years and women aged 45–64 years). The proportion of people who undertook oral glucose tolerance tests increased or did not change from 2005 to 2011–2014 for all age groups, then declined; the proportion of people who underwent oral glucose tolerance tests was smaller in 2019 than in 2005 for all age groups, except women aged 25–44 years, for whom the proportion was larger in 2019. The proportion of people in whom HbA1c levels were assessed did not change for most age groups from 2005 to 2008–2013 (exceptions: small increases for men and women aged 75–84 years; small declines for women aged 55–74 years), then increased for all age groups (Box 3; Supporting Information, table 6).
Discussion
Our analysis of data for Australian Capital Territory, New South Wales, Queensland, and Victorian people in a population‐based register of people with diabetes yielded three major findings. First, the incidence of type 2 diabetes among people aged 20 years or older increased between 2005 and 2010–2011, then declined, both overall and in groups defined by age, sex, socio‐demographic disadvantage, or geographic remoteness. Second, despite the decline during 2010–2019 among men aged 40 years or younger, the incidence of type 2 diabetes was still higher in this group in 2019 than in 2005. Third, the incidence of type 2 diabetes increased during 2011–2019 among people born in Asia, North Africa and the Middle East, and the Pacific Islands.
The decline in type 2 diabetes incidence we found is similar to that reported for a number of other high income countries.2 Several factors could explain this decline. First, diabetes prevention strategies may have led to behavioural and environmental changes sufficient to influence the incidence of diagnosed diabetes; for example, the consumption of sugar‐sweetened beverages in Australia is reported to have declined.23 Second, the estimated incidence may be influenced by the shift from oral glucose tolerance testing to HbA1c assessment for diabetes screening. In Australia, HbA1c testing was recommended as a diagnostic test in 2012,24 and its use has increased since 2014.10 HbA1c testing identifies fewer people with diabetes than oral glucose tolerance testing,25 but its sensitivity is similar to that of fasting plasma glucose assessment.26 Further, the start of the decline in type 2 diabetes incidence in Australia (2010–2011) preceded both the formal adoption of HbA1c assessment as a diagnostic test in 201527 and its rising use since 2014, and similar declines in incidence have also been reported in countries where HbA1c assessment is not used for diagnosis.2 Moreover, the MBS‐subsidised biochemistry panel testing rate, which includes fasting plasma glucose assessment, remained fairly constant during 2005–2019. As it includes targets other than glucose, it is uncertain whether changes in biochemistry panel testing accurately reflect changes in screening with fasting plasma glucose. The decline in oral glucose tolerance testing coincided with that of diabetes incidence, but this test accounts for only a very small proportion of diabetes diagnostic tests undertaken. Overall, it seems unlikely that changes in screening practices fully explain the decline in diabetes incidence.
A decline in the incidence of type 2 diabetes since 2010–2011 in Australia is consistent with recent reports that it is steady or declining in many high income countries,1,2 but increasing in low and middle income countries, such as India28 and Ukraine.2 The incidence of diagnosed type 2 diabetes declined significantly in Norway between 2009 and 2014, except for people born in Africa; lower educational attainment and being born in Asia, Africa, or South America were found to be significant risk factors for incident type 2 diabetes.7 Our findings suggest that type 2 diabetes incidence has increased in Australia among those born in Asia, North Africa and the Middle East, and the Pacific Islands in recent years, consistent with the substantial increases in diabetes prevalence in the Pacific Islands, the Middle East, and South Asia.1
Limitations
First, physicians may misclassify the type of diabetes diagnosed, influencing the data we analysed, despite re‐classification on the basis of age at diabetes onset and medication patterns.14 Since fewer than 10% of people with diabetes have type 1 diabetes, and the proportion of incident type 1 diabetes cases in adults is even smaller, the number of people with misclassified diabetes type was probably very small. Second, the NDSS does not include people with undiagnosed diabetes, or an estimated one in five Australians with diabetes;29 we have therefore described changes only in the incidence of clinically diagnosed type 2 diabetes. Third, the NDSS is a voluntary scheme that may not capture data for all people with diagnosed diabetes; however, two studies have suggested that the NDSS captures data on more than 87% of people with diagnosed diabetes,12,13 and changes in incidence among people not registered with NDSS would need to be remarkably different from those we found to affect our NDSS‐based findings. Fourth, country of birth information was missing for 14.8% of NDSS registrants with incident diabetes. The language spoken at home is an alternative measure of ethnic background, but was available for only 0.02% of people with missing country of birth information (data not shown). We therefore allocated people with incident or prevalent type 2 diabetes and unknown country of birth to the ten country groups according to the distribution of those with known country of birth. We did not specifically examine diabetes incidence among Aboriginal and Torres Strait Islander people, as Indigenous Australians have access to services from other programs, and are consequently less likely to register with the NDSS. Fifth, our measure of socio‐economic disadvantage was postcode‐based, perhaps leading to some misclassification, as the social circumstances of people can vary within a postcode. However, while the various available measures of socio‐economic position are not always correlated, each is important.30 Sixth, the reliability of allocation of HbA1c tests to MBS item numbers for diagnosis or for clinical management of established diabetes is limited, as the information available to pathology providers who allocate item numbers is often limited; we therefore needed to combine MBS data for diagnostic and for management HbA1c tests in our analysis. Finally, NDSS data were available only to 2019; the incidence of type 2 diabetes may have changed after the coronavirus disease 2019 pandemic.
Conclusion
The annual incidence of clinically diagnosed type 2 diabetes declined in Australia from 2010–2011 to 2019 in most population groups, but increased among people born in Asia, North Africa and the Middle East, and Pacific Islands. As in 2023 more than 30% of the Australian population were born overseas,31 we need multifaceted approaches for preventing type 2 diabetes that take into account differences in the risk of developing diabetes, particularly among people with culturally and linguistically diverse backgrounds.
Box 1 – Incidence of type 2 diabetes among people aged 20 years or older in the Australian Capital Territory, New South Wales, Queensland, and Victoria, 2005–2019, by sex, age group, postcode‐based socio‐economic disadvantage and remoteness, and country of birth
|
|
Men |
Women |
|||||||||||||
|
Characteristic |
Number of cases |
Annual incidence (per 1000 men) |
Number |
Annual incidence (per 1000 women) |
|||||||||||
|
|
|||||||||||||||
|
All incident diabetes |
421 190 |
4.55 |
320 345 |
3.30 |
|||||||||||
|
Age group (years) |
|
|
|
|
|||||||||||
|
20–29 |
4809 (1.1%) |
0.25 |
7110 (2.2%) |
0.37 |
|||||||||||
|
30–39 |
27 001 (6.4%) |
1.43 |
22 572 (7.0%) |
1.18 |
|||||||||||
|
40–49 |
69 172 (16.4%) |
3.90 |
43 259 (13.5%) |
2.37 |
|||||||||||
|
50–59 |
111 976 (26.6%) |
7.30 |
79 785 (24.9%) |
4.98 |
|||||||||||
|
60–69 |
116 849 (27.7%) |
10.48 |
84 183 (26.3%) |
7.06 |
|||||||||||
|
70–79 |
67 671 (16.1%) |
10.43 |
55 774 (17.4%) |
7.54 |
|||||||||||
|
80 or older |
23 712 (5.6%) |
7.02 |
27 662 (8.6%) |
5.11 |
|||||||||||
|
Socio‐economic disadvantage (IRSD quintile)* |
|
|
|
|
|||||||||||
|
1 (most disadvantaged) |
107 859 (25.8%) |
5.92 |
87 350 (27.5%) |
4.58 |
|||||||||||
|
2 |
89 286 (21.4%) |
4.90 |
69 179 (21.7%) |
3.61 |
|||||||||||
|
3 |
87 537 (21.0%) |
4.71 |
65 914 (20.7%) |
3.38 |
|||||||||||
|
4 |
74 906 (17.9%) |
4.01 |
54 871 (17.3%) |
2.80 |
|||||||||||
|
5 (least disadvantaged) |
58 206 (13.9%) |
3.08 |
40 767 (12.8%) |
2.05 |
|||||||||||
|
Remoteness (ARIA+)* |
|
|
|
|
|||||||||||
|
Major city |
297 148 (71.1%) |
4.54 |
226 811 (71.3%) |
3.30 |
|||||||||||
|
Inner regional |
83 632 (20.0%) |
4.90 |
63 123 (19.8%) |
3.51 |
|||||||||||
|
Outer regional, remote or very remote |
37 014 (8.9%) |
3.69 |
28 147 (8.8%) |
2.68 |
|||||||||||
|
Country of birth (2011–2019)† |
|
|
|
|
|||||||||||
|
Australia or New Zealand |
140 384 (55.6%) |
3.37 |
99 776 (53.9%) |
2.28 |
|||||||||||
|
Other English‐speaking countries‡ |
17 574 (7.0%) |
4.49 |
11 622 (6.3%) |
3.04 |
|||||||||||
|
South Europe |
20 800 (8.2%) |
9.53 |
16 366 (8.8%) |
7.43 |
|||||||||||
|
Other Europe |
8741 (3.5%) |
6.01 |
6654 (3.6%) |
4.06 |
|||||||||||
|
Other Asia |
23 104 (9.2%) |
5.46 |
21 897 (11.8%) |
3.95 |
|||||||||||
|
South Asia |
16 332 (6.5%) |
8.28 |
9575 (5.2%) |
6.28 |
|||||||||||
|
South and Central America |
2878 (1.1%) |
7.04 |
2230 (1.2%) |
4.91 |
|||||||||||
|
North Africa and the Middle East |
12 970 (5.1%) |
10.79 |
9079 (4.9%) |
8.29 |
|||||||||||
|
Sub‐Saharan Africa |
3995 (1.6%) |
5.20 |
2815 (1.5%) |
3.59 |
|||||||||||
|
Pacific Islands |
5671 (2.2%) |
12.53 |
5119 (2.8%) |
9.94 |
|||||||||||
|
|
|||||||||||||||
|
ARIA+ = Accessibility and Remoteness Index of Australia; IRSD = Index of Relative Socioeconomic Disadvantage. * Postcodes were not available for 3396 men (0.8%) and 2264 women (0.8%) with incident type 2 diabetes. † Country of birth was not available for 36 196 men (14.4%) and 28 460 women (15.4%) with incident type 2 diabetes during 2011–2019. ‡ Ireland, the United Kingdom, the United States, and Canada. |
|||||||||||||||
Received 10 July 2023, accepted 31 January 2024
- Dianna J Magliano1,2
- Lei Chen1
- Jedidiah I Morton1,3
- Oyunchimeg Buyadaa2
- Agus Salim1,4
- Jonathan E Shaw1,2
- 1 Baker Heart and Diabetes Institute, Melbourne, VIC
- 2 Monash University, Melbourne, VIC
- 3 Centre for Medicine Use and Safety, Monash University, Melbourne, VIC
- 4 Melbourne School of Population and Global Health, the University of Melbourne, Melbourne, VIC
Open access:
Open access publishing facilitated by Monash University, as part of the Wiley ‐ Monash University agreement via the Council of Australian University Librarians.
Data Sharing:
Aggregated NDSS data may be made available upon reasonable request to the corresponding author. Limitations on use of the data may apply, subject to approval from the data custodians.
We analysed data from the National Diabetes Services Scheme (NDSS), an initiative of the Australian government administered by Diabetes Australia. Dianna J Magliano (APP2016668) and Jonathan E Shaw (APP1173952) are supported by National Health and Medical Research Council Investigator Grants. The study was partially supported by a Diabetes Australia Research Program grant and the Operational Infrastructure Support Program of the Victorian government, which had no role in study design, data collection, data analysis, data interpretation, or writing of the report.
Jonathan E Shaw has received consultancy fees from AstraZeneca, Sanofi, Novo Nordisk, Eli Lilly, Mylan, Pfizer, Roche, and Abbott. He has also received payments and honoraria for lectures, presentations, speakers’ bureaus, manuscript writing, and educational events from AstraZeneca, Mylan, Boehringer Ingelheim, Roche, Zuellig, and Eli Lilly.
- 1. Sun H, Saeedi P, Karuranga S, et al. IDF Diabetes Atlas: global, regional and country‐level diabetes prevalence estimates for 2021 and projections for 2045. Diabetes Res Clin Pract 2022; 183: 109119.
- 2. Magliano DJ, Chen L, Islam RM, et al. Trends in the incidence of diagnosed diabetes: a multicountry analysis of aggregate data from 22 million diagnoses in high‐income and middle‐income settings. Lancet Diabetes Endocrinol 2021; 9: 203‐211.
- 3. Benoit SR, Hora I, Albright AL, Gregg EW. New directions in incidence and prevalence of diagnosed diabetes in the USA. BMJ Open Diabetes Res Care 2019; 7: e000657.
- 4. Andes LJ, Li Y, Srinivasan M, et al. Diabetes prevalence and incidence among Medicare beneficiaries, United States, 2001–2015. MMWR Morb Mortal Wkly Rep 2019; 68: 961‐966.
- 5. Horn OK, Jacobs‐Whyte H, Ing A, et al. Incidence and prevalence of type 2 diabetes in the First Nation community of Kahnawá:ke, Quebec, Canada, 1986–2003. Can J Public Health 2007; 98: 438‐443.
- 6. Oster RT, Johnson JA, Hemmelgarn BR, et al. Recent epidemiologic trends of diabetes mellitus among status Aboriginal adults. CMAJ 2011; 183: E803‐E808.
- 7. Ruiz PLD, Stene LC, Bakken IJ, et al. Decreasing incidence of pharmacologically and non‐pharmacologically treated type 2 diabetes in Norway: a nationwide study. Diabetologia 2018; 61: 2310‐2318.
- 8. Chen L, Magliano DJ, Balkau B, et al. AUSDRISK: an Australian Type 2 Diabetes Risk Assessment Tool based on demographic, lifestyle and simple anthropometric measures. Med J Aust 2010; 192: 197‐202. https://www.mja.com.au/journal/2010/192/4/ausdrisk‐australian‐type‐2‐diabetes‐risk‐assessment‐tool‐based‐demographic
- 9. Zhang H, Rogers K, Sukkar L, et al. Prevalence, incidence and risk factors of diabetes in Australian adults aged ≥45 years: A cohort study using linked routinely‐collected data. J Clin Transl Endocrinol 2020; 22: 100240.
- 10. Australian Institute of Health and Welfare. Diabetes: Australian facts (cat. no. CVD 96). Updated 17 June 2024. https://www.aihw.gov.au/reports/diabetes/diabetes/contents/about (viewed Sept 2024).
- 11. Australian Institute of Health and Welfare. Diabetes prevalence in Australia: an assessment of national data sources (Diabetes series no. 12; cat. no. CVD 46). 13 Oct 2009. https://www.aihw.gov.au/reports/diabetes/diabetes‐prevalence‐australia‐assessment/summary (viewed June 2024).
- 12. Davis WA, Peters KE, Makepeace A, et al. Prevalence of diabetes in Australia: insights from the Fremantle Diabetes Study Phase II. Intern Med J 2018; 48: 803‐809.
- 13. Australian National Diabetes Audit. Annual report 2022 (report no. 15). Monash University, Jan 2023. https://www.monash.edu/__data/assets/pdf_file/0003/3218205/anda‐2022‐final‐annual‐report.pdf (viewed Nov 2023).
- 14. von Elm E, Altman DG, Egger M, et al. Strengthening the Reporting of Observational Studies in Epidemiology (STROBE) statement: guidelines for reporting observational studies. BMJ 2007; 335: 806‐808.
- 15. Morton JI, Lazzarini PA, Shaw JE, Magliano DJ. Trends in the incidence of hospitalization for major diabetes‐related complications in people with type 1 and type 2 diabetes in Australia, 2010–2019. Diabetes Care 2022; 45: 789‐797.
- 16. Australian Bureau of Statistics. Postal area, indexes, SEIFA 2011. In: Census of population and housing: Socio‐economic indexes for areas (SEIFA), Australia, 2011 (2033.0.55.001). 28 Mar 2013. https://www.abs.gov.au/ausstats/abs@.nsf/detailspage/2033.0.55.0012011 (viewed Nov 2022).
- 17. Australian Bureau of Statistics. Correspondence, 2017 postcode to 2016 remoteness area. In: Australian Statistical Geography Standard (ASGS): volume 5. Remoteness structure, July 2016 (1270.0.55.005). 16 Mar 2018. https://www.abs.gov.au/AUSSTATS/abs@.nsf/DetailsPage/1270.0.55.005July%202016?OpenDocument (viewed Nov 2022).
- 18. Australian Bureau of Statistics. Standard Australian Classification of Countries (SACC), 2016. 27 June 2016. https://www.abs.gov.au/statistics/classifications/standard‐australian‐classification‐countries‐sacc/latest‐release (viewed Nov 2022).
- 19. Australian Bureau of Statistics. Estimated resident population, country of birth, state/territory, age and sex — as at 30 June Census years only — 1996 onwards. https://explore.data.abs.gov.au/vis?tm=estimated%20resident%20population%20by%20country%20of%20birth&pg=0&hc[dimensions]=Country%20of%20Birth&hc[People]=Population%20%3E%20Estimated%20Resident%20Population&df[ds]=PEOPLE_TOPICS&df[id]=ABS_ERP_COB_STATE&df[ag]=ABS&df[vs]=1.0.0&pd=1996%2C&dq=TOT.3..AUS.A&ly[cl]=TIME_PERIOD&ly[rw]=COUNTRY_BIRTH (viewed Nov 2022).
- 20. Services Australia. Medicare item reports. http://medicarestatistics.humanservices.gov.au/statistics/mbs_item.jsp (viewed June 2023).
- 21. Australian Bureau of Statistics. National, state and territory population, September 2022. 16 Mar 2023. https://www.abs.gov.au/statistics/people/population/national‐state‐and‐territory‐population/sep‐2022 (viewed May 2023).
- 22. Carstensen B. Age–period–cohort models for the Lexis diagram. Stat Med 2007; 26: 3018‐3045.
- 23. Brand‐Miller JC, Barclay AW. Declining consumption of added sugars and sugar‐sweetened beverages in Australia: a challenge for obesity prevention. Am J Clin Nutr 2017; 105: 854‐863.
- 24. d'Emden MC, Shaw JE, Colman PG, et al. The role of HbA1c in the diagnosis of diabetes mellitus in Australia. Med J Aust 2012; 197: 220‐221. https://www.mja.com.au/journal/2012/197/4/role‐hba1c‐diagnosis‐diabetes‐mellitus‐australia
- 25. International Expert Committee. International Expert Committee report on the role of the A1C assay in the diagnosis of diabetes. Diabetes Care 2009; 32: 1327‐1334.
- 26. NCD Risk Factor Collaboration (NCD‐RisC). Effects of diabetes definition on global surveillance of diabetes prevalence and diagnosis: a pooled analysis of 96 population‐based studies with 331 288 participants. Lancet Diabetes Endocrinol 2015; 3: 624‐637.
- 27. d'Emden MC, Shaw JE, Jones GR, et al. Guidance concerning the use of glycated haemoglobin (HbA1c) for the diagnosis of diabetes mellitus. Med J Aust 2015; 203: 89‐90. https://www.mja.com.au/journal/2015/203/2/guidance‐concerning‐use‐glycated‐haemoglobin‐hba1c‐diagnosis‐diabetes‐mellitus
- 28. Jha RP, Shri N, Patel P, et al. Trends in the diabetes incidence and mortality in India from 1990 to 2019: a joinpoint and age‐period‐cohort analysis. J Diabetes Metab Disord 2021; 20: 1725‐1740.
- 29. Australian Bureau of Statistics. Australian Health Survey: Biomedical results for chronic diseases, 2011–2012. 5 Aug 2013. https://www.abs.gov.au/statistics/health/health‐conditions‐and‐risks/australian‐health‐survey‐biomedical‐results‐chronic‐diseases/latest‐release (viewed Nov 2023).
- 30. Buajitti E, Chiodo S, Rosella LC. Agreement between area‐ and individual‐level income measures in a population‐based cohort: implications for population health research. SSM Popul Health 2020; 10: 100553.
- 31. Australian Bureau of Statistics. Australia's population by country of birth, June 2023. 24 Apr 2024. https://www.abs.gov.au/statistics/people/population/australias‐population‐country‐birth/latest‐release (viewed Sept 2024).
Abstract
Objectives: To estimate changes in the incidence of clinically diagnosed type 2 diabetes in Australia, overall and by age, sex, socio‐economic disadvantage, geographic remoteness, and country of birth.
Study design: Population‐based study; analysis of National Diabetes Services Scheme (NDSS) data (age–period–cohort models).
Setting, participants: Data were extracted for incident cases of type 2 diabetes, 1 January 2005 to 31 December 2019, in residents of the Australian Capital Territory, New South Wales, Queensland, and Victoria aged 20 years or older registered with the NDSS. The numbers of people at risk were obtained from the Australian Bureau of Statistics.
Main outcome measures: Changes in the incidence of type 2 diabetes, 2005–2019, by age, postcode‐level socio‐economic disadvantage (Index of Relative Socioeconomic Disadvantage) and remoteness (major city, inner regional, outer regional/remote/very remote), and country of birth, stratified by sex.
Results: During 2005–2019, 741 535 people aged 20 years or older with incident type 2 diabetes were registered with the NDSS; 421 190 were men (56.8%). Overall, the incidence of type 2 diabetes increased with age (until about age 70 years) and socio‐economic disadvantage for both sexes; it was higher in inner regional areas than in major cities or outer regional/remote/very remote areas during 2005–2015, but highest among people in major cities after 2015. The age‐standardised incidence of type 2 diabetes increased during 2005–2010, both among men (annual percentage change [APC], 4.4%; 95% confidence interval [CI], 3.6–5.2%) and women (APC, 2.9%; 95% CI, 2.2–3.7%); it declined during 2010–2019 among both men (APC, –5.2%; 95% CI, –5.4% to –4.9%) and women (APC, –6.5%; 95% CI, –6.8% to –6.2%). In general, similar patterns (but of differing magnitude) applied to all age, sex, socio‐economic disadvantage, and remoteness groups. However, the incidence of type 2 diabetes increased during 2011–2019 among people born in Asia, North Africa and the Middle East, and the Pacific Islands.
Conclusions: The incidence of type 2 diabetes in Australian adults declined during 2010–2019 across all age, sex, socio‐economic disadvantage, and remoteness groups, but increased among people from Asia, North Africa and the Middle East, and the Pacific Islands.