


The known: Breathlessness is associated with greater health care use, poorer quality of life, and increased risk of death.
The new: In a national survey of Australian adults, clinically important breathlessness was associated with greater health care use, reduced likelihood of being employed, and higher societal economic costs. Breathlessness is estimated to cost $12.2 billion in societal costs per year in Australia.
The implications: Improving quality of life for people with breathlessness is important, including for people without formal diagnoses of respiratory disease. Improving timely access to care and alleviating breathlessness early could support their ability to work, thereby reducing the societal impacts of breathlessness.
Clinically important breathlessness, reported by 9.5% of Australians in a 2019 survey, is associated with many conditions, including asthma, chronic obstructive lung disease (COPD), heart failure, and obesity.1,2 Its prevalence is likely to increase because of the impact on cardiopulmonary health of the rising prevalence of obesity, coronavirus disease 2019 (COVID‐19), atmospheric pollution, and the increasing frequency of extreme weather events associated with climate change, such as bushfires.3,4,5
In a 2014 study in Australia, New Zealand, and three Asian countries, breathlessness was reported by about 5% of adults who had presented to emergency departments and about 11% of those admitted to hospital from emergency departments.6 However, few studies have examined its impact on other services, such as general practices and specialist clinics.7,8 Further, while many studies have ascertained the impact on quality of life and productivity of specific breathlessness‐associated diseases such as COPD,9,10 few have assessed the impact of breathlessness in people without diagnosed disease.7,11 Importantly, the health system economic burden and productivity loss associated with breathlessness has not been assessed. Studies of breathlessness have generally dichotomised people into those with and without it,7 but a spectrum of severity is evident for this self‐reported symptom.
We therefore examined the impact of breathlessness on quality of life, health care use, productivity loss, and economic costs in Australia. Our study was based on a representative survey of Australian adults in 2019, prior to the COVID‐19 pandemic. We also explored the gradient in impact on individuals, the health system, and the economy according to the severity of breathlessness reported.
Methods
The National Breathlessness Survey was an internet‐based survey of adult Australians (18 years or older) conducted during 13–30 October 2019.1 Adults in the Dynata (https://www.dynata.com) web‐based survey panel (about 900 000 members) were invited by email to participate (target: 10 000 participants); recruitment was stratified by age group, gender, and state of residence, based on National Health Survey data.12 The participant sample was nationally representative with regard to these variables and Socioeconomic Index for Areas (SEIFA) Index of Relative Socioeconomic Disadvantage quintile13 (further details: Supporting Information, part 1). We report our study in accordance with the Strengthening the Reporting of Observational Studies in Epidemiology (STROBE) guidelines.14
Breathlessness severity
Breathlessness severity was assessed with the modified Medical Research Council (mMRC) dyspnoea scale,15 with grades ranging from 0 (no breathlessness) to 4 (most severe). mMRC grades 2 or more are generally regarded as indicating clinically important breathlessness (Box 1).
Outcomes
Quality of life
Survey participants were asked to rate their quality of life on the day the survey was completed. Health‐related quality of life was measured with the EQ‐5D 5‐level version (EQ‐5D‐5L) descriptive system and EQ‐VAS (visual analogue scale).16 For the EQ‐VAS, participants were asked to provide a global assessment of their health, from 0 (worst imaginable health) to 100 (best imaginable health). EQ‐5D‐5L responses in five domains (mobility, personal care, usual activities, pain/discomfort, anxiety/depression) were converted to a utility index score using a standard value set derived from the preferences of the general Australian population.17 This utility score is anchored to the range 0 (death) to 1 (full health); negative values are possible (further details: Supporting Information, part 2).
Health care use, employment, and productivity loss
For respondents with mild or clinically important breathlessness (mMRC grades 1 to 4), information about health care use and productivity loss related to breathlessness during the preceding twelve months was collected (further details: Supporting Information, part 2). Health care use included visits to general practitioners, specialists, and hospitals or emergency departments. Respondents were also asked whether they had spent one or more nights in hospital during the preceding twelve months, and which medications for breathing problems they had used. For productivity loss, respondents were asked about missing work, school, or other activities because of their breathing problem. Employment included fulltime, part‐time, and casual employment.
Cost of illness
We assessed costs from a societal perspective. Health care use unit costs were obtained from the Medical Benefits Schedule (MBS),18 Pharmaceutical Benefits Schedule (PBS),19 and Independent Health and Aged Care Pricing Authority (diagnosis‐related group [DRG] cost weights for emergency department visits and hospitalisations)20 websites. Over‐the‐counter medication costs were based on prices advertised by a pharmaceutical store chain (Chemist Warehouse). Indirect costs were based on the number of missing days from work for employed people. For costing purposes, responses regarding medical practitioner visits of “more than 6 times” were coded as seven visits. Detailed information on inhaled medication use was collected only for people with asthma or COPD. For other respondents, the median yearly medication expense was based on the Australian Institute of Health and Welfare 2020 medicines reimbursement report for people who reported at least one medical condition (other than asthma and COPD).21 We used the Australian Bureau of Statistics employee earnings and hours report22 to obtain the median salary by employment status (fulltime, part‐time, casual), which was then converted into cost per days lost for productivity loss; we assumed a standard mix of work income levels for the Australian population. Cost estimates were calculated by multiplying resource use by unit costs (Supporting Information, part 3).
Statistical analysis
We summarise demographic characteristics, quality of life domain values, health care use, and economic costs as descriptive statistics. The statistical significance of differences in the odds of health care use and productivity loss by breathlessness severity was assessed using ordered logistic regression; that of differences in quality of life and economic costs by breathlessness severity were assessed in a log‐link generalised linear model with a gamma distribution.23,24 Estimated marginal means with covariates at their fixed means and standard errors calculated with the delta method are reported for adjusted results.
Directed acyclic graphs were drawn and discussed by the investigators to identify the minimum set of covariates for the multivariable model to improve validity and estimate precision. The minimum adjustment set for all outcomes were age, gender, Indigenous status, self‐reported heart disease (heart attack or angina [current or past], heart failure or heart arrhythmia), self‐reported lung disease (asthma, chronic bronchitis, emphysema, COPD, bronchiectasis, pneumonia, tuberculosis, silicosis, pulmonary fibrosis, asbestosis, pneumothorax, or lung cancer), patient health questionnaire 4 (PHQ‐4) score greater than 9,25 multimorbidity (two or more medical conditions), and smoking status (currently, formerly, never smoked).
Our main analyses are based on fully adjusted models; unadjusted estimates are reported in the Supporting Information. All statistical analyses included the entire dataset, as the proportions of missing data and responses categorised as “Don't know” or “Not sure” were small (< 5%; Supporting Information, figure 1). The statistical significance of linear trends in outcome effect size with increasing breathlessness severity (mMRC grade) was assessed using the Stata contrast command. In economic cost sensitivity analyses, the number of health care visits, unit costs, and number of re‐hospitalisations were varied from those in the main analysis (Supporting Information, part 4). We also compared costs for people with and without heart and lung disease. Statistical analyses were conducted in Stata 17.
Ethics approval
The University of Sydney Human Research Ethics Committee approved the study (2019/621).
Results
Of 11 488 adults in the Dynata survey panel invited to participate, 10 072 completed the survey (87.7%). Mild breathlessness (mMRC grade 1) was reported by 3044 respondents (30.2%), clinically important breathlessness (mMRC grade 2–4) by 961 (9.5%).1 A total of 1047 respondents reported current heart disorders (10.4%), 1616 current lung disease (16.0%), and 4987 multimorbidity (49.5%); in each case, the proportion increased with mMRC grade in the range 0–3 (Box 2).
Quality of life
The mean EQ‐VAS score was 74.8 points (95% confidence interval [CI], 74.3–75.3 points) for respondents with mMRC grade 0 breathlessness; the mean value declined with increasing severity for respondents with breathlessness of mMRC grades 1 to 3 (trend across full range of severity: P < 0.001). The mean EQ‐5D‐5L score was 0.846 (95% CI, 0.841–0.850) for respondents with mMRC scores of 0; the mean value declined with increasing severity for respondents with breathlessness of mMRC grades 1 to 4 (trend across full range of severity: P < 0.001) (Box 3).
Among respondents with clinically important breathlessness (mMRC grades 2–4), pain or discomfort (761 of 961, 79.2%) and anxiety or depression (694 of 961, 72.2%) were the most frequently reported impairments (Supporting Information, figure 3). The EQ‐5D‐5L index score was a mean 0.20 (95% CI, 0.19–0.21) points lower for respondents with high PHQ‐4 scores, and a mean 0.12 (95% CI, 0.11–0.13) points lower for respondents with two or more medical conditions (Supporting Information, table 3).
Health care use
A total of 662 respondents (68.9%) with clinically important breathlessness (mMRC grades 2–4) reported that they had contact with health care services regarding their breathing problem during the preceding twelve months; 640 (66.6% of respondents) had contact with general practitioners (387 urgent visits, 606 non‐urgent visits; ie, both visit types could be reported by individual respondents) (Box 4).
Respondents with clinically important breathlessness were more likely than those with mild breathlessness (mMRC 1) to report non‐urgent general practitioner visits, urgent general practitioner visits (mMRC 2–4) and specialist visits (exception: mMRC 4); they were also more likely to report four or more non‐urgent general practitioner visits, urgent general practitioner visits, or specialist visits. The odds of emergency department visits were highest for respondents with mMRC scores of 2 (adjusted odds ratio [aOR], 2.42; 95% CI, 1.91–3.08). The odds of hospitalisation did not differ significantly between people with clinically important breathlessness and those with mild breathlessness (Box 5).
Respondents with self‐reported heart disease, self‐reported lung disease, or high PHQ‐4 scores were generally more likely to seek health care or frequently seek health care for their respiratory condition than those without these conditions, with the exception of hospitalisation; the odds ratios for these factors were larger than for other characteristics (Box 6).
Employment and productivity loss
A total of 4005 respondents were included in our economic cost analyses Supporting Information, figure 1). Among the 2839 respondents of working age, the likelihood of being employed declined with increasing breathlessness severity (mMRC grades 4 v 1: aOR, 0.34; 95% CI, 0.22–0.53); similarly, the likelihood of missing work or school because of their breathing problem during the past year was higher for respondents with mMRC scores of 2 (aOR, 2.08; 95% CI, 1.67–2.60) or 3 (aOR, 2.08; 95% CI, 1.67–2.60) than for those with mMRC scores of 1. The overall likelihood of employment was lower for women than men (aOR, 0.49; 95% CI, 0.41–0.58) and for respondents with two or more medical conditions (aOR, 0.59; 95% CI, 0.49–0.72) (Box 7).
Economic costs
The estimated mean annual total health care and societal costs were each higher for respondents with clinically important breathlessness than for those with mild breathlessness (Box 8). Sensitivity analyses indicated that the mean societal cost for people with mMRC scores of 2 to 4 was most sensitive to differences in hospitalisation costs (Box 9). Subgroup analyses indicated that the mean annual health care and societal costs for people with clinically significant breathlessness who reported heart or lung disease were higher at all severity levels than for people without these conditions; for example, the mean health care cost for people with mMRC scores of 4 and heart or lung disease was $3405 (95% CI, $1554–5256), and $2317 (95% CI, $1100–3535) for people with mMRC scores of 4 who did not report heart or lung disease. The increase in health care cost with breathlessness severity for people with or without heart and lung disease was statistically significant, but not the increase in societal cost (Supporting Information, table 6).
Discussion
Although breathlessness is common and imposes burdens on individuals, the health care system, and the economy, we found that a large proportion of people affected by it, including many with severe breathlessness, did not seek care from a medical practitioner during the year preceding our survey. Among respondents of working age, the likelihood of being employed declined with increasing severity of breathlessness. The estimated mean annual societal cost for people with clinically important breathlessness (mMRC 2–4) was higher than for those with mild breathlessness (mMRC 1), as were, in general, health care use and costs.
Quality of life scores were substantially lower for respondents with clinically important breathlessness than for those with no or mild breathlessness. Of the five EQ‐5D‐5L domains, pain/discomfort and anxiety/depression were the two impairments most frequently reported by respondents. The most frequently reported other condition was anxiety; high scores on the PHQ‐4, a screening tool for mental health problems,27 were also associated with greater health care use. Improving mental health and reducing the symptom burden are important when treating people with breathlessness, and greater accessibility of allied health services could improve quality of life and reduce the need for other health care services.
Few studies have examined health care use by people with breathlessness in the community. A 2017 South Australian survey (2898 participants) found that 97.6% of people with chronic clinically important breathlessness had visited general practitioners in the preceding three months, but they were not asked whether the visits were about their breathing problem.7 We found that 66.6% of participants with clinically important breathlessness had consulted general practitioners about breathing problems during the preceding twelve months. As most people receive care for breathlessness from general practitioners, the capacity of primary care to manage this symptom should be strengthened, particularly as other studies have found that patients are unsatisfied with its management by general practitioners,28,29 and general practitioners themselves report not being able to adequately manage patients with breathlessness.30
From a societal perspective, lower workforce participation because of breathlessness can reduce economic productivity. A South Australian study found that only 51% of working age people with mild breathlessness and 20.3% of those with clinically important breathlessness were employed.11 We found that the likelihood of people with grade mMRC 4 breathlessness working was significantly lower than for those with grade 2 breathlessness.
We found wide variation in health care costs for people with breathlessness. This was expected, as our respondents included a substantial proportion who did not report having other medical conditions, whose costs would be lower than for people who also had heart or lung disease, for example. The non‐linear increase in societal cost per person with increasing breathlessness severity reflects the lower likelihood of unemployment for people with severe breathlessness; the societal loss is lower for people with very severe breathlessness, as they are less likely to suffer income loss when breathlessness impairs their daily activities.
Implications for policy and practice
Even without considering the costs of unemployment caused by breathlessness, we estimate that total annual health care use costs would be $11.1 billion and the societal cost $12.2 billion were the distribution by breathlessness severity in our survey extrapolated to all Australian adults (Supporting Information, table 7). Further research into improving the management of breathlessness and strengthening primary care is needed, as this is where most of our respondents with breathlessness sought help. Our findings also suggest that a substantial proportion of people with breathlessness do not seek medical help. Peak representative organisations (such as Lung Foundation Australia, the Heart Foundation, and Asthma Australia) and professional bodies should encourage people to seek care for breathlessness and raise awareness about the benefits for quality on life that can be achieved by management that focuses on symptom relief and takes the mental health of people with breathlessness into account.
Limitations
Our large community survey had a nationally representative sample with respect to key demographic characteristics; for example, the prevalence of conditions such as asthma was similar to that found earlier National Health Surveys.1 However, its cross‐sectional nature precludes ascertaining temporality or causal links between breathlessness severity and outcomes. Recall bias was possible, especially regarding diagnoses, health care use, and productivity loss. As self‐reported hospitalisations can include overnight stays in emergency departments, the number reported could be higher than in administrative data. As survey respondents are more likely to underestimate than overestimate health care use and absenteeism,31 our estimates are probably conservative. Studies linking primary care, secondary care, and medications dispensing data with survey responses to further examine associations between breathlessness and unemployment, and a similar approach could be applied to other common chronic symptoms, such as cough and pain.
Our health care use cost estimates were conservative, as we used MBS and PBS unit costs, assumed minimum medication doses, modelled costs based on real world practice rather than full guideline dosing, and did not include allied health care use. Other studies have found, for example, that most general practices charge a mean $40 per consultation gap payment,32 so that general practitioner visits would cost twice the MBS rates. Further, our sensitivity analyses indicated that our cost estimates were robust across a variety of scenarios related to health care use. Finally, we may have underestimated the cost of productivity loss, as we included absenteeism but not presenteeism in our analysis; a substantial proportion of the workforce may suffer from breathlessness, and this would also affect their productivity while at work.
Conclusion
Breathlessness imposes heavy burdens on individuals, the health care system, and the economy, and the overall costs to the health system and society of breathlessness are probably substantial. Multidisciplinary action is needed to reduce this burden in Australia.
Box 1 – The modified Medical Research Council breathlessness scale,15 as used in our survey*
|
Grade |
Description |
Classification in our study |
|||||||||||||
|
|
|||||||||||||||
|
0 |
I only get breathless with strenuous exercise |
No breathlessness |
|||||||||||||
|
1 |
I get short of breath when hurrying on level ground or walking up a slight hill |
Mild breathlessness |
|||||||||||||
|
2 |
On level ground, I walk slower than people of my age because of breathlessness, or I have to stop for breath when walking at my own pace on the level |
Clinically important breathlessness |
|||||||||||||
|
3 |
I stop for breath after walking about 100 metres or after a few minutes on level ground |
Clinically important breathlessness |
|||||||||||||
|
4 |
I am too breathless to leave the house or I am breathless when dressing/undressing |
Clinically important breathlessness |
|||||||||||||
|
|
|||||||||||||||
|
* Survey participants were asked: “Please choose the one best response to describe your shortness of breath”. |
|||||||||||||||
Box 2 – Demographic characteristics of the 10 072 adults who participated in the 2019 National Breathlessness Survey
|
|
Modified Medical Research Council dyspnoea grade |
|
|
||||||||||||
|
Characteristic |
0 |
1 |
2 |
3 |
4 |
Total |
Population estimate* |
||||||||
|
|
|||||||||||||||
|
Participants |
6067 |
3044 |
620 |
216 |
125 |
10 072 |
|
||||||||
|
Age (years) |
|
|
|
|
|
|
|
||||||||
|
Mean (SD) |
47.6 (17.8) |
46.5 (17.9) |
44.1 (17.7) |
45.9 (19.8) |
39.3 (17.9) |
46.9 (17.9) |
|
||||||||
|
Under 65 |
4224 (69.6%) |
2138 (70.2%) |
452 (72.9%) |
151 (69.9%) |
98 (78.4%) |
7063 (70.1%) |
78.9% |
||||||||
|
65 or older |
1843 (30.4%) |
906 (29.8%) |
168 (27.1%) |
65 (30.1%) |
27 (21.6%) |
3009 (29.9%) |
21.1% |
||||||||
|
Gender |
|
|
|
|
|
|
|
||||||||
|
Men |
3165 (52.2%) |
1236 (40.6%) |
289 (46.6%) |
115 (53.2%) |
69 (55.2%) |
4874 (48.4%) |
49.1% |
||||||||
|
Women |
2881 (47.5%) |
1799 (59.1%) |
325 (52.4%) |
98 (45.4%) |
48 (38.4%) |
5151 (51.1%) |
50.9% |
||||||||
|
Indeterminate/no answer |
21 (0.4%) |
9 (0.3%) |
6 (1%) |
3 (1.4%) |
8 (6.4%) |
47 (0.5%) |
— |
||||||||
|
Medical conditions (self‐reported)† |
|
|
|
|
|
|
|
||||||||
|
Heart disease‡ |
402 (6.6%) |
420 (13.8%) |
148 (23.9%) |
54 (25.0%) |
23 (18.4%) |
1047 (10.4%) |
— |
||||||||
|
Lung disease§ |
587 (9.7%) |
643 (21.1%) |
249 (40.2%) |
98 (45.4%) |
39 (31.2%) |
1616 (16.0%) |
— |
||||||||
|
Multimorbidity¶ |
2408 (39.7%) |
1879 (61.7%) |
476 (76.8%) |
155 (71.8%) |
69 (55.2%) |
4987 (49.5%) |
— |
||||||||
|
High PHQ‐4 score (9 or higher) |
1163 (19.2%) |
1049 (34.5%) |
332 (53.6%) |
95 (44.0%) |
60 (48.0%) |
2699 (26.8%) |
— |
||||||||
|
Smoking status |
|
|
|
|
|
|
|
||||||||
|
Never smoked |
3376 (55.7%) |
1371 (45%) |
225 (36.3%) |
87 (40.3%) |
64 (51.2%) |
5123 (50.9%) |
55.69% |
||||||||
|
Currently smokes |
1106 (18.2%) |
847 (27.8%) |
205 (33.1%) |
71 (32.9%) |
36 (28.8%) |
2265 (22.5%) |
15.15% |
||||||||
|
Formerly smoked |
1585 (26.1%) |
826 (27.1%) |
190 (30.7%) |
58 (26.9%) |
25 (20.0%) |
2684 (26.7%) |
29.17% |
||||||||
|
Education |
|
|
|
|
|
|
|
||||||||
|
Did not complete high school |
734 (12.1%) |
389 (12.8%) |
104 (16.8%) |
42 (19.4%) |
30 (24.0%) |
1299 (12.9%) |
— |
||||||||
|
Completed high school |
1176 (19.4%) |
595 (19.6%) |
125 (20.2%) |
46 (21.3%) |
21 (16.8%) |
1963 (19.5%) |
— |
||||||||
|
Completed diploma/certificate |
1954 (32.2%) |
992 (32.6%) |
198 (31.9%) |
77 (35.7%) |
32 (25.6%) |
3253 (32.3%) |
27.82% |
||||||||
|
Completed university |
2203 (36.3%) |
1068 (35.1%) |
193 (31.1%) |
51 (23.6%) |
42 (33.6%) |
3557 (35.3%) |
20.91% |
||||||||
|
|
|||||||||||||||
|
PHQ‐4 = Patient Health Questionnaire 4; SD = standard deviation. * Source: Australian Bureau of Statistics population estimate, 2019 (for people aged 19 years or older),26 except smoking status (National Health Survey 2017–1812). † The most frequent medical conditions by age group (under 30 years, 30–65 years, over 65 years) are depicted in the Supporting Information, figure 2. ‡ Heart attack or angina (current or past), heart failure, heart arrhythmia. § Asthma, chronic bronchitis, emphysema, chronic obstructive pulmonary disease, bronchiectasis, pneumonia, tuberculosis, silicosis, pulmonary fibrosis, asbestosis/other asbestos‐related lung problems, pneumothorax, lung cancer. ¶ Two or more medical conditions. |
|||||||||||||||
Box 3 – Quality of life scores for 10 072 adults who participated in the 2019 National Breathlessness Survey, by breathlessness severity (modified Medical Research Council [mMRC] dyspnoea grade): multifactorial analysis
|
|
|
EQ‐VAS |
EQ‐5D‐5L index |
||||||||||||
|
Breathlessness severity grade |
Survey participants |
Mean (95% CI) |
Adjusted estimated mean difference (95% CI)* |
Mean (95% CI) |
Adjusted estimated mean difference (95% CI)* |
||||||||||
|
|
|||||||||||||||
|
mMRC 0 |
6067 |
74.8 (74.3–75.3) |
— |
0.846 (0.841–0.850) |
— |
||||||||||
|
mMRC 1 |
3044 |
69.3 (68.6–70.0) |
–5.5 (–6.4 to –4.6) |
0.810 (0.803–0.816) |
–0.036 (–0.044 to –0.028) |
||||||||||
|
mMRC 2 |
620 |
61.5 (60.1–62.8) |
–13.3 (–14.8 to –11.8) |
0.690 (0.678–0.703) |
–0.155 (–0.169 to –0.142) |
||||||||||
|
mMRC 3 |
216 |
57.5 (55.4–59.6) |
–17.2 (–19.4 to –15.1) |
0.680 (0.660–0.700) |
–0.165 (–0.186 to –0.145) |
||||||||||
|
mMRC 4 |
125 |
60.3 (57.3–63.3) |
–14.5 (–17.5 to –11.5) |
0.605 (0.581–0.629) |
–0.240 (–0.265 to –0.216) |
||||||||||
|
|
|||||||||||||||
|
CI = confidence interval; EQ‐5D‐5L = EuroQol five dimensions, five levels; EQ‐VAS = EuroQol Visual Analogue Scale. * Adjusted for age, gender, Indigenous status, self‐reported heart disease, self‐reported lung disease, high patient health questionnaire 4 (PHQ‐4) score, multimorbidity, and smoking status. Unadjusted results are reported in the Supporting Information, table 1. |
|||||||||||||||
Box 4 – Health care use by 4005 participants with modified Medical Research Council [mMRC] dyspnoea grades 1 to 4, by breathlessness severity*
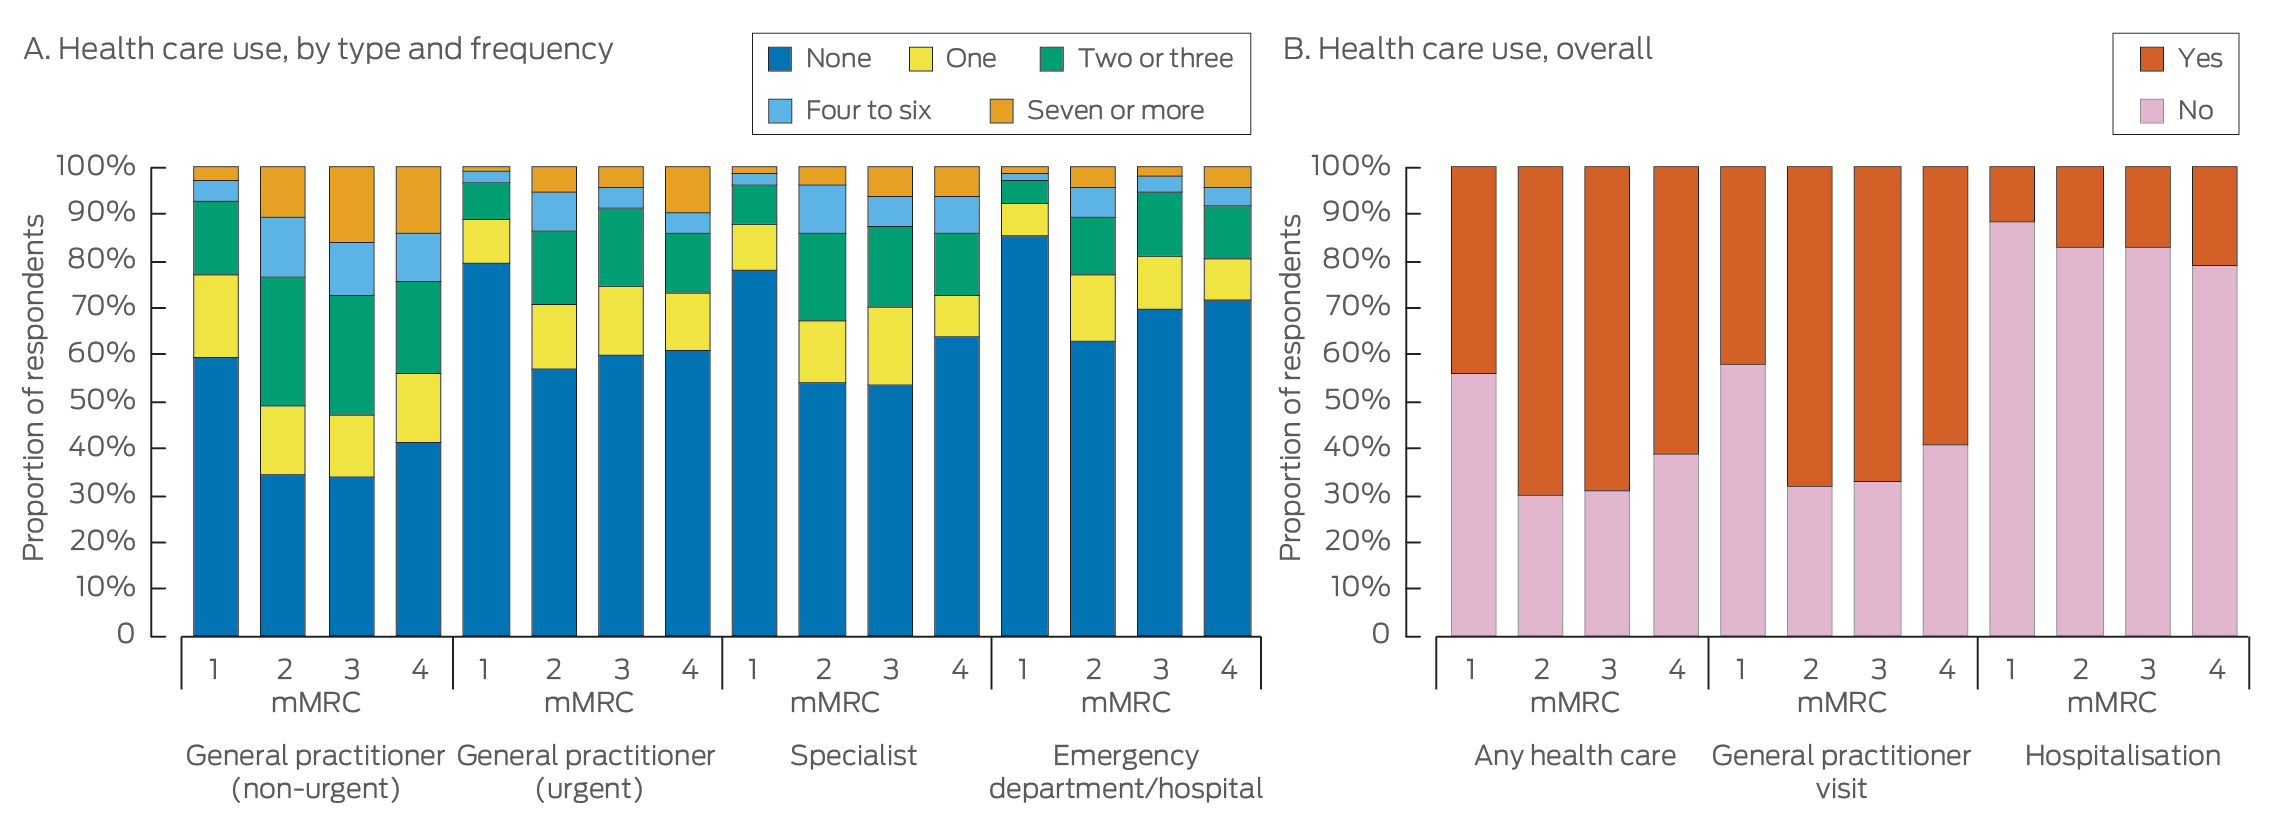
* The data for this graph are included in the Supporting Information, tables 3 and 4.
Box 5 – Health care use by 4005 participants with modified Medical Research Council [mMRC] dyspnoea grades 1 to 4, by breathlessness severity: multivariate analysis*
|
|
|
Adjusted odds ratio (95% CI) |
|||||||||||||
|
mMRC category/health care use |
Respondents |
General practitioner visit, non‐urgent |
General practitioner visit, urgent |
Specialist visit |
Emergency department/hospital visit |
Hospitalisation |
|||||||||
|
|
|||||||||||||||
|
mMRC 1 |
3044 |
1 |
1 |
1 |
1 |
1 |
|||||||||
|
mMRC 2 |
620 |
|
|
|
|
|
|||||||||
|
Health care use |
|
2.00 (1.62–2.47) |
2.02 (1.62–2.53) |
2.23 (1.79–2.77) |
2.42 (1.91–3.08) |
1.22 (0.92–1.60) |
|||||||||
|
Frequent health care use† |
|
2.93 (2.25–3.81) |
2.50 (1.75–3.58) |
2.73 (1.93–3.86) |
2.52 (1.67–3.82) |
— |
|||||||||
|
mMRC 3 |
216 |
|
|
|
|
|
|||||||||
|
Health care use |
|
1.89 (1.35–2.65) |
1.70 (1.21–2.40) |
2.09 (1.51–2.89) |
1.73 (1.21–2.49) |
1.10 (0.72–1.68) |
|||||||||
|
Frequent health care use† |
|
3.41 (2.34–4.97) |
1.56 (0.87–2.82) |
2.60 (1.58–4.26) |
1.49 (0.74–3.01) |
— |
|||||||||
|
mMRC 4 |
125 |
|
|
|
|
|
|||||||||
|
Health care use |
|
1.61 (1.03–2.52) |
1.72 (1.08–2.75) |
1.42 (0.89–2.27) |
1.30 (0.77–2.19) |
1.68 (0.99–2.85) |
|||||||||
|
Frequent health care use† |
|
3.33 (1.93–5.74) |
3.00 (1.54–5.85) |
3.06 (1.59–5.88) |
1.84 (0.78–4.33) |
— |
|||||||||
|
P for trend |
— |
|
|
|
|
|
|||||||||
|
Health care use |
|
0.05 |
0.048 |
0.19 |
0.59 |
0.08 |
|||||||||
|
Frequent health care use† |
|
< 0.001 |
0.008 |
0.002 |
0.34 |
— |
|||||||||
|
|
|||||||||||||||
|
CI = confidence interval. * Adjusted for age, sex, Indigenous status, self‐reported heart disease, self‐reported lung disease, high patient health questionnaire 4 (PHQ‐4) score, multimorbidity, and smoking status. Unadjusted results are reported in the Supporting Information, table 1. † More than four visits during year. |
|||||||||||||||
Box 6 – Health care use by 4005 respondents with modified Medical Research Council [mMRC] dyspnoea grades 1 to 4, by breathlessness severity: multivariate analysis (factors other than breathlessness)*
|
|
Adjusted odds ratio (95% CI) |
||||||||||||||
|
Characteristic/health care use |
General practitioner visit, non‐urgent |
General practitioner visit, urgent |
Specialist visit |
Emergency department/ hospital visit |
Hospitalisation |
||||||||||
|
|
|||||||||||||||
|
Age (per year) |
|
|
|
|
|
||||||||||
|
Health care use |
0.99 (0.99–1.00) |
0.98 (0.97–0.99) |
0.99 (0.98–0.99) |
0.97 (0.96–0.97) |
0.99 (0.98–1.00) |
||||||||||
|
Frequent health care use‡ |
1.01 (1.01–1.02) |
0.98 (0.97–0.99) |
0.98 (0.97–0.99) |
0.96 (0.95–0.97) |
— |
||||||||||
|
Sex (women) |
|
|
|
|
|
||||||||||
|
Health care use |
0.74 (0.64–0.87) |
0.75 (0.63–0.90) |
0.56 (0.47–0.66) |
0.63 (0.52–0.77) |
0.81 (0.66–1.01) |
||||||||||
|
Frequent health care use‡ |
0.89 (0.71–1.12) |
0.76 (0.55–1.03) |
0.84 (0.60–1.16) |
0.52 (0.35–0.77) |
— |
||||||||||
|
Self‐reported heart disease |
|
|
|
|
|
||||||||||
|
Health care use |
1.76 (1.41–2.19) |
1.94 (1.53–2.45) |
2.86 (2.29–3.57) |
3.47 (2.71–4.45) |
1.89 (1.45–2.45) |
||||||||||
|
Frequent health care use‡ |
1.72 (1.32–2.23) |
2.76 (1.95–3.91) |
2.73 (1.89–3.95) |
3.99 (2.57–6.19) |
— |
||||||||||
|
Self‐reported lung disease |
|
|
|
|
|
||||||||||
|
Health care use |
4.03 (3.33–4.88) |
4.06 (3.33–4.96) |
3.41 (2.81–4.14) |
3.25 (2.60–4.06) |
1.78 (1.39–2.27) |
||||||||||
|
Frequent health care use‡ |
2.39 (1.86–3.07) |
3.95 (2.72–5.73) |
2.88 (1.96–4.24) |
3.02 (1.88–4.87) |
— |
||||||||||
|
High PHQ‐4 score |
|
|
|
|
|
||||||||||
|
Health care use |
1.57 (1.33–1.85) |
2.00 (1.66–2.41) |
1.61 (1.34–1.93) |
1.70 (1.38–2.10) |
1.1 (0.88–1.39) |
||||||||||
|
Frequent health care use‡ |
2.02 (1.57–2.59) |
1.49 (1.07–2.08) |
2.68 (1.87–3.84) |
2.37 (1.56–3.61) |
— |
||||||||||
|
Multimorbidity† |
|
|
|
|
|
||||||||||
|
Health care use |
1.24 (1.03–1.48) |
1.02 (0.82–1.28) |
1.00 (0.81–1.24) |
0.89 (0.69–1.15) |
1.02 (0.78–1.33) |
||||||||||
|
Frequent health care use‡ |
1.50 (1.07–2.11) |
0.68 (0.44–1.06) |
0.62 (0.39–0.97) |
0.46 (0.27–0.79) |
— |
||||||||||
|
Currently smokes |
|
|
|
|
|
||||||||||
|
Health care use |
1.44 (1.20–1.73) |
1.62 (1.31–2.00) |
1.30 (1.06–1.59) |
1.62 (1.28–2.05) |
1.37 (1.06–1.76) |
||||||||||
|
Frequent health care use‡ |
1.42 (1.07–1.89) |
1.58 (1.10–2.28) |
2.09 (1.42–3.08) |
2.38 (1.51–3.75) |
— |
||||||||||
|
Formerly smoked |
|
|
|
|
|
||||||||||
|
Health care use |
1.33 (1.10–1.59) |
1.28 (1.02–1.60) |
1.21 (0.98–1.51) |
1.30 (1.00–1.69) |
1.32 (1.01–1.72) |
||||||||||
|
Frequent health care use‡ |
1.41 (1.05–1.89) |
1.08 (0.70–1.67) |
1.21 (0.75–1.95) |
1.04 (0.57–1.92) |
— |
||||||||||
|
|
|||||||||||||||
|
CI = confidence interval; PHQ‐4 = Patient Health Questionnaire 4. * Adjusted for modified Medical Research Council [mMRC] dyspnoea grade (severity of breathlessness), age, gender, Indigenous status, self‐reported heart disease, self‐reported lung disease, high PHQ‐4 score, multimorbidity, and smoking status. † Two or more medical conditions. ‡ More than four visits during year. |
|||||||||||||||
Box 7 – Employment and productivity loss for respondents with modified Medical Research Council [mMRC] dyspnoea grades 1 to 4: multivariate analysis*
|
|
Adjusted odds ratio (95% CI) |
||||||||||||||
|
Characteristic |
Employment† (respondents under 65 years of age) |
Missing work/school |
|||||||||||||
|
|
|||||||||||||||
|
Respondents |
2839 |
4005 |
|||||||||||||
|
mMRC grade |
|
|
|||||||||||||
|
1 |
1 |
1 |
|||||||||||||
|
2 |
0.71 (0.57–0.88) |
2.08 (1.67–2.60) |
|||||||||||||
|
3 |
0.50 (0.36–0.72) |
1.92 (1.37–2.69) |
|||||||||||||
|
4 |
0.34 (0.22–0.53) |
1.13 (0.69–1.85) |
|||||||||||||
|
Age (per year) |
0.98 (0.98–0.99) |
0.97 (0.96–0.97) |
|||||||||||||
|
Sex (women) |
0.49 (0.41–0.58) |
0.72 (0.61–0.86) |
|||||||||||||
|
Self‐reported heart disease |
1.13 (0.89–1.45) |
1.65 (1.31–2.09) |
|||||||||||||
|
Self‐reported lung disease |
1.16 (0.95–1.43) |
3.16 (2.59–3.85) |
|||||||||||||
|
High PHQ‐4 score |
0.72 (0.61–0.86) |
1.76 (1.47–2.11) |
|||||||||||||
|
Multimorbidity |
0.59 (0.49–0.72) |
1.27 (1.03–1.57) |
|||||||||||||
|
Currently smokes |
1.03 (0.85–1.25) |
1.67 (1.37–2.04) |
|||||||||||||
|
Formerly smoked |
1.11 (0.9–1.37) |
1.29 (1.04–1.61) |
|||||||||||||
|
|
|||||||||||||||
|
CI = confidence interval. * Adjusted for age, sex, Indigenous status, self‐reported heart disease, self‐reported lung disease, high PHQ‐4 score, multimorbidity, and smoking status. Unadjusted results by mMRC category are reported in the Supporting Information, table 1. † Fulltime, part‐time, or casual employment. |
|||||||||||||||
Box 8 – Estimated mean annual economic costs for 4005 respondents with modified Medical Research Council [mMRC] dyspnoea grades 1 to 4
|
mMRC grade |
Respondents |
Total health care cost per person* (95% CI) |
Societal cost per person* (95% CI) |
||||||||||||
|
|
|||||||||||||||
|
mMRC 1 |
3044 |
$1288 ($1205–1372) |
$1413 ($1326–1501) |
||||||||||||
|
mMRC 2 |
620 |
$1854 ($1573–2135) |
$2065 ($1766–2365) |
||||||||||||
|
mMRC 3 |
216 |
$1636 ($1232–2039) |
$1795 ($1371–2218) |
||||||||||||
|
mMRC 4 |
125 |
$1992 ($1303–2681) |
$2075 ($1389–2762) |
||||||||||||
|
P for trend |
— |
0.002 |
0.42 |
||||||||||||
|
|
|||||||||||||||
|
CI = confidence interval. * Adjusted for age, sex, Indigenous status, self‐reported heart disease, self‐reported lung disease, high patient health questionnaire 4 (PHQ‐4) score, multimorbidity, and smoking status. Unadjusted results are reported in the Supporting Information, table 1; unadjusted median costs are reported in the Supporting Information, table 6. |
|||||||||||||||
Box 9 – Estimated mean annual societal costs for 4005 respondents with modified Medical Research Council [mMRC] dyspnoea grades 1 to 4: sensitivity analyses*
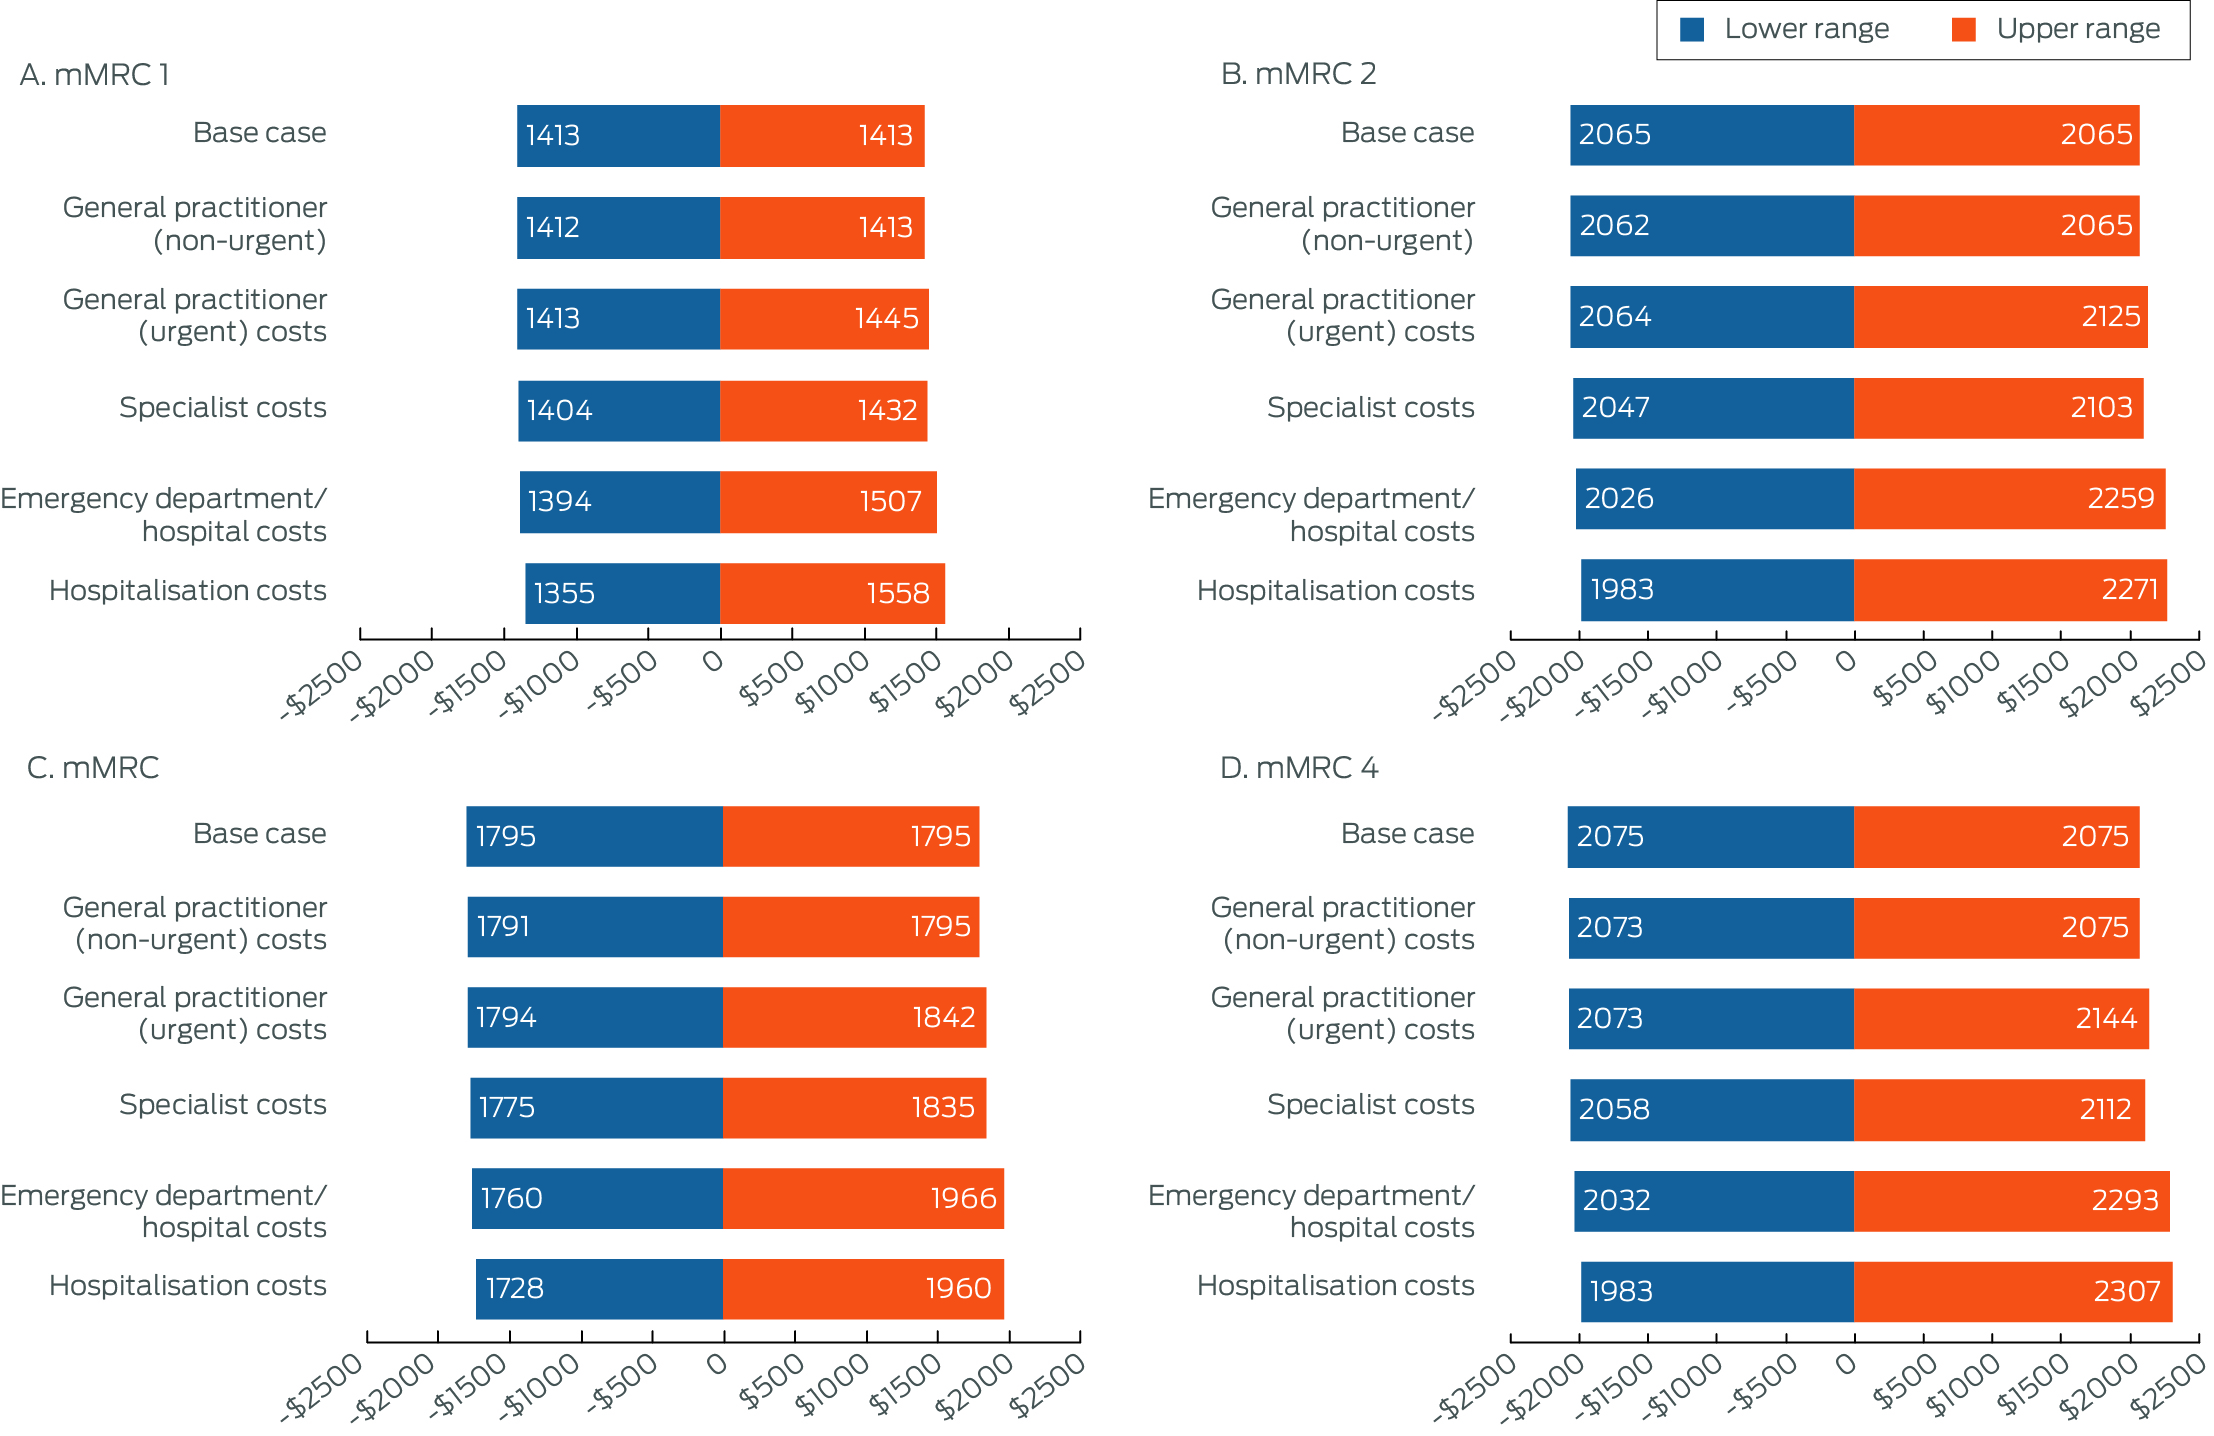
* Scenarios: see Supporting Information, part 4.
Received 22 September 2023, accepted 6 May 2024
- Anthony P Sunjaya1,2
- Leanne M Poulos3
- Gian Luca Di Tanna1,4
- Thomas Lung1,5
- Guy B Marks6,7
- Helen K Reddel3,6,8,9
- Christine R Jenkins1,9
- 1 The George Institute for Global Health, Sydney, NSW
- 2 University of New South Wales, Sydney, NSW
- 3 Australian Centre for Airways disease Monitoring, Woolcock Institute of Medical Research, Sydney, NSW
- 4 University of Applied Sciences and Arts of Southern Switzerland, Manno, Switzerland
- 5 Sydney School of Public Health, the University of Sydney, Sydney, NSW
- 6 Sydney Local Health District, Sydney, NSW
- 7 Liverpool Hospital, Sydney, NSW
- 8 Macquarie Medical School, Macquarie University, Sydney, NSW
- 9 The University of Sydney, Sydney, NSW
Open access:
Open access publishing facilitated by University of New South Wales, as part of the Wiley – University of New South Wales agreement via the Council of Australian University Librarians.
Data sharing:
The data underlying this study are available from the authors upon reasonable request for studies with ethics approval.
The Australian Centre for Airways disease Monitoring (ACAM), a unit of the Woolcock Institute of Medical Research, receives investigator‐initiated research grants provided by industry partners, including GlaxoSmithKline, AstraZeneca, and Novartis. Anthony Sunjaya is supported by a Scientia PhD scholarship from UNSW Sydney.
Christine Jenkins and Helen Reddel have received personal fees and non‐financial support from pharmaceutical companies that produce medicines for treating respiratory disease. Leanne Poulos, Guy Marks, and Helen Reddel have received research grants for studies unrelated to this article.
- 1. Poulos LM, Ampon RD, Currow DC, et al. Prevalence and burden of breathlessness in Australian adults: the National Breathlessness Survey: a cross‐sectional web‐based population survey. Respirology 2021; 26: 768‐775.
- 2. Guo YL, Ampon MR, Poulos LM, et al. Contribution of obesity to breathlessness in a large nationally representative sample of Australian adults. Respirology 2023; 28: 350‐356.
- 3. Vardoulakis S, Jalaludin BB, Morgan GG, et al. Bushfire smoke: urgent need for a national health protection strategy. Med J Aust 2020; 212: 349‐353. https://www.mja.com.au/journal/2020/212/8/bushfire‐smoke‐urgent‐need‐national‐health‐protection‐strategy
- 4. Nogrady B. Bushfires: Australia issues health warnings as Sydney air quality plummets. BMJ 2019; 367: l6914.
- 5. D'Amato G, Cecchi L, D'Amato M, Annesi‐Maesano I. Climate change and respiratory diseases. Eur Respir Rev 2014; 23: 161‐169.
- 6. Kelly AM, Keijzers G, Klim S, et al; AANZDEM Study Group. An observational study of dyspnea in emergency departments: the Asia, Australia, and New Zealand Dyspnea in Emergency Departments Study (AANZDEM). Acad Emerg Med 2017; 24: 328‐336.
- 7. Currow DC, Chang S, Ekström M, et al. Health service utilisation associated with chronic breathlessness: random population sample. ERJ Open Res 2021; 7: 00415‐2021.
- 8. Currow DC, Clark K, Mitchell GK, et al. Prospectively collected characteristics of adult patients, their consultations and outcomes as they report breathlessness when presenting to general practice in Australia. PLoS One 2013; 8: e74814.
- 9. Toelle BG, Ampon RD, Abramson MJ, et al. Prevalence of chronic obstructive pulmonary disease with breathlessness in Australia: weighted using the 2016 Australian census. Intern Med J 2021; 51: 784‐787.
- 10. Verberkt CA, van den Beuken‐van Everdingen MHJ, Dirksen CD, et al. Healthcare and societal costs in patients with COPD and breathlessness after completion of a comprehensive rehabilitation program. COPD 2021; 18: 170‐180.
- 11. Clark J, Chang S, Kinchin I, et al. Lower workforce participation is associated with more severe persisting breathlessness. BMC Pulm Med 2022; 22: 93.
- 12. Australian Bureau of Statistics. National Health Survey: first results, 2017–18 (cat. no. 4364.0.55.001). 12 Dec 2018. https://www.abs.gov.au/statistics/health/health‐conditions‐and‐risks/national‐health‐survey/2017‐18 (viewed July 2023).
- 13. Australian Bureau of Statistics. Index of Relative Socio‐economic Disadvantage (IRSD). In: Socio‐Economic Indexes for Areas (SEIFA), Australia; 2021. 27 Apr 2023. https://www.abs.gov.au/statistics/people/people‐and‐communities/socio‐economic‐indexes‐areas‐seifa‐australia/latest‐release#index‐of‐relative‐socio‐economic‐disadvantage‐irsd‐ (viewed July 2023).
- 14. von Elm E, Altman DG, Egger M, et al.; STROBE Initiative. Strengthening the Reporting of Observational Studies in Epidemiology (STROBE) statement: guidelines for reporting observational studies. BMJ 2007; 335: 806‐808.
- 15. Mahler DA, Wells CK. Evaluation of clinical methods for rating dyspnea. Chest 1988; 93: 580‐586.
- 16. EuroQol Group. EuroQol: a new facility for the measurement of health‐related quality of life. Health Policy 1990; 16: 199–208.
- 17. Norman R, Mulhern B, Lancsar E, et al. The use of a discrete choice experiment including both duration and dead for the development of an EQ‐5D‐5L value set for Australia. Pharmacoeconomics 2023; 41: 427‐438.
- 18. Australian Department of Health. Medicare Benefits Schedule book: operating from 1 November 2019. https://www.mbsonline.gov.au/internet/mbsonline/publishing.nsf/Content/F540E955EFE9BFD5CA25861500000C28/$File/201911‐MBS.pdf (viewed July 2023).
- 19. Australian Department of Health. Schedule of Pharmaceutical Benefits: general pharmaceutical schedule, volume 1. https://www.pbs.gov.au/publication/schedule/2019/12/2019‐12‐01‐general‐schedule‐volume‐1.pdf (viewed July 2023).
- 20. Independent Health and Aged Care Pricing Authority. National Hospital Cost Data Collection (NHCDC) public hospitals report 2019–20. 11 Mar 2022. https://www.ihacpa.gov.au/resources/national‐hospital‐cost‐data‐collection‐nhcdc‐public‐hospitals‐report‐2019‐20 (viewed July 2023).
- 21. Australian Institute of Health Welfare. Australia's health 2020: data insights (cat. no. AUS 231). 23 July 2020. https://www.aihw.gov.au/reports/australias‐health/australias‐health‐2020‐data‐insights (viewed July 2023).
- 22. Australia Bureau of Statistics. Employee earnings and hours, Australia 2018; May 2018. 22 Jan 2019. https://www.abs.gov.au/statistics/labour/earnings‐and‐working‐conditions/employee‐earnings‐and‐hours‐australia/may‐2018 (viewed July 2023).
- 23. Devlin N, Parkin D, Janssen B. Analysis of EQ‐5D values. In: Devlin N, Parkin D, Janssen B, editors. Methods for analysing and reporting EQ‐5D data. Cham: Springer International Publishing, 2020; pp. 61‐86.
- 24. Mihaylova B, Briggs A, O'Hagan A, Thompson SG. Review of statistical methods for analysing healthcare resources and costs. Health Econ 2011; 20: 897‐916.
- 25. Kroenke K, Spitzer RL, Williams JB. The PHQ‐9: validity of a brief depression severity measure. J Gen Intern Med 2001; 16: 606‐613.
- 26. Australia Bureau of Statistics. Australian demographic statistics, Dec 2019. 18 June 2020. https://www.abs.gov.au/statistics/people/population/national‐state‐and‐territory‐population/dec‐2019/31010do001_201912.xls (viewed July 2023).
- 27. Kroenke K, Spitzer RL, Williams JB, Löwe B. An ultra‐brief screening scale for anxiety and depression: the PHQ‐4. Psychosomatics 2009; 50: 613‐621.
- 28. Hutchinson A, Galvin K, Johnson MJ. “So, I try not to go…” Acute‐on‐chronic breathlessness and presentation to the emergency department: in‐depth interviews with patients, carers, and clinicians. J Pain Symptom Manage 2020; 60: 316‐325.
- 29. Sunjaya A, Martin A, Arnott C, et al. “It's like a forgotten issue sometimes…” Qualitative study of individuals living and caring for people with chronic breathlessness. Clin Respir J 2023; 17: 694‐700.
- 30. Sunjaya A, Martin A, Arnott C, Jenkins C. Management of chronic breathlessness in primary care: what do GPs, non‐GP specialists, and allied health professionals think? Aust J Prim Health 2023; 29: 375‐384.
- 31. Short ME, Goetzel RZ, Pei X, et al. How accurate are self‐reports? Analysis of self‐reported health care utilization and absence when compared with administrative data. J Occup Environ Med 2009; 51: 786‐796.
- 32. Gillespie J. Blue Report: National general practitioner listings. CleanBill, Jan 2023. https://cleanbill.com.au/wp‐content/uploads/2023/01/Cleanbill‐Blue‐Report‐January‐2023.pdf (viewed July 2023).
Abstract
Objective: To examine the impact of breathlessness on quality of life, health care use, productivity loss, and economic costs in Australia.
Study design: National internet‐based survey of Australian adults drawn from a web‐based survey panel (National Breathlessness Survey).
Participants, setting: Australian adults (18 years or older), nationally representative by age group, gender, state of residence, and postcode‐based socio‐economic status (Index of Relative Socioeconomic Disadvantage quintile), 13–30 October 2019.
Main outcome measures: Quality of life assessed with the EQ‐5D 5‐level version (EQ‐5D‐5L) and visual analogue scale (EQ‐VAS), health care use, productivity loss, and societal cost, each by severity of breathlessness (modified Medical Research Council [mMRC] dyspnoea scale; mMRC grade 1: mild breathlessness; mMRC grades 2–4: clinically important breathlessness).
Results: Of 10 072 adults who completed the survey, mild breathlessness was reported by 3044 respondents (30.2%), and clinically important breathlessness by 961 (9.5%). The mean EQ‐VAS score was 74.8 points (95% confidence interval [CI], 74.3–75.3 points) and the mean EQ‐5D‐5L score 0.846 (95% CI, 0.841–0.850) for respondents with mMRC grade 0 breathlessness; for each measure, the mean value declined with increasing severity of breathlessness (trends: eachP < 0.001). Respondents with clinically important breathlessness were more likely than those with mild breathlessness to report non‐urgent general practitioner visits, urgent general practitioner visits, and specialist visits (exception: mMRC scores of 4) during the preceding year. Among the 2839 respondents of working age, the likelihood of being employed declined with increasing breathlessness severity (mMRC grades 4 v 1: adjusted odds ratio, 0.34; 95% CI, 0.22–0.53). Adjusted mean annual societal cost per person was $1413 (95% CI, $1326–1501) for respondents with mMRC grade 1 breathlessness, $2065 (95% CI, $1766–2365) at mMRC grade 2, $1795 (95% CI, $1371–2218) at mMRC grade 3, and $2075 (95% CI, $1389–2762) at mMRC grade 4.
Conclusion: Breathlessness imposes major burdens on individuals, the health care system, and the economy.