


The known: The Australian Home Care Package (HCP) program underwent a series of reforms during 2013–20 with the aim of improving the accessibility and quality of care for older people wishing to remain at home.
The new: Despite a substantial general increase in the availability of HCPs, the demand for support is still not being fully met, particularly for higher care level packages and by people who do not live in major cities.
The implications: Increasing the availability of higher care level packages will probably require increasing the size of the workforce trained for delivering them, particularly in regional and remote areas of Australia.
Australia subsidises a variety of health and social services to support its ageing population.1 Ageing‐in‐place policies facilitate cost‐effective aged care service provision that meets the increasing care needs of older Australians while accommodating their preferences to remain at home.2 Ageing‐in‐place helps older people to remain autonomous and maintain the social support of their established communities and relationships.3,4
The federal government Home Care Package (HCP) program subsidises long term home care support services. Providers deliver HCPs as bundled care services to older people according to the required care level, determined in an eligibility assessment, from basic (level 1) to high (level 4).5 The package values currently range from $10 588 per year (level 1) to $61 440 per year (level 4).6 In 2022, some providers estimated that a level 4 package covered seven hours and 45 minutes of care per week.7 Demand for HCPs has typically exceeded their availability, and lags between assessment and the provision of care have been a problem, especially at higher care levels.8,9 Longer lag times are associated with higher risks of death and transition to permanent residential aged care.10
On 1 July 2013, the Australian government introduced the 10‐year Living Longer Living Better program, with the aim of supporting ageing‐in‐place by increasing HCP availability, recipients’ control over their care, and care system transparency (Supporting Information, table 1).11,12,13 On 25 November 2019, the government responded to the 2019 Royal Commission into Aged Care Quality and Safety interim report9 by providing funding for an additional 10 000 HCPs.14
The substantial increase in HCP funding was followed by an unprecedented increase in the number provided, but the overall change in service provision and the impact on specific subgroups of older people have not been evaluated. Significant problems in care access — in availability and waiting times, and for specific subgroups (eg, people living in rural or remote areas) — have been documented.8,9 The next reform of in‐home aged care in Australia, the Support at Home program,15 will replace the HCP program from 1 July 2025, and information on the impact of increased HCP support will provide valuable information for these changes.
We therefore assessed changes following the 2013–2021 HCP reforms in the rate of HCPs provided to Australians aged 65 years or older, the characteristics of people who have received HCPs, and the capacity of the program to meet demand for its services during 2018–21.
Methods
For our repeated cross‐sectional, population‐based study of people who received HCPs during 2008–21, we analysed Australian Institute of Health and Welfare (AIHW) GEN Aged Care data (service records [entry and exit dates, care level] and characteristics of new recipients of HCPs; financial years 2008–09 to 2020–21)16 and Australian Department of Health and Aged Care Home Care Packages program data (provision of and demand for HCPs, reported quarterly in the national priority system; financial years 2018–19 to 2020–21).17 For estimates by specific population characteristics, we used Australian Bureau of Statistics historical population data (at June of each year; financial years 2008–09 to 2020–21).18
Study population
The study population included all non‐Indigenous people aged 65 years or older who received HCPs during 1 July 2008 – 30 June 2021. We excluded Aboriginal and Torres Strait Island recipients (3% of HCP recipients each year16) because we did not have the required leadership, ethics, and governance approval to undertake analyses of data for Indigenous people.
Outcomes
We report the number of HCP approvals per 1000 older Australians (aged 65 years or more) by financial year as crude rates and as directly age‐ and sex‐standardised rates. The standardised rates are adjusted for the age and sex distributions of the Australian population in the respective financial year, and standardised to the mean Australian population during 2008–20.
We report the proportions of HCP recipients, overall and by care level, by sex, age group (during the relevant financial year), culturally and linguistically diverse status (preferred language is English, other), geographic remoteness category19 (inner regional/outer regional/remote/very remote, combined as “not major cities”), and socio‐economic status (2011 Socio‐Economic Indexes for Areas [SEIFA] Index of Relative Socio‐Economic Disadvantage [IRSD] deciles20) of aged care planning region, derived from data in the AIHW GEN HCP admission datasets and Australian Bureau of Statistics historical population datasets. IRSD deciles for aged care planning regions were calculated by aggregating data for the Statistical Areas 2 (SA2) they include.
The proportional supply of HCPs by care level and financial year was calculated from the relevant number of HCP recipients and the total number of HCP recipients. The proportional demand for HCPs by care level and financial year was calculated from the number of people waiting for HCPs (without having received offers for lower level packages) and the total number of people waiting for HCPs. Over‐ and undersupply were respectively defined as the proportional supply of HCPs at a care level exceeding or being smaller than the proportional demand in a financial year.
Statistical analysis
To examine changes over time in HCP rates and the characteristics of HCP recipients, we calculated absolute differences between the financial years 2013–14 (prior to the first ageing‐in‐place reform) and 2020–21 (the most recent financial year for which data were available). We report changes in standardised rates, with 95% confidence intervals (CIs), and also changes in absolute numbers, crude rates, and proportions of recipients by specific characteristics. For the supply and demand analyses (data available only from 2018–19), we compared proportional demand and supply by care levels over time as descriptive statistics. Statistical analyses were conducted in R 4.2.2.
Ethics approval
We did not seek formal ethics approval for our analysis of publicly available data.
Results
A total of 490 276 HCPs were provided to recipients during 2008–21. The age‐ and sex‐standardised HCP provision rate rose from 9.23 in 2013–14 to 16.4 per 1000 people aged 65 years or more in 2020–21, a 77.8% increase in the standardised rate. The increases in age‐ and sex‐standardised HCP rate between 2013–14 and 2020–21 were greatest for level 1 (from 0.19 to 5.05 per 1000 older people) and level 3 HCPs (from 0.35 to 3.62 per 1000 older people). The rate for level 2 HCPs declined from 6.75 to 5.82 per 1000 older people; the rate for level 4 HCPs did not change (Box 1, Box 2).
Characteristics of home care package recipients
The proportion of HCP recipients aged 65–74 years increased from 16.0% in 2013–14 to 17.8% in 2020–21, the proportion aged 75–84 years was similar in both years (41.9% v 42.0%), and the proportion aged 85 years or older declined from 42.1% to 40.2% (Box 2, Box 3). The proportion of women declined from 63.2% to 61.5%, that of culturally and linguistically diverse recipients rose from 10.8% to 16.2%, and the proportion of recipients living outside major cities rose slightly, from 28.1% to 28.7% (Box 2, Box 4). The proportion of recipients living outside major cities increased for lower care levels between 2013–14 and 2020–21 (level 1, from 164 of 669, 24.5% to 6385 of 20 997, 30.4%; level 2: from 6296 of 22 766, 27.7% to 6930 of 24 038, 28.8%), but declined for higher care level HCPs (level 3, from 367 of 1191, 30.8% to 4165 of 14 973, 27.8%; level 4: from 1922 of 6493, 29.6% to 2007 of 7959, 25.2%) (age‐ and sex‐standardised rates: Supporting Information, table 5). The distribution pattern for recipients living outside major cities (increased shares of lower care levels and reduced shares of higher care levels) was also evident for HCPs in aged care planning regions in the socio‐economically most disadvantaged quintile (Supporting Information, figure 1 and table 6).
Home care package demand and supply by care level, 2018–19 to 2020–21
The number of people on the waiting list for HCPs increased from 196 681 in 2018–19 to 201 998 in 2020–21. In 2018–19, 8912 of 45 482 HCPs provided were level 1 packages (20%), and 20 997 of 67 967 HCPs (31%) in 2020–21, while 4529 of 196 681 people waiting for HCPs (2%) were waiting for level 1 packages in 2018–19, and 11 665 of 204 998 people (6%) in 2020–21; that is, in both years a considerable oversupply of level 1 HCPs was evident. For level 2 HCPs, oversupply was noted for 2018–19 and 2019–20, but undersupply in 2020–21; for level 3 HCPs, undersupply was noted in all three years; and for level 4 HCPs, undersupply was noted for 2018–19 and 2019–20, but supply met demand in 2020–21 (Box 5).
Discussion
We found that the HCP provision rate increased 77.8% following the Living Longer Living Better reforms and the Royal Commission recommendation of greater HCP support, rising from 9.23 (2013–14) to 16.4 per 1000 people aged 65 years or more (2020–21). This rise was primarily the result of increases for care levels 1 and 3 HCPs; the rate for level 4 HCPs (the highest level) did not change significantly. The proportions of HCPs provided at levels 2 and 4 consequently declined, while those at levels 1 and 3 increased. Further, the overall supply of HCPs fell short of demand during 2018–21, and supply by care level did not correspond to the proportional demand, resulting in undersupply at higher care levels (3 and 4) and oversupply at lower care levels (1 and 2).
Although the HCP reforms did not aim to change the characteristics of the HCP recipient population, it is striking that the proportion of recipients classified as culturally and linguistically diverse increased by 5.4 percentage points, from 10.8% to 16.2%. As the population proportion of culturally and linguistically diverse Australians increased by 3% during 2013–2020 (Australian census data), this change may not be the direct result of the reforms. The overall proportion of HCPs received by people living outside major cities did not change substantially during 2013–21, but the proportions of level 1 and 2 HCPs increased while the level 3 and 4 HCP proportions declined. This difference between HCP levels might be explained by problems in providing higher level HCPs outside major cities related to the lower availability of aged care workers.21 The small increase in the proportion of HCPs that were received by people aged 65–74 years after the consumer‐directed care reform (2015–16) could indicate that the new choices and processes caused problems for people aged 75 years or older. The complexity of navigating aged care reforms and processes was highlighted in the final report of the Royal Commission.8
That the reforms increased access to HCP both overall and for certain groups in particular suggests some success in improving service access. Paired with the fall in the number of admissions to residential aged care during 2008–2016,22 the changes also suggest some success in shifting aged care from residential to home care. Nevertheless, further reforms that will require substantial long term planning and funding are still needed to better support people living at home longer. The highest HCP care level covers about seven hours and 45 minutes of care per week;7 it is unlikely that someone with significant frailty, major limitations to activities of daily living, and cognitive decline could remain at home with this level of care.8 Such a person is likely to receive a lower level HCP as an interim solution while waiting months, or even years, for their approved level of care.8 This is clearly better than receiving no care at all, but remaining at home longer term becomes near impossible and places them at increased risks of needing residential care and death than had they received a package at their assessed level of need.10 Finally, the necessary increase in level 3 and 4 HCP availability must be accompanied by an increase in specialised training, as a skilled workforce is the prerequisite to increased availability.8
If underfunding leads to non‐optimal solutions (eg, interim packages), these solutions should be distributed fairly. Given our findings of HCP undersupply at certain care need levels and for people living outside major cities, it is questionable whether the general increase in HCP availability has been accompanied by distributional fairness. To ameliorate this situation, factors that contribute to regional and remote undersupply, such as lower service capacity in remote and regional Australia,8 need to be targeted by future reforms. For example, similar to other health services areas (eg, primary care, allied health, palliative care),23,24 the specialised workforce or providers may not be adequate for delivering the required services.21 The availability of incentives for providers and staff to deliver care in regional and remote areas, such as the viability funding supplement and capital grants to providers in rural and remote areas,25 need to be expanded.
Limitations
Our analysis of national data for 490 276 people who received HCPs during 2013–21 provides a representative and comprehensive overview of recipient characteristics. However, we did not have information about whether individual HCPs were granted at the recommended care level or were interim solutions. While our supply and demand analysis indicated that a substantial proportion of level 1 HCPs were interim packages (absolute and proportional supply exceed demand at this level), the degree of underservicing and its distribution by care level could not be estimated without specific linked data on waitlisting and package approvals. Making these data available, together with care needs assessment and health outcomes data, would allow a more comprehensive evaluation of ageing‐in‐place practices. Additionally, the publicly available HCP dates are reported by year only; this prevented the use of more sophisticated statistical analyses (eg, interrupted time series analyses) and consequently a more detailed evaluation of the impact of each reform. Further, adjusting the standardised HCP rates for confounding was limited by the fact that population data by culturally and linguistically diverse status and remoteness were not available. The validity of the remoteness and socio‐economic disadvantage measures is limited by the mapping of data for multiple SA2s to each aged care planning region, which can include dozens of SA2s with widely differing IRSD and remoteness characteristics. The generalisability of our findings is limited to non‐Aboriginal and Torres Strait Islander people (3.8% of the Australian population). The coronavirus disease 2019 (COVID‐19) pandemic during the two most recent financial years included (2019–20, 2020–21) probably increased demand for home care (for example, because of fear of outbreaks in residential care facilities), possibly inflating our estimate of proportional demand for higher care level HCPs, particularly during 2020–21. However, our findings appear to be robust to this potential bias, as changes were consistent over several years, and the patterns of results are fairly consistent across the last three financial years investigated.
Conclusion
Despite substantial increases in the availability of HCPs in Australia, the 2013–20 program reforms have not met the demand for HCPs among older Australians, probably resulting in suboptimal support for their ageing‐in‐place preferences. Undersupply of higher level HCPs, especially in regional and remote areas, requires a clear response that increases both the availability of HCPs and the required workforce.
Box 1 – Home care packages (HCPs), Australia, 2008–09 to 2020–21: age‐ and sex‐standardised rates (per 1000 people aged 65 years or more), overall and by care level*
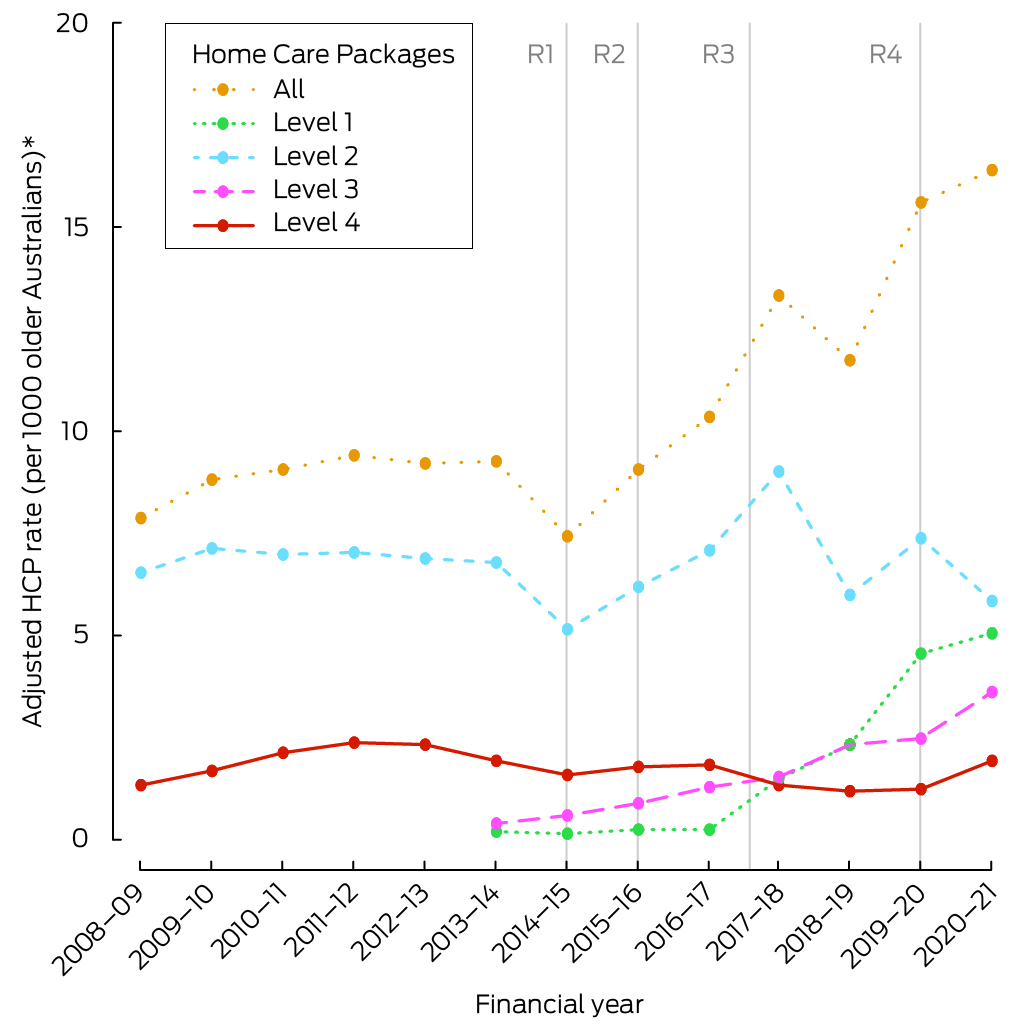
* The four‐level HCP system was introduced on 1 July 2013. R1 = reform 1 (income testing); R2 = reform 2 (consumer‐directed care); R3 = reform 3 (increasing choice); R4 = reform 4 (improving home care pricing information). Prior to 2013–14, Community Aged Care Packages were equivalent to the level 2 HCPs, Extended Aged Care at Home packages to level 4 HCPs.
Box 2 – Home care packages (HCPs) for Australians aged 65 years or older, 2013–14 and 2020–21: number and age‐ and sex‐standardised rates
|
Characteristic |
2013–14 |
2020–21 |
Change, 2013–14 v 2020–21 |
||||||||||||
|
Number of HCPs |
HCPs/1000 older people (standardised)* |
Number of HCPs |
HCPs/1000 older people (standardised)* |
Absolute change |
Change in proportion (percentage points) |
Change in standardised rate, points (95% CI) |
|||||||||
|
|
|||||||||||||||
|
Home care packages |
31 119 |
9.23 |
67 967 |
16.4 |
+36 848 |
|
+7.18 (7.02–7.34) |
||||||||
|
Level 1 |
669 (2.1%) |
0.19 |
20 997 (30.9%) |
5.05 |
+20 328 |
+28.8 |
+4.85 (4.78–4.92) |
||||||||
|
Level 2 |
22 766 (73.2%) |
6.75 |
24 038 (35.4%) |
5.82 |
+1272 |
–37.8 |
–0.93 (–1.05 to –0.82) |
||||||||
|
Level 3 |
1191 (3.8%) |
0.35 |
14 973 (22%) |
3.62 |
+13 782 |
+18.2 |
+3.26 (3.20–3.32) |
||||||||
|
Level 4 |
6493 (20.9%) |
1.93 |
7959 (11.7%) |
1.92 |
+1466 |
–9.2 |
–0.01 (–0.07 to 0.06) |
||||||||
|
Age group (years) |
|
|
|
|
|
|
|
||||||||
|
65–74 |
4967 (16.0%) |
1.48 |
12 086 (17.8%) |
2.82 |
+7119 |
+1.8 |
+1.34 (1.28–1.41) |
||||||||
|
75–84 |
13 034 (41.9%) |
3.93 |
28 578 (42.0%) |
6.86 |
+15 544 |
+0.1 |
+2.94 (2.83–3.04) |
||||||||
|
85 or older |
13 118 (42.1%) |
3.82 |
27 303 (40.2%) |
6.73 |
+14 185 |
–1.9 |
+2.90 (2.80–3.01) |
||||||||
|
Sex: women† |
19 654 (63.2%) |
5.80 |
41 732 (61.4%) |
10.3 |
+22 078 |
–1.8 |
+4.50 (4.37–4.63) |
||||||||
|
Culturally and linguistically diverse‡ |
3372 (10.8%) |
0.99 |
10 983 (16.2%) |
2.65 |
+7611 |
+5.4 |
+1.66 (1.60–1.72) |
||||||||
|
Remoteness of aged care planning region: not major cities§ |
8749 (28.1%) |
2.60 |
19 487 (28.7%) |
4.70 |
+10 738 |
+0.6 |
+2.10 (2.01–2.18) |
||||||||
|
|
|||||||||||||||
|
CI = confidence interval. * Adjusted for age and sex as appropriate (stratum‐specific estimates not adjusted for stratum variable). Crude rates are included in the Supporting Information, table 2; standardised rates by reform year are included in the Supporting Information, table 3. † Missing data: 2013–14, eight (< 0.1%); 2020–21, six (< 0.1%). ‡ People whose preferred language is not English. Missing data: 2013–14, 123 (0.4%); 2020–21, 1505 (2.2%). § Inner regional, outer regional, remote, and very remote categories. Missing data: 2013–14, 418 (1.3%); 2020–21, 193 (0.3%). |
|||||||||||||||
Box 3 – Home care packages (HCPs), Australia, 2013–14 to 2020–21: proportion by age group and care level*
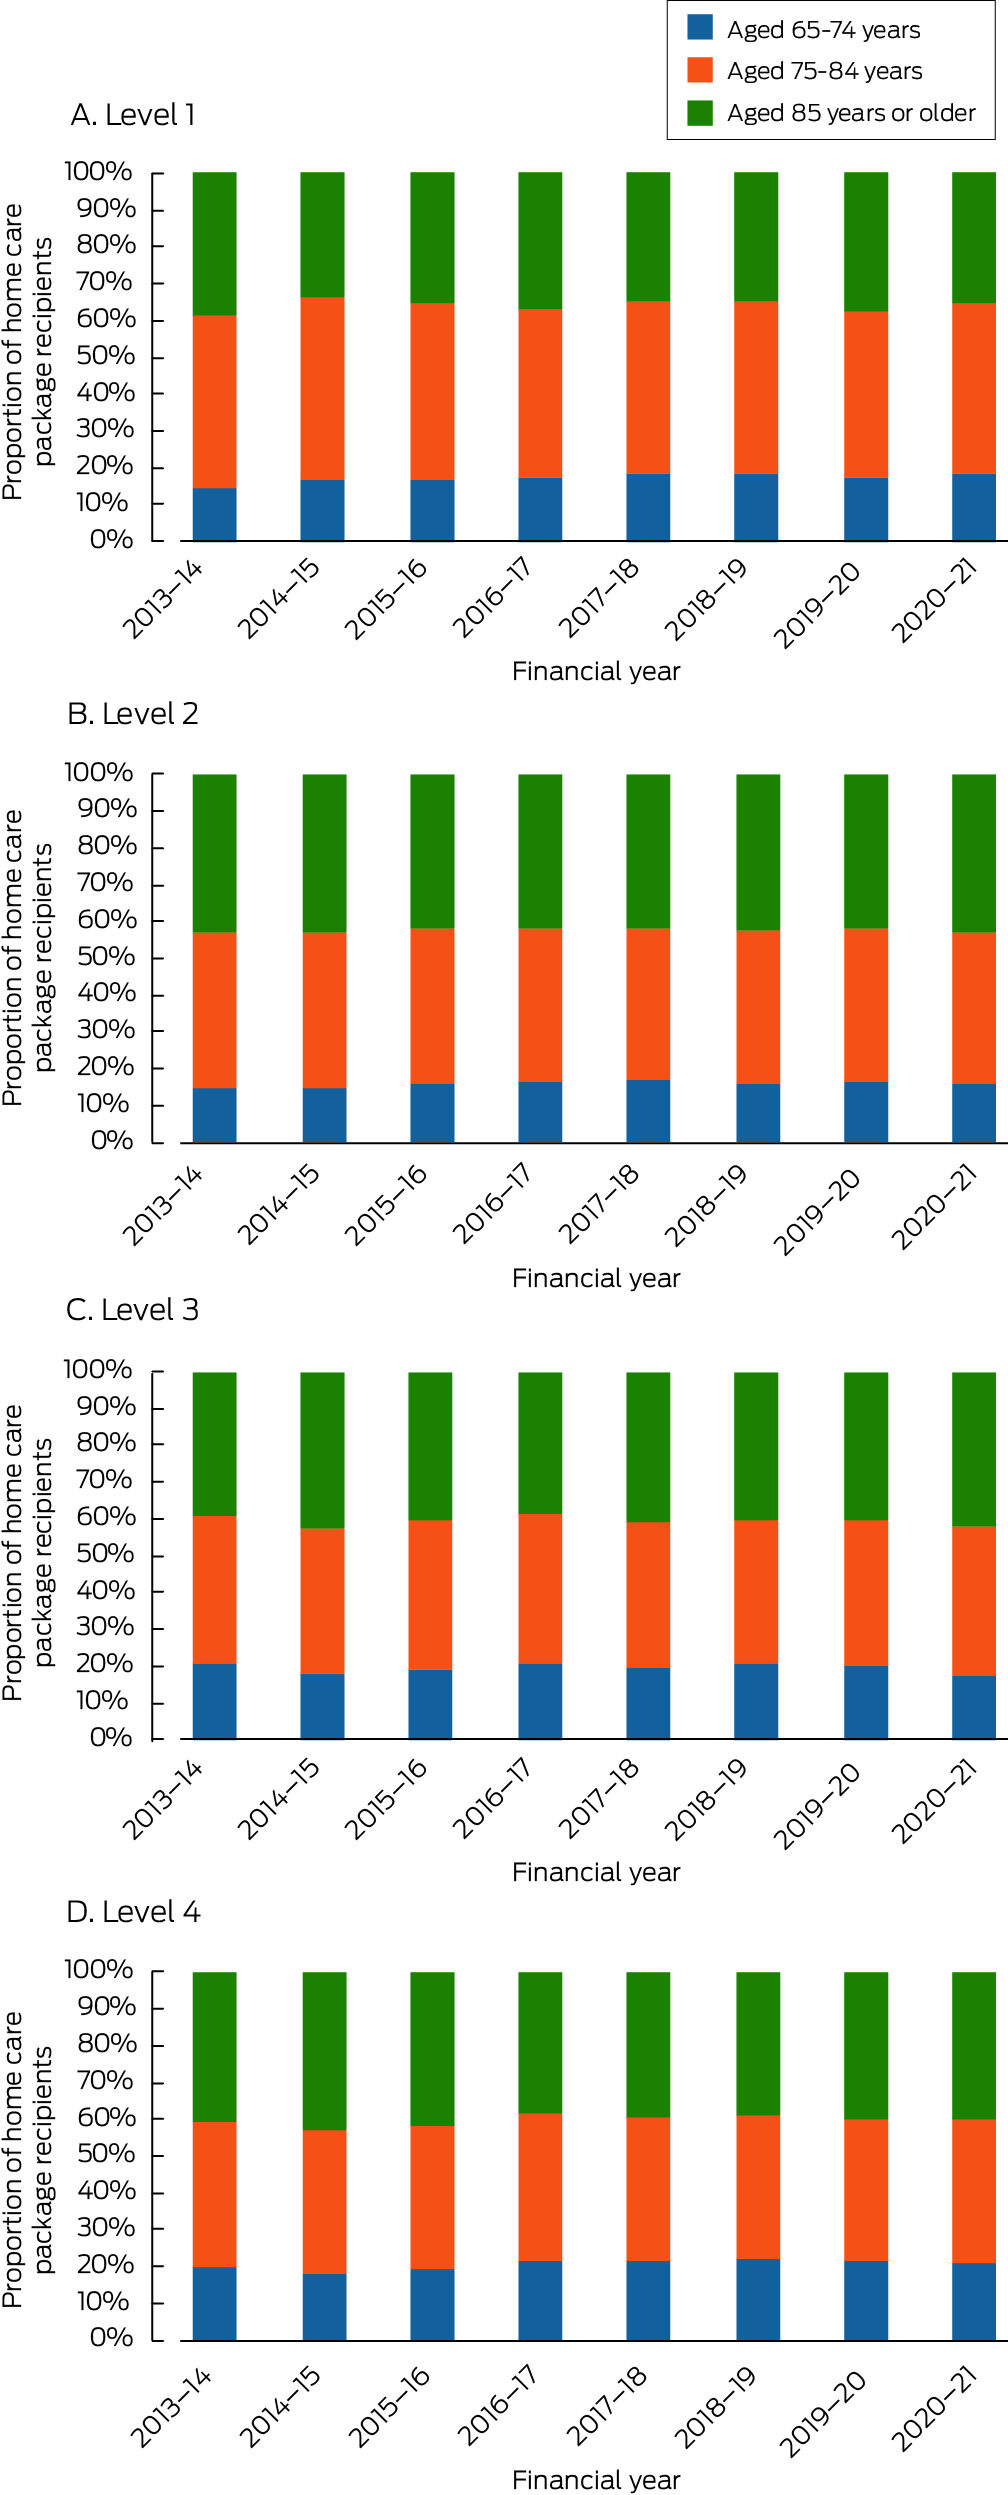
* The data for this graph are included in the Supporting Information, table 4.
Box 4 – Home care packages (HCPs), Australia, 2013–14 to 2020–21: proportions by selected characteristics*
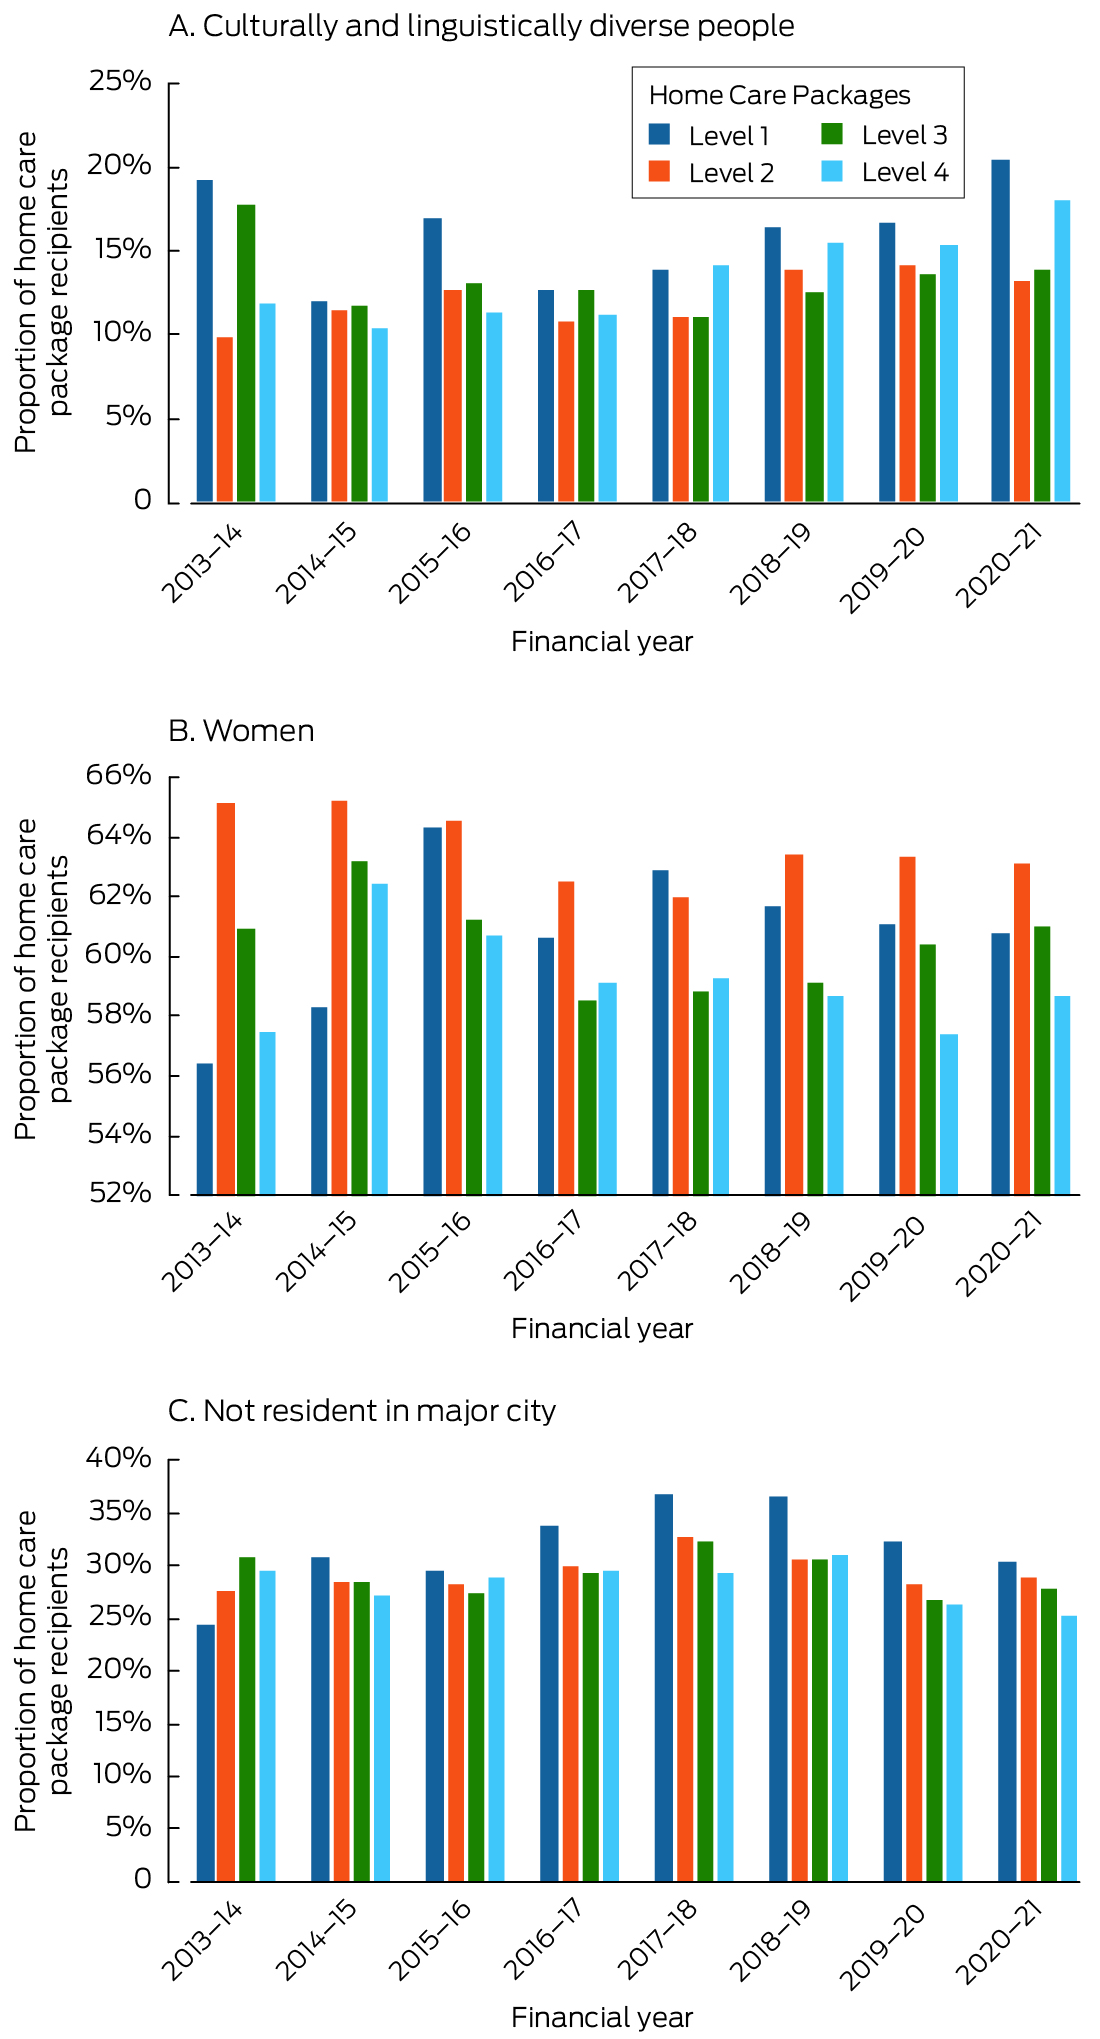
The data for this graph are included in the Supporting Information, table 4.
Box 5 – Proportional supply and demand of home care packages, 2018–19 to 2020–21, by care level*
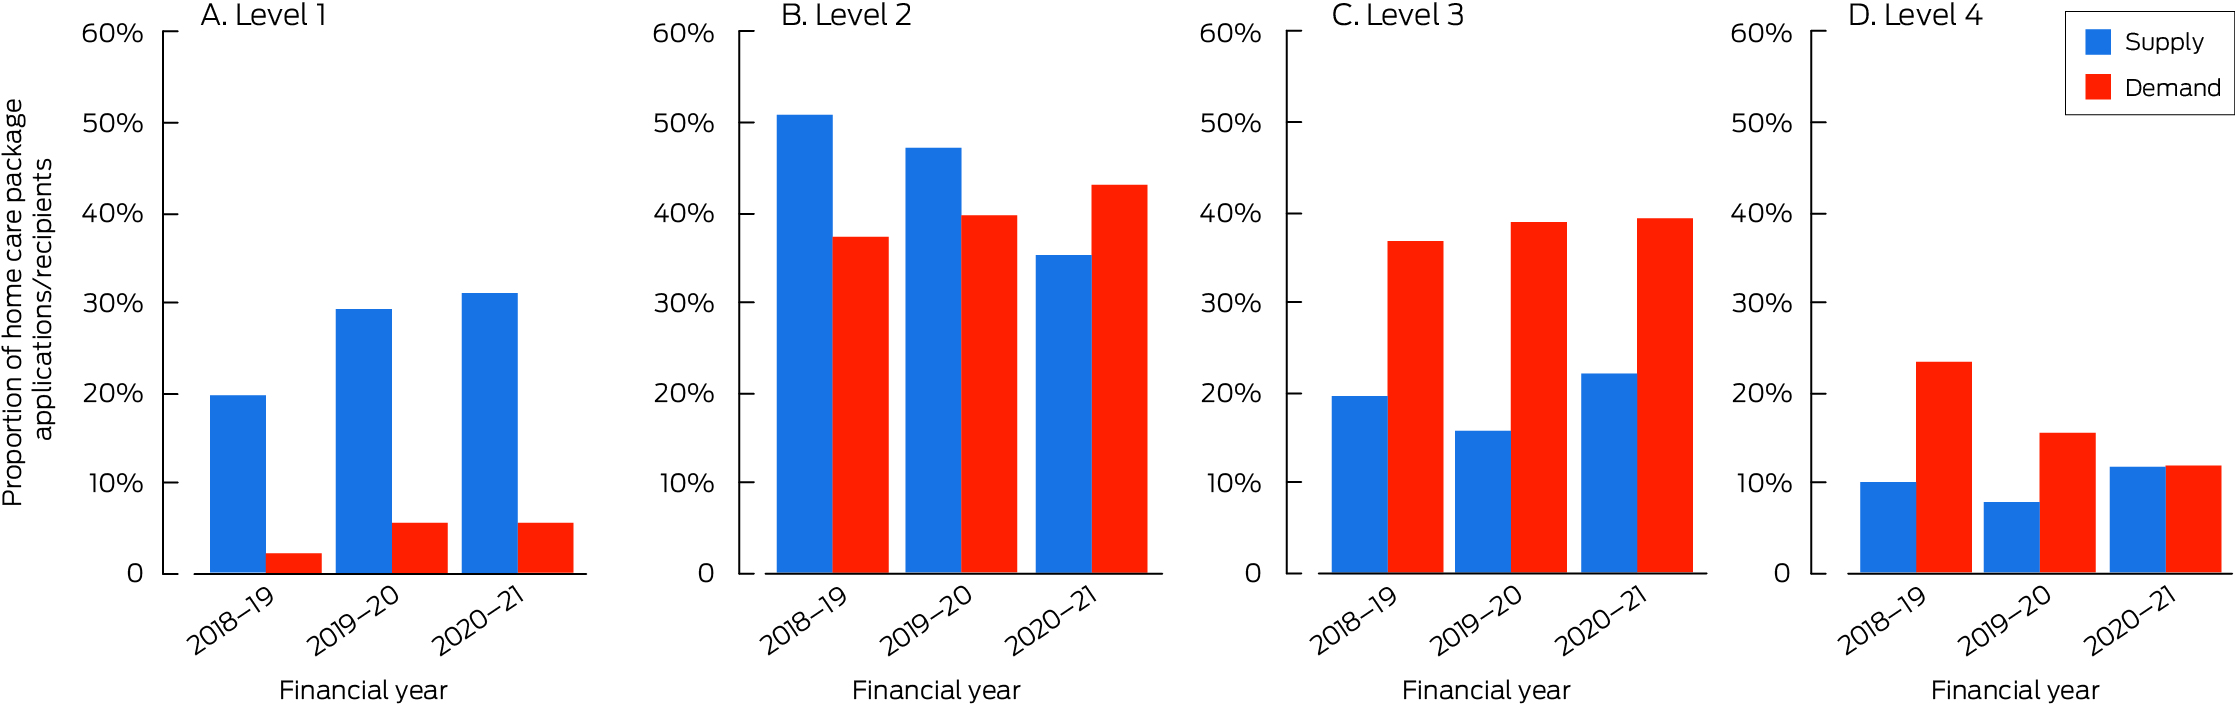
* Supply = HCPs provided at a care level as proportion of all HCPs provided; demand = number of people waiting for HCPs at a care level as proportion of all people waiting for HCPs. The required data were available only for 2018–19 to 2020–21. The data for this graph are included in the Supporting Information, table 7.
Received 29 March 2023, accepted 22 January 2024
- Johannes Schwabe1,2
- Gillian E Caughey1,2
- Steve L Wesselingh3
- Craig Whitehead4
- Renuka Visvanathan5
- Keith Evans1,5
- Maria C Inacio1,2
- 1 Registry of Senior Australians (ROSA), South Australian Health and Medical Research Institute, Adelaide, SA
- 2 University of South Australia, Adelaide, SA
- 3 South Australian Health and Medical Research Institute (SAHMRI), Adelaide, SA
- 4 Southern Adelaide Local Health Network, SA Health, Adelaide, SA
- 5 The University of Adelaide, Adelaide, SA
Open access:
Open access publishing facilitated by University of South Australia, as part of the Wiley – University of South Australia agreement via the Council of Australian University Librarians.
Data sharing:
All data underlying this report are publicly available and can be obtained from the cited sources. For more specific data sharing requests, please contact the first author.
This study was supported by a Medical Research Future Fund primary health care research grant (MRFF1200056), We thank all investigators involved in the research funded by this grant for their insights and contributions to this research.
No relevant disclosures.
- 1. Australian Department of Health and Aged Care. Aged care services. Undated. https://www.myagedcare.gov.au/aged‐care‐services (viewed Mar 2024).
- 2. Rose K, Kozlowski D, Horstmanshof L. Experiences of ageing in place in Australia and New Zealand: a scoping review. J Community Appl Soc Psychol 2023; 33: 623‐645.
- 3. Brim B, Fromhold S, Blaney S. Older adults’ self‐reported barriers to aging in place. J Appl Gerontol 2021; 40: 1678‐1686.
- 4. Martin D, Long O, Kessler L. Planning for aging in place: incorporating the voice of elders to promote quality of life. J Hous Elderly 2019; 33: 382‐392.
- 5. Australian Department of Health and Aged Care. My Aged Care assessment manual, version 6. 1 July 2024. https://www.health.gov.au/resources/publications/my‐aged‐care‐assessment‐manual?language=en (viewed July 2024).
- 6. Australian Department of Health and Aged Care. Home Care Packages. Undated. https://www.myagedcare.gov.au/help‐at‐home/home‐care‐packages (viewed July 2024).
- 7. StewartBrown. Aged care financial performance survey sector report: 12 months ended 30 June 2022; figure 20. 2022. https://www.stewartbrown.com.au/images/documents/StewartBrown_‐_Aged_Care_Financial_Performance_Survey_Sector_Report_June_2022.pdf (viewed Mar 2024).
- 8. Royal Commission into Aged Care Quality and Safety. Final report: Care, dignity, and respect. 26 Feb 2021. https://www.royalcommission.gov.au/aged‐care/final‐report (viewed July 2024).
- 9. Royal Commission into Aged Care Quality and Safety. Interim report: Neglect. 31 Oct 2019. https://agedcare.royalcommission.gov.au/publications/Documents/interim‐report/interim‐report‐volume‐1.pdf (viewed July 2024).
- 10. Visvanathan R, Amare AT, Wesselingh S, et al. Prolonged wait time prior to entry to home care packages increases the risk of mortality and transition to permanent residential aged care services: findings from the Registry of Older South Australians (ROSA). J Nutr Health Aging 2019; 23: 271‐280.
- 11. Australian Department of Social Services. Reforming the aged care system. Financial changes to home care packages. 2014. https://www.dss.gov.au/sites/default/files/documents/05_2014/att_b_financial_changes_0.pdf (viewed July 2024).
- 12. Australian Department of Health. Increasing choice in home care. Updated 19 July 2017. Archived: https://webarchive.nla.gov.au/awa/20190208044558/https://agedcare.health.gov.au/increasing‐choice‐in‐home‐care (viewed Mar 2023).
- 13. Australian Department of Health and Aged Care. Home Care Packages Program reforms. Canberra: Department of Health and Aged Care, 2022. Updated Apr 2021. Archived: https://webarchive.nla.gov.au/awa/20221128191915/https://www.health.gov.au/topics/aged‐care/aged‐care‐reforms‐and‐reviews/home‐care‐packages‐program‐reforms (viewed July 2024).
- 14. Department of the Prime Minister and Cabinet. Attachment B: Response to Royal Commission into Aged Care Quality and Safety interim report. June 2022. https://pmtranscripts.pmc.gov.au/sites/default/files/2022‐06/attachment‐b‐response‐to‐royal‐commission‐interim‐report.pdf (viewed July 2024).
- 15. Australian Department of Health and Aged Care. Support at Home program. Updated 27 Feb 2024. https://www.health.gov.au/our‐work/support‐at‐home (viewed July 2024).
- 16. Australian Institute of Health and Welfare. GEN aged care data. https://www.gen‐agedcaredata.gov.au/resources/access‐data/2024/july/gen‐data‐admissions‐into‐aged‐care (viewed July 2024).
- 17. Department of Health and Aged Care. Home care packages program data report 1 January – 31 March 2021. June 2021. https://www.gen‐agedcaredata.gov.au/resources/reports‐and‐publications/2021/june/home‐care‐packages‐program‐data‐report‐1‐january‐–‐31‐march‐2021 (viewed Mar 2023).
- 18. Australian Bureau of Statistics. Estimated resident population, in .StatData Explorer. https://explore.data.abs.gov.au/?fs[0]=People%2C1%7CPopulation%23POPULATION%23%7CEstimated%20Resident%20Population%23ERP%23&pg=0&fc=People (viewed Mar 2023).
- 19. Australian Institute of Health and Welfare. Australian Statistical Geography Standard (ASGS), volume 5. Remoteness structure, July 2016 (1270.0.55.005). 16 Mar 2018. https://www.abs.gov.au/ausstats/abs@.nsf/Latestproducts/1270.0.55.005Main%20Features1July%202016?opendocument&tabname=Summary&prodno=1270.0.55.005&issue=July%202016&num=&view= (viewed Mar 2023).
- 20. Australian Bureau of Statistics. IRSD. In: Census of Population and Housing: Socio‐Economic Indexes for Areas (SEIFA), Australia, 2011 (2033.0.55.001). 28 Mar 2013. https://www.abs.gov.au/ausstats/abs@.nsf/Lookup/2033.0.55.001main+features100052011 (viewed Mar 2023).
- 21. Gibson D. Aged care employment and the productivity commission: fixing the data gaps may be the most useful thing it can do. Australas J Ageing 2022; 41: 573‐578.
- 22. Khadka J, Lang C, Ratcliffe J, et al. Trends in the utilisation of aged care services in Australia 2008–2016. BMC Geriatr 2019; 19: 213.
- 23. Worley P. Why we need better rural and remote health, now more than ever. Rural Remote Health 2020; 20: 5976.
- 24. Gibson D, Braun P, Liu Z. Spatial equity in the distribution of aged care services in Australia. Australas J Ageing 2002; 21: 80‐86.
- 25. Australian Department of Health and Aged Care. Home Care Package costs and fees. Undated. https://www.myagedcare.gov.au/home‐care‐package‐costs‐and‐fees (viewed Mar 2023).
Abstract
Objectives: To assess changes following the 2013–21 Home Care Package (HCP) reforms in the rate of HCPs provided to Australians aged 65 years or older, the characteristics of people who have received HCPs, and the capacity of the program to meet demand for its services during 2018–21.
Study design: Repeated cross‐sectional population‐based study; analysis of Australian Institute of Health and Welfare GEN Aged Care and Australian Department of Health Home Care Packages program data.
Setting, participants: HCPs provided to non‐Indigenous Australians aged 65 years or older, 2008–09 to 2020–21.
Main outcome measures: Changes in age‐ and sex‐standardised HCP rates (number per 1000 older people) and changes in proportions of recipients for selected characteristics, 2013–14 to 2020–21, overall and by care level; correspondence of proportional HCP supply and demand, 2018–19 to 2020–21, by care level.
Results: A total of 490 276 HCPs were provided during 2008–21. The age‐ and sex‐standardised HCP rate rose from 9.23 per 1000 people aged 65 years or more in 2013–14 to 16.4 per 1000 older people in 2020–21. The increases in age‐ and sex‐standardised HCP rate between 2013–14 and 2020–21 were greatest for level 1 (from 0.19 to 5.05 per 1000 older people) and level 3 HCPs (from 0.35 to 3.62 per 1000 older people); the rate for level 2 HCPs declined from 6.75 to 5.82 per 1000 older people, and that for level 4 HCPs did not change. The proportion of culturally and linguistically diverse recipients rose from 10.8% to 16.2%; the overall proportion of recipients living outside major cities rose slightly, from 28.1% to 28.7%, but declined for higher care level HCPs (level 3: from 30.8% to 27.8%; level 4: from 29.6% to 25.2%). During 2018–19 to 2020–21, the proportions of lower level (1 and 2) HCPs generally exceeded demand, while the supply of higher level (3 and 4) HCPs generally fell short of demand.
Conclusions: Despite the increased overall availability of HCPs, the supply of higher care level HCPs is still lower than the demand, probably contributing to suboptimal support for the ageing‐in‐place preferences of older Australians, especially in regional and remote areas.