


The known: Spirometry, critical for diagnosing lung conditions, relies on reference equations that reflect normal values for the relevant population. No validated equations are available for First Nations Australians.
The new: Analysis of spirometry data for 1467 healthy First Nations children and adults indicated that the Global Lung Function Initiative (GLI)‐2012 other/mixed and the race‐neutral GLI‐2022 global reference equations can be used to assess lung function in First Nations people. Mean spirometry values were poorer in rural and remote than in urban areas.
The implications: Until more data from urban areas are available, the race‐neutral GLI‐2022 global and GLI‐2012 other/mixed reference equations are appropriate for assessing lung function in First Nations Australians.
Spirometry, a widely used lung function test, is recommended when assessing the respiratory system for the diagnosis and monitoring of airway obstruction.1 Interpreting spirometry findings requires appropriate reference values. Age, height, sex, and ethnic background influence spirometry values, and are therefore taken into account by the Global Lung Function Initiative (GLI)‐20122 reference equations, the most widely used and recommended in Australian3 and overseas guidelines.4 Equations for four ethnic groups are defined (Caucasian, North East Asian, South East Asian, African American); a fifth equation, for “other/mixed”, is used for people who are of mixed ethnic background or do not fit one of the other four categories.2 The other/mixed equation is recommended when testing Aboriginal and Torres Strait Islander (First Nations) Australians.3 To overcome ethnic bias inherent to these reference equations, a new GLI reference equation (GLI‐2022 global) was developed using a race‐neutral approach.5
Given the high respiratory disease burden for First Nations Australians,6,7 and the reliance on spirometry for diagnosing and monitoring chronic respiratory disease, it is important that reference values reflect the respiratory characteristics of healthy First Nations people. Earlier attempts to determine reference ranges have included unhealthy participants or people who smoked8,9,10,11,12 and inadequate numbers of tested people.9,10,11,12 Reported spirometry values for First Nations Australians have been 20–30% lower than for other Australians.8,9,10,11,12,13 Using reference spirometry equations based on these findings risks interpreting abnormal lung function as normal for First Nations Australians.
In an earlier study, we found that spirometry values for 930 healthy children and young adults, predominantly from rural and remote Queensland, were 7–8% lower than predicted by the GLI‐2012 Caucasian equation, and that the GLI‐2012 other/mixed reference equation provided a better overall fit.14 While most Australians (including First Nations people) live in metropolitan areas, larger proportions of First Nations people than of other Australians reside in rural or remote areas.15 Socio‐economic factors influence lung function,16,17 and comparisons of urban and rural and remote First Nations Australians have not been reported.
Underestimating normal spirometry values for First Nations Australians increases the risks of underdiagnosis and disease misclassification, and robust data from healthy First Nations people are needed to develop appropriate spirometry reference equations for this population. For our study, we combined previously collected data for First Nations children14 with newly collected data for children and adults in urban and rural or remote locations across Australia. Our objectives were to determine whether the GLI‐2012 other/mixed or GLI‐2022 global reference equations are appropriate for assessing First Nations people at different ages, and whether spirometry values for rural or remote people differ from those of urban First Nations people.
Methods
We undertook a cross‐sectional study of spirometry values for opportunistically recruited First Nations Australian children and adults from three prospective studies:
- the Indigenous Respiratory Reference Values (IRRV) study14 included First Nations children and young adults aged 3–25 years, recruited predominantly in childcare centres and schools in nine Queensland and Northern Territory communities during 18 March 2015 – 24 November 2017;
- the Healthy Indigenous Lung Function Testing in Adults (HILTA) study included First Nations adults (18 years or older) from six Queensland and Northern Territory, communities recruited during 14 August 2019 – 15 December 2022, as well as adults who visited Indigenous respiratory outreach care clinics (a specialist respiratory outreach service in rural and remote Queensland) for free respiratory health checks; and
- the Western Australian Many Healthy Lungs (MHL) study included First Nations children and adults (aged five years or older) from Perth, Broome, and the Kimberley recruited during 10 October 2018 – 7 November 2021.
Participant recruitment and classification as healthy or not healthy
In each of the three studies, a testing stall or booth was set up in each community or at each testing event; all community members could ask questions and undergo testing. For IRRV recruitment in schools, information and consent forms were distributed to parents and carers, and signed consent forms returned prior to the testing days. Local radio stations and community networks promoted participation in the IRRV and HILTA studies; community networks and social media promoted the MHL study.
Participants were assigned to the “healthy” group if they met all inclusion criteria (Box 1), and otherwise to the “not healthy” group. They were classified as urban (Brisbane, Darwin, Perth, Caboolture, Townsville) or rural or remote residents (Dalby, Cherbourg, Bamaga, Woorabinda, Thursday Island, Broome, and four Aboriginal communities in the Kimberley) according to the testing location. Body mass index (BMI) criteria were applied to participants aged 30 years or older because obesity affects lung function;18 as many participants were recruited at sporting events featuring young athletes with greater muscle mass, BMI criteria were not applied to people under 30 years of age. Spirometry data were included in our analysis if they satisfied 2019 American Thoracic Society (ATS) and European Respiratory Society (ERS) criteria for acceptability and repeatability.4,19
Statistical analysis
We summarise demographic characteristics as medians with interquartile ranges (IQRs). Z‐scores (number of standard deviations [SDs] of values from the mean) and percentage‐predicted spirometry test values were generated with the GLI‐2012 Caucasian and other/mixed reference equations2 and the GLI‐2022 global reference equation6 (Supporting Information, part 1), using a custom calculator. Mean Z‐scores (with SDs) for male and female participants in each of three ethnic categories (Aboriginal, Torres Strait Islander, Aboriginal and Torres Strait Islander) were calculated. Mean Z‐scores of zero (maximum of ±0.5), an SD of one, and about 90% of results falling within 1.64 SDs of the mean was deemed to indicate a good fit to the sample data.14 The GLI conversion software (GLI2012_DataConversion, version 1.3.4, build 420) was used to calculate L (skewness), S (variation), and M coefficients (predicted mean respiratory function value for a given combination of age and height, within the GLI‐2012 bounds) for the healthy and not healthy groups.
We undertook multivariable ordinary least‐squares linear regression analyses including age, sex, and height as explanatory variables to assess whether these factors were sufficiently taken into account by each reference equation (model A). In model B, remoteness (urban or rural/remote) was also included as a variable. Data were analysed in Stata 17; P < 0.05 (2‐tailed) was deemed statistically significant.
Ethics approval and First Nations community approval
The human research ethics committees of Education Queensland (15/192648), Children's Health Queensland (HREC/14/QRCH/111), Far North Queensland (Cairns and Hinterland Hospital and Health Service) (HREC/14/QCH/96‐929), Darling Downs Health (HREC/15/QTDD/27), and the Menzies School of Health Research (HREC‐2017‐2833) approved the IRRV and HILTA studies. The Western Australian Aboriginal Health Ethics Committee (HREC707) and the Curtin University human research ethics committee (HR89/2016) approved the MHL study. Community Elders and First Nations leaders at all locations were consulted and approved the studies prior to commencement.
Results
Acceptable and repeatable forced expiratory volume in the first second (FEV1) values were available for 2700 First Nations participants in the three trials; 1062 of 1359 children under 18 years of age (78%) and 405 of 1341 adults (30%) with such values were classified as healthy (Box 2). Compared with the healthy group, the median age of participants classified as not healthy was higher (40 [IQR, 19–55] v 12 [IQR, 9–19] years), and larger proportions were female participants (63% v 52%) or Aboriginal people (ie, no Torres Strait Islander background; 72% v 54%) (Box 3).
Acceptable and repeatable forced vital capacity (FVC) values were available for 1294 of the 1467 healthy participants (88%) and 1185 of the 1233 participants classified as not healthy (96%). In almost all the cases in which FVC values were not acceptable or repeatable, participants did not meet the volume plateau criterion (≤ 0.025 L volume change in the final second of expiration4).
Spirometry value distributions and GLI reference equations
The median age of the healthy group participants was 12 years (IQR, 9–19 years; range, 3–91 years); 768 (52%) were girls or women (Box 3; Supporting Information, figure 1). The distributions by age of FEV1, FVC, and FEV1/FVC values for healthy participants differed by sex (Box 4). The distribution by age of Z‐scores generated from these values indicated that the goodness of fit of each reference equation declined with age for both FEV1 and FVC, but improved for FEV1/FVC (Box 5). Lung function Z‐score density plots for the healthy and not healthy groups were better centred on zero for the GLI‐2022 global equation than the GLI‐2012 other/mixed equation (Supporting Information, figure 2).
Mean FEV1, FVC, and FEV1/FVC Z‐scores were smaller for the not healthy group than the healthy group (Box 3). Using the GLI‐2012 other/mixed equation, mean FEV1 (–0.99; 95% confidence interval [CI], –1.10 to –0.88) and FVC Z‐scores (–1.13; 95% CI, –1.24 to –1.02) were lower for people over 30 years of age with BMI values exceeding 30 kg/m2 than for other participants.
The GLI‐2012 other/mixed and GLI‐2022 global equations each provided good fits to the pooled spirometry data for the healthy group, but the distributions were better centred on zero using the GLI‐2012 other/mixed equation, as indicated by mean Z‐scores generally closer to zero (exceptions: FVC for the both Aboriginal and Torres Islander group; FEV1/FVC for the Aboriginal and both Aboriginal and Torres Islander groups) and the greater similarity of the proportions of values beyond the upper and lower limits of normal (Supporting Information, table 1). The GLI‐2012 Caucasian equation overestimated FEV1 and FVC values by about 9% and FEV1/FVC values by about 1% in healthy participants; in the not healthy group, it overestimated FEV1 by about 20%, FVC by 18%, and FEV1/FVC by 3% (Supporting Information, table 2).
Age, sex, and remoteness
In models adjusted for age, sex, height, and remoteness the overall fit of FEV1 and FVC values by age to the spirometry data for the healthy group was better with the GLI‐2022 global equation than with the GLI‐2012 other/mixed equation (for example: estimated differences FEV1 per 10 years: –0.04 [95% CI, –0.08 to –0.00] v –0.10 [95% CI, –0.15 to –0.06). Fit of FEV1 and FVC values by sex was good with both equations. The influence of height on FEV1 and FVC values was overestimated by the GLI‐2012 other/mixed equation, but not the race‐neutral GLI‐2022 global reference equation (for example: estimated differences FEV1 per 10 cm height: –0.03 [95% CI, –0.06 to 0.00] v –0.00 [95% CI, –0.00 to 0.00) (Box 6).
With the GLI‐2012 other/mixed reference equation, mean FEV1 (estimated difference, –0.34; 95% CI, –0.46 to –0.22) and FVC Z‐scores (estimated difference, –0.45; 95% CI, –0.59 to –0.32) were lower for rural or remote than for urban participants, but their mean FEV1/FVC Z‐score was higher (estimated difference, 0.14; 95% CI, 0.03–0.25) (Box 6). Using the GLI‐2012 other/mixed reference equation, the difference between values for urban and rural remote participants increased with age for FEV1 (per 10 years, 0.15; 95% CI, 0.07–0.23) and FVC Z‐scores (per 10 years, 0.16; 95% CI, 0.07–0.25), but not FEV1/FVC Z‐scores (per 10 years, 0.02; 95% CI, –0.06 to 0.09).
Discussion
We found that both the GLI‐2012 other/mixed and GLI‐2022 global reference equations provided good overall fits to spirometry data for 1467 healthy First Nations people aged 3–91 years. The overall fit was better with the GLI‐2012 other/mixed equation, but our modelling of Z‐scores adjusted for age, sex, and height indicated that the GLI‐2022 global equation better accounted for the influence of ageing on FEV1 and FVC values.
Our findings were made in a rigorously screened sample of First Nations people without respiratory disease or symptoms who had never smoked, were not obese, and whose spirometry values satisfied ATS/ERS criteria4,19 for acceptability and repeatability. We found that the GLI‐2012 Caucasian equation overestimated FEV1 and FVC values by about 9% in healthy First Nations participants. The spirometry values for the not healthy participants we excluded were 18–20% lower than predicted by the GLI‐2012 Caucasian equation, a difference similar to previously reported putatively normative findings.12,13 Finally, we found that spirometry values for rural or remote First Nations people were lower than for urban participants, and that the difference increased with age.
As Z‐scores generated with the GLI‐2012 other/mixed and GLI‐2022 global reference equations take into account the influence of age, sex, and height on spirometry values, we examined these associations in our sample of healthy First Nations Australians. We found that the age‐related decline in FEV1 and FVC values is overestimated in this population when using the GLI‐2012 other/mixed equation; the influence of height on FEV1 and FVC values was also overestimated by the GLI‐2012 other/mixed equation, but not the race‐neutral GLI‐2022 global reference equation. We have previously reported that the body proportions of First Nations children are different to those of children who participated in the Third National Health and Nutrition Examination Survey; for example, sitting height comprises a smaller proportion of standing height.21
The value of ethnicity‐based corrections of clinical algorithms is controversial, and abandoning ethnicity‐based spirometry reference values has been suggested.22,23,24 Even if reference data are representative of healthy people, ethnic correction entails several other problems, including inadequate consideration of differences in socio‐economic standing when surveying ethnic populations, which may normalise atypical results in disadvantaged groups.
Limitations
We did not analyse the impact of socio‐economic determinants of respiratory function. Mean lung function values were lower for rural and remote than urban participants, indicating that social and environmental factors affect lung function; however, remoteness classification in our study was based on the location of testing and not of the participant's residence. The spirometry data we analysed were collected in urban and rural or remote communities in three states and territories, but the generalisability of our findings is limited by the unknown broader representativeness of our sample.
Conclusion
The development of the race‐neutral GLI‐2022 global reference equation is an important step toward reducing the influence of simplistic concepts of race and ethnicity.5 Our findings suggests that this reference equation is suitable for assessing respiratory function in First Nations Australians and modelling the influence of age and height on spirometry values in this population. The GLI‐2012 other/mixed and GLI‐2022 global reference equations each provided good fits to the spirometry data, but the GLI‐2022 global equations better accounted for the influence of ageing on FEV1 and FVC values, and of height on FVC. While the GLI‐2012 other/mixed equation is acceptable for assessing First Nations Australians, we recommend the race‐neutral GLI‐2022 global reference equation, given the general shift from ethnicity‐based corrections in other fields of medicine. Investigation of the influence of social factors on spirometry values are important next steps, as are the further collection of data from First Nations people in urban areas and evaluation of the performance of these reference equations in respiratory screening and diagnosis.
Box 1 – Inclusion criteria for the healthy group in the three spirometery studies contributing data to our analysis
|
Category |
Criteria |
||||||||||||||
|
|
|||||||||||||||
|
Spirometry |
Spirometry testing quality meets American Thoracic Society and European Respiratory Society standards.4,19 |
||||||||||||||
|
Respiratory disease |
No physician‐confirmed respiratory disease recorded in participant questionnaires or medical records. |
||||||||||||||
|
Symptoms |
No respiratory symptoms recorded in study questionnaires (difficulty breathing, dyspnoea, wheeze) during the preceding twelve months. |
||||||||||||||
|
Body mass index (BMI) |
No greater than 30 kg/m2 for participants aged 30 years or older. |
||||||||||||||
|
Smoking |
Total lifetime cigarettes smoked fewer than 100 (cigarettes per day multiplied by estimated number of days smoking). |
||||||||||||||
|
|
|||||||||||||||
|
|
|||||||||||||||
Box 2 – Selection of participants for inclusion in our analysis, and their categorisation as healthy or not healthy
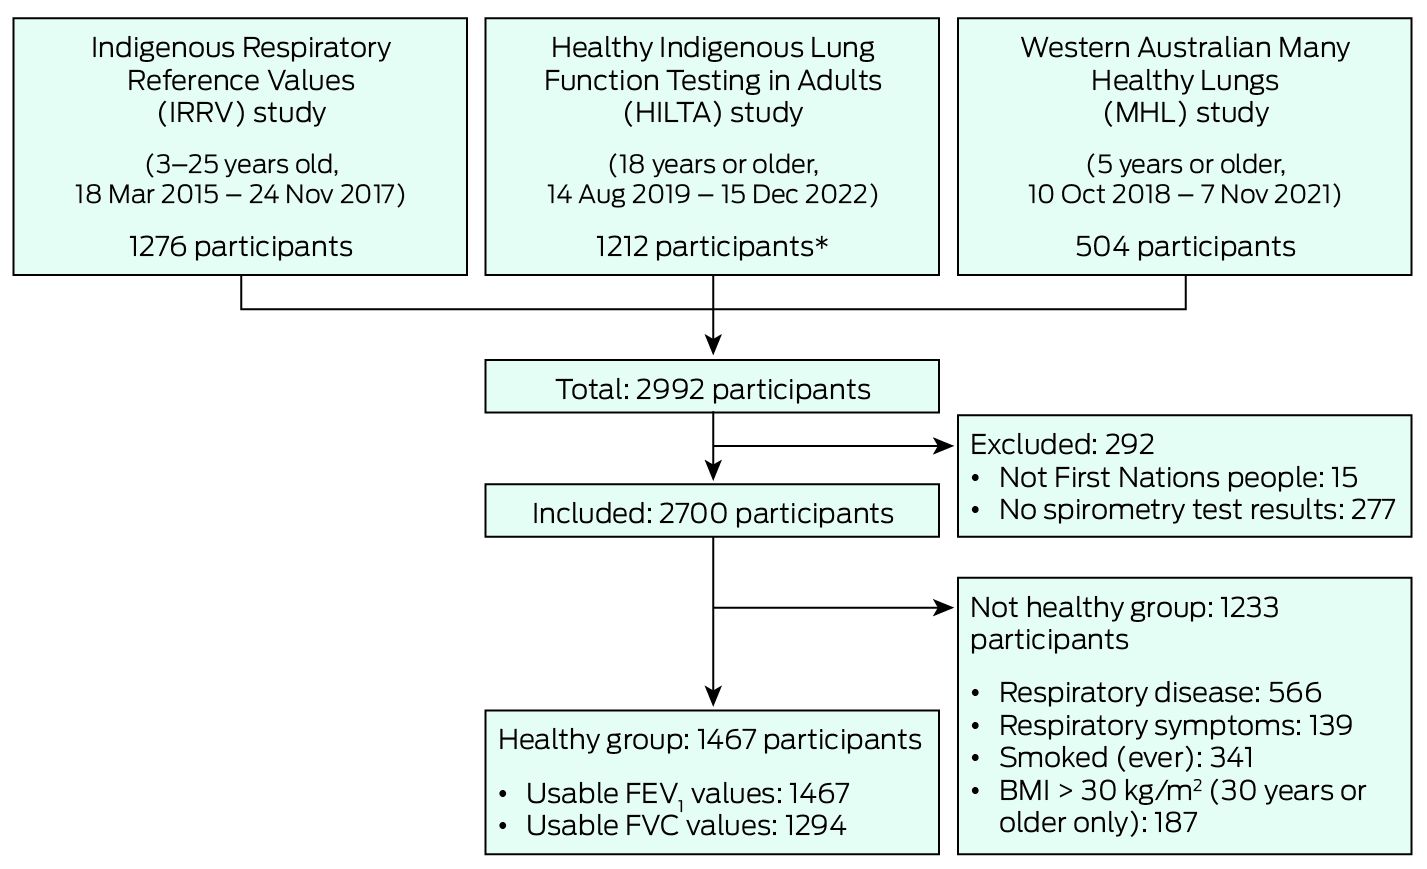
BMI = body mass index; FEV1 = forced expiratory volume in the first second; FVC = forced vital capacity.* Among the 1212 HILTA participants initially included in our study were 56 of 570 people who had undergone respiratory health checks at outreach clinics.
Box 3 – Demographic characteristics and spirometry values (by GLI reference equation) for the 1467 healthy and 1233 not healthy First Nations participants*
|
|
Healthy |
|
|||||||||||||
|
Characteristic |
All |
Urban |
Rural or remote |
Not healthy† |
|||||||||||
|
|
|||||||||||||||
|
Participants |
1467 |
454 |
1013 |
1233 |
|||||||||||
|
Age (years), median (IQR) |
12 (9–19) |
20 (12–26) |
11 (8–15) |
40 (19–55) |
|||||||||||
|
Sex (female) |
768 (52%) |
247 (54%) |
521 (51%) |
774 (63%) |
|||||||||||
|
Height (cm), median (IQR) |
155 (133–166) |
164 (152–175) |
147 (129–162) |
163 (157–171) |
|||||||||||
|
Ethnic background |
|
|
|
|
|||||||||||
|
Aboriginal |
799 (54%) |
391 (86%) |
408 (40%) |
893 (72%) |
|||||||||||
|
Torres Strait Islander |
354 (24%) |
26 (6%) |
328 (32%) |
207 (17%) |
|||||||||||
|
Aboriginal and Torres Strait Islander |
314 (21%) |
37 (8%) |
277 (27%) |
133 (11%) |
|||||||||||
|
GLI‐2012 Caucasian, mean (SD) |
|
|
|
|
|||||||||||
|
FEV1 Z‐score |
–0.64 (0.96) |
–0.51 (0.96) |
–0.70 (0.95) |
–1.40 (1.17) |
|||||||||||
|
FEV1 % predicted |
92% (12) |
94% (12) |
91% (12) |
81% (17) |
|||||||||||
|
FVC Z‐score |
–0.63 (0.95) |
–0.46 (0.98) |
–0.72 (0.93) |
–1.34 (1.17) |
|||||||||||
|
FVC % predicted |
92% (12) |
95% (12) |
91% (11) |
82% (16) |
|||||||||||
|
FEV1/FVC Z‐score |
–0.08 (0.86) |
–0.14 (0.85) |
–0.04 (0.86) |
–0.24 (1.06) |
|||||||||||
|
GLI‐2012 other/mixed, mean (SD) |
|
|
|
|
|||||||||||
|
FEV1 Z‐score |
–0.08 (1.02) |
0.07 (1.03) |
–0.16 (1.01) |
–0.94 (1.27) |
|||||||||||
|
FEV1 % predicted |
99% (13) |
101% (13) |
98% (13) |
87% (18) |
|||||||||||
|
FVC Z‐score |
0.02 (1.07) |
0.22 (1.11) |
–0.07 (1.04) |
–0.83 (1.34) |
|||||||||||
|
FVC % predicted |
100% (13) |
103% (13) |
99% (12) |
89% (17) |
|||||||||||
|
FEV1/FVC Z‐score |
–0.25 (0.90) |
–0.31 (0.90) |
–0.22 (0.90) |
–0.41 (1.13) |
|||||||||||
|
GLI‐2022 global, mean (SD) |
|
|
|
|
|||||||||||
|
FEV1 Z‐score |
–0.27 (0.90) |
–0.08 (0.91) |
–0.36 (0.88) |
–0.80 (1.06) |
|||||||||||
|
FEV1 % predicted |
96% (12) |
99% (12) |
95% (12) |
87% (16) |
|||||||||||
|
FVC Z‐score |
–0.21 (0.89) |
0.04 (0.93) |
–0.33 (0.84) |
–0.65 (1.04) |
|||||||||||
|
FVC % predicted |
97% (12) |
101% (13) |
96% (11) |
90% (15) |
|||||||||||
|
FEV1/FVC Z‐score |
–0.12 (0.87) |
–0.21 (0.88) |
–0.08 (0.86) |
–0.33 (1.06) |
|||||||||||
|
|
|||||||||||||||
|
FEV1 = forced expiratory volume in the first second; FVC = forced vital capacity; GLI = Global Lung Function Initiative; IQR = interquartile range; SD = standard deviation. * FVC and FEV1/FVC values are reported for 1294 healthy and 1185 not healthy participants. † Testing location: 324 urban, 909 rural or remote. |
|||||||||||||||
Box 4 – Spirometry value distributions for healthy First Nations participants, by age*
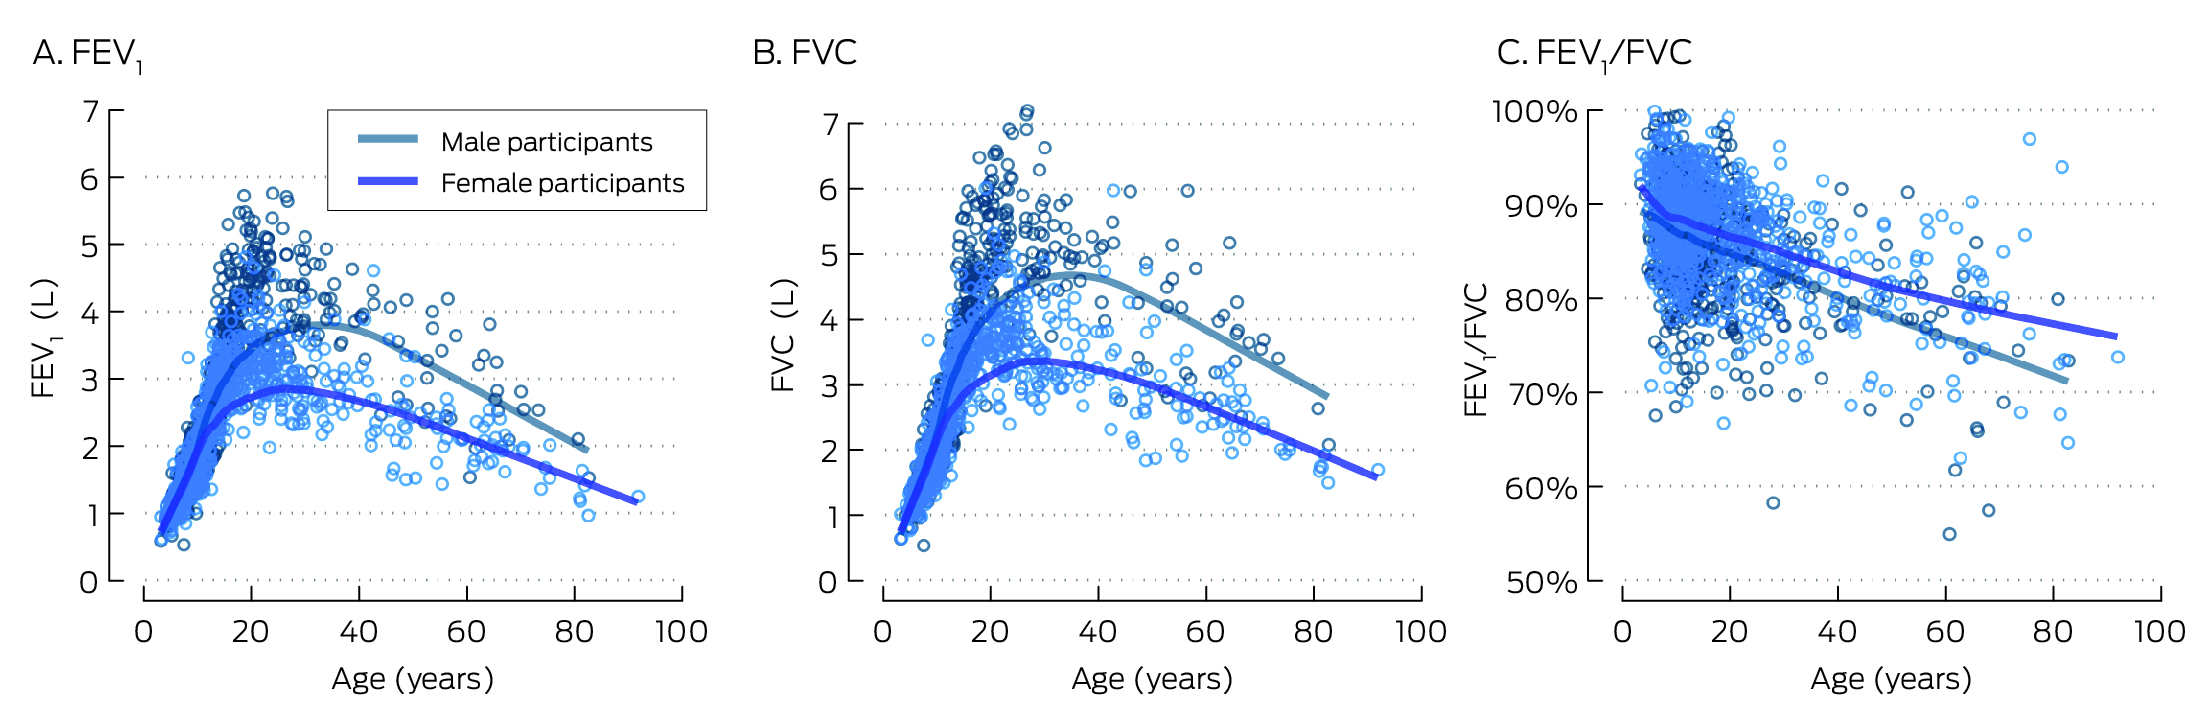
FEV1 = forced expiratory volume in the first second; FVC = forced vital capacity.* Locally weighted smoothed curves; FEV1 values are reported for 1467 healthy participants (768 female, 699 male participants), FVC and FEV1/FVC values for 1294 healthy participants (683 female, 611 male participants).
Box 5 – Z‐scores generated from spirometry value distributions for healthy First Nations participants, by age and GLI reference equation*
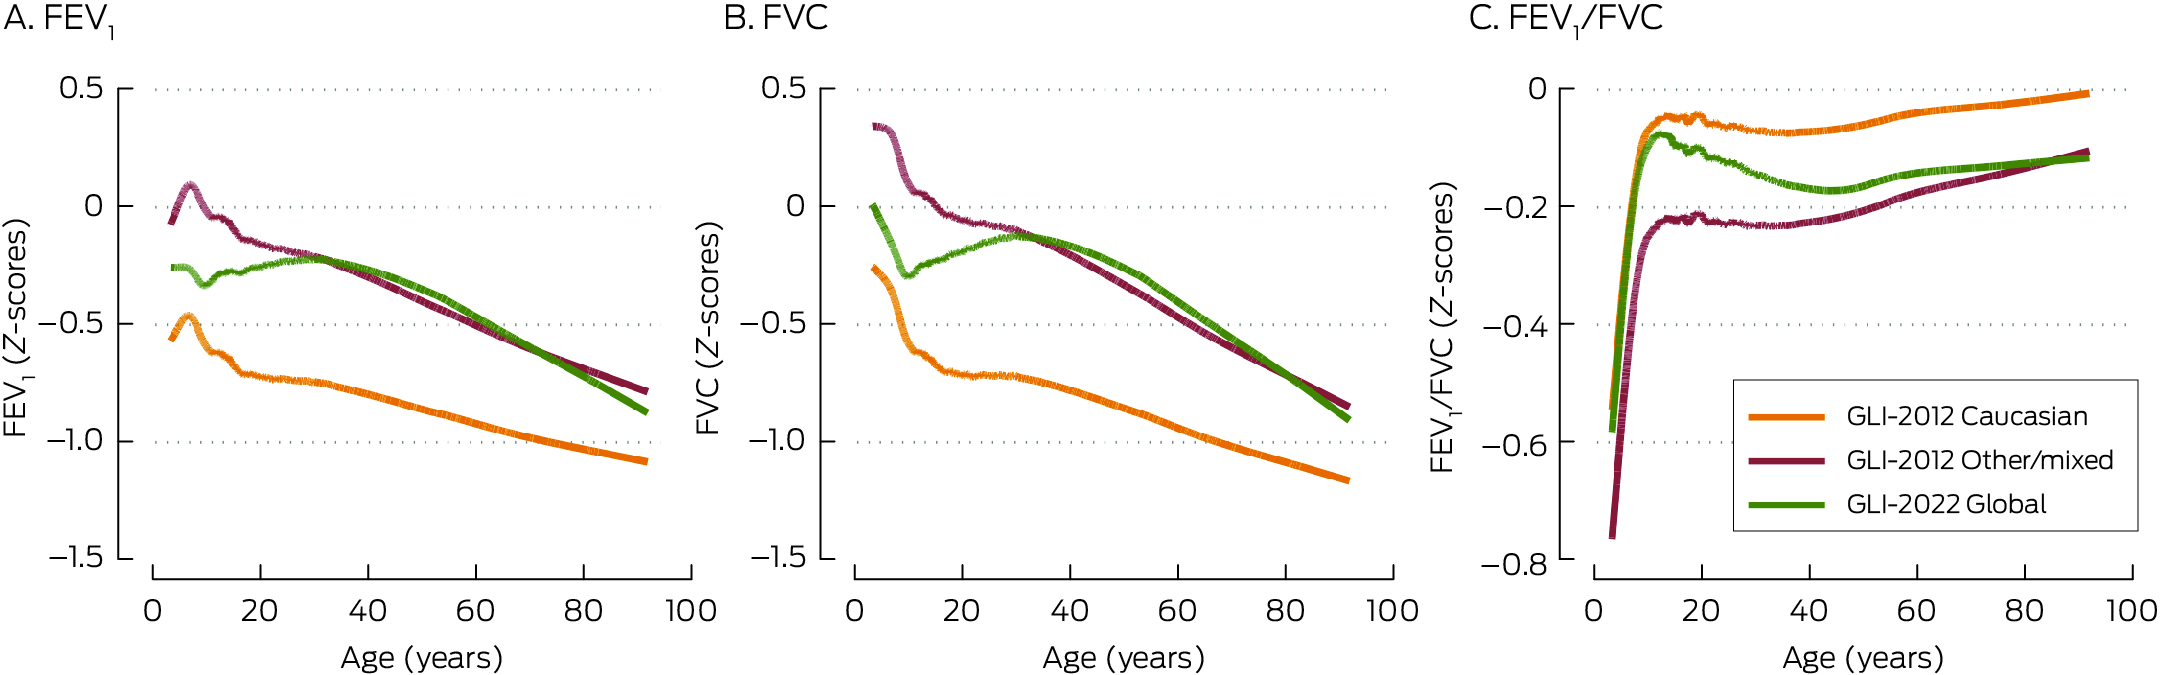
FEV1 = forced expiratory volume in the first second; FVC = forced vital capacity.* Locally weighted smoothed curves; FEV1 values are reported for 1467 healthy participants (768 female, 699 male participants), FVC and FEV1/FVC values for 1294 healthy participants (683 female, 611 male participants).
Box 6 – FEV1, FVC, and FEV1/FVC Z‐scores calculated with the GLI‐2012 other/mixed and GLI‐2022 global reference equations: multivariable regression analysis*
|
|
β coefficient (estimated difference) (95% confidence interval) |
||||||||||||||
|
|
FEV1 |
FVC |
FEV1/FVC |
||||||||||||
|
Characteristic |
Model A |
Model B |
Model A |
Model B |
Model A |
Model B |
|||||||||
|
|
|||||||||||||||
|
Participants |
1467 |
1467 |
1294 |
1294 |
1294 |
1294 |
|||||||||
|
GLI‐2012 other/mixed |
|
|
|
|
|
|
|||||||||
|
Age (per 10 years) |
–0.09 (–0.14 to –0.05) |
–0.10 (–0.15 to –0.06) |
–0.12 (–0.16 to –0.07) |
–0.12 (–0.17 to –0.08) |
0.01 (–0.03 to 0.05) |
0.02 (–0.02 to 0.06) |
|||||||||
|
Sex (female) |
–0.01 (–0.11 to 0.10) |
–0.02 (–0.13 to 0.08) |
0.05 (–0.07 to 0.17) |
0.01 (–0.10 to 0.13) |
–0.13 (–0.23 to –0.03) |
–0.12 (–0.22 to –0.02) |
|||||||||
|
Height (per 10 cm) |
–0.01 (–0.04 to 0.02) |
–0.03 (–0.06 to 0.00) |
–0.00 (–0.00 to 0.00) |
–0.04 (–0.08 to –0.01) |
0.01 (–0.02 to 0.04) |
0.02 (–0.01 to 0.05) |
|||||||||
|
Rural/remote (v urban) |
— |
–0.34 (–0.46 to –0.22) |
— |
–0.45 (–0.59 to –0.32) |
— |
0.14 (0.03 to 0.25) |
|||||||||
|
GLI‐2022 global |
|
|
|
|
|
|
|||||||||
|
Age (per 10 years) |
–0.03 (–0.07 to 0.01) |
–0.04 (–0.08 to –0.00) |
–0.03 (–0.07 to 0.01) |
–0.04 (–0.08 to 0.00) |
–0.02 (–0.06 to 0.02) |
–0.02 (–0.06 to 0.02) |
|||||||||
|
Sex (female) |
0.02 (–0.07 to 0.11) |
0.01 (–0.09 to 0.10) |
0.06 (–0.04 to 0.16) |
0.03 (–0.07 to 0.13) |
–0.10 (–0.20 to 0.00) |
–0.09 (–0.18 to 0.01) |
|||||||||
|
Height (per 10 cm) |
0.02 (–0.01 to 0.05) |
–0.00 (–0.00 to 0.00) |
0.03 (–0.00 to 0.05) |
–0.01 (–0.04 to 0.02) |
0.02 (–0.01 to 0.05) |
0.03 (0.00 to 0.06) |
|||||||||
|
Rural/remote (v urban) |
— |
–0.31 (–0.42 to –0.21) |
— |
–0.41 (–0.52 to –0.30) |
— |
0.17 (0.06 to 0.28) |
|||||||||
|
|
|||||||||||||||
|
FEV1 = forced expiratory volume in the first second; FVC = forced vital capacity; GLI = Global Lung Function Initiative. * Model A: adjusted for age, sex, and height; model B: adjusted for age, sex, height, and remoteness. |
|||||||||||||||
Received 2 April 2023, accepted 11 October 2023
- Andrew J Collaro1,2
- Rachel Foong3,4
- Anne B Chang1,5
- Julie M Marchant1,2,5
- Tamara L Blake6
- Johanna F Cole1
- Glenn Pearson4
- Rebecca Hii4,7
- Henry Brown4
- Mark D Chatfield6
- Graham Hall4
- Margaret S McElrea1,2,5
- 1 Queensland Hospital and Health Service, Brisbane, QLD
- 2 Australian Centre for Health Services Innovation, Queensland University of Technology, Brisbane, QLD
- 3 Wal‐yan Respiratory Research Centre, Telethon Kids Institute, Perth, WA
- 4 Telethon Kids Institute, University of Western Australia, Perth
- 5 Menzies School of Health Research, Darwin, NT
- 6 Child Health Research Centre, University of Queensland, Brisbane, QLD
- 7 St John of God Midland Public and Private Hospitals, Midland, WA
Open access:
Open access publishing facilitated by the University of Queensland, as part of the Wiley – the University of Queensland agreement via the Council of Australian University Librarians.
Data sharing:
Study data and documentation will not be available for sharing.
The Indigenous Respiratory Reference Values study was funded by the Queensland Health Aboriginal and Torres Strait Islander Health Branch and a Prince Charles Hospital Foundation (TPCHF) New Investigator grant (NI2017‐34). The Healthy Indigenous Lung Testing in Adults study was funded by a TPCHF Innovation Grant (INN2018‐24), Queensland Health Statewide Clinical Network project funding, the Northern Australia Tropical Disease Collaborative Research Programme (HOT NORTH Round 6), and a Thoracic Society of Australia and New Zealand Rob Pierce Grant‐in‐Aid for Indigenous Lung Health. Western Australian data collection was supported by a National Health and Medical Research Council (NHMRC) project grant (APP1104562), Curtin University, and sponsorship by Coles. Andrew Collaro is supported by an NHMRC Postgraduate Scholarship (APP2003334). Julie Marchant is supported by a Lung Foundation of Australia and NHMRC Centre for Research Excellence (AusBREATHE, GNT 1170958) fellowships. Anne Chang is supported by an NHMRC Senior Practitioner Fellowship (APP1154302) and several NHMRC grants, and has received fees (paid to her institution) for membership of an independent data monitoring committee evaluating an unlicensed vaccine (GSK) and a COVID‐19 vaccine (Moderna) not related to this article.
We acknowledge the invaluable assistance of many health professionals and community members: in Queensland we thank Vera Assan (First Nations health practitioner, Cairns and Hinterland Hospital and Health Service), Allan Takken and Brian Peacock (Indigenous project officers, Indigenous Respiratory Outreach Care program; Metro North Hospital and Health Service), Leanne Rodwell and Loren Grant (Children's Health Queensland), Simon Smith, Malcolm McDonald, and Suzy Munns (James Cook University), Unngoorra Harbour, and Holly Marchant; in the Northern Territory we thank Lesley Versteegh (Aboriginal research nurse, Menzies School of Health Research) and Gabrielle McCallum (Menzies School of Health Research); in Western Australia we thank all staff at the Derbarl Yerrigan Health Service Aboriginal Corporation, all staff at the Broome Regional Aboriginal Medical Service, André Schultz, Pam Laird, John Jacky, Janine McNamara, Alexandra Whelan, Danielle Headland, Elizabeth Smith, and Kelli McIntosh (all Telethon Kids Institute), and the Kulunga Aboriginal Unit at the Telethon Kids Institute for assistance with completing this study. Finally, we extend special thanks to the study participants, families, schools, and community elders and leaders for their support and participation.
No relevant disclosures.
- 1. Global Initiative for Chronic Obstructive Lung Disease. Global strategy for the diagnosis, management, and prevention of chronic obstructive pulmonary disease. 2023. https://goldcopd.org/wp‐content/uploads/2023/03/GOLD‐2023‐ver‐1.3‐17Feb2023_WMV.pdf (viewed Apr 2024).
- 2. Quanjer PH, Stanojevic S, Cole TJ, et al; ERS Global Lung Function Initiative. Multi‐ethnic reference values for spirometry for the 3–95‐yr age range: the global lung function 2012 equations. Eur Respir J 2012; 40: 1324‐1343.
- 3. Brazzale D, Hall G, Swanney MP. Reference values for spirometry and their use in test interpretation: a position statement from the Australian and New Zealand Society of Respiratory Science. Respirology 2016; 21: 1201‐1209.
- 4. Graham BL, Steenbruggen I, Miller MR, et al. Standardization of spirometry 2019 update. An official American Thoracic Society and European Respiratory Society technical statement. Am J Respir Crit Care Med 2019; 200: e70‐e88.
- 5. Bowerman C, Bhakta NR, Brazzale D, et al. A race‐neutral approach to the interpretation of lung function measurements. Am J Respir Crit Care Med 2023; 207: 768‐774.
- 6. Australian Health Ministers’ Advisory Council. Aboriginal and Torres Strait Islander health performance framework: 2017 report. https://www.niaa.gov.au/sites/default/files/publications/2017‐health‐performance‐framework‐report_1.pdf (viewed Apr 2024).
- 7. Chang AB, Marsh RL, Upham JW, et al. Toward making inroads in reducing the disparity of lung health in Australian Indigenous and New Zealand Māori children. Front Pediatr 2015; 3: 9.
- 8. Veale AJ, Peat JK, Salome CM, et al. “Normal” lung function in rural Australian Aborigines. Aust N Z J Med 1997; 27: 543‐549.
- 9. Thompson JE, Sleigh AC, Passey ME, et al. Ventilatory standards for clinically well Aboriginal adults. Med J Aust 1992; 156: 566‐569.
- 10. Watson DS, Watson RM, Siskind V. Respiratory function in Aboriginal children. Med J Aust 1986; 144 (Suppl 2): S11‐S13.
- 11. Chandler D, Dugdale AE. Respiratory function in Aboriginal school children. Med J Aust 1979; 1 (Suppl 2): 10‐12.
- 12. Heraganahally SS, Howarth T, White E, et al. Lung function parameters among Australian Aboriginal “apparently healthy” adults: an Australian Caucasian and Global Lung Function Initiative (GLI‐2012) various ethnic norms comparative study. Expert Rev Respir Med 2021; 15: 833‐843.
- 13. Blake TL, Chang AB, Petsky HL, et al. Spirometry reference values in Indigenous Australians: a systematic review. Med J Aust 2016; 205: 35‐40. https://www.mja.com.au/journal/2016/205/1/spirometry‐reference‐values‐indigenous‐australians‐systematic‐review
- 14. Blake TL, Chang AB, Chatfield MD, et al. Global Lung Function Initiative‐2012 “other/mixed” spirometry reference equation provides the best overall fit for Australian Aboriginal and/or Torres Strait Islander children and young adults. Respirology 2020; 25: 281‐288.
- 15. Australian Institute of Health and Welfare. Rural and remote health. Updated 30 Apr 2024. https://www.aihw.gov.au/reports/rural‐remote‐australians/rural‐and‐remote‐health (viewed Apr 2024).
- 16. Hegewald MJ, Crapo RO. Socioeconomic status and lung function. Chest 2007; 132: 1608‐1614.
- 17. Sonnappa S, Lum S, Kirkby J, et al. Disparities in pulmonary function in healthy children across the Indian urban‐rural continuum. Am J Respir Crit Care Med 2015; 191: 79‐86.
- 18. Zerah F, Harf A, Perlemuter L, et al. Effects of obesity on respiratory resistance. Chest 1993; 103: 1470‐1476.
- 19. Miller MR, Hankinson J, Brusasco V, et al; ATS/ERS Task Force. Standardisation of spirometry. Eur Respir J 2005; 26: 319‐338.
- 20. Global Lungs Initiative; Quanjer PH, Stanojevic S, Cole TJ, Stocks J. Implementing GLI 2012 lung function regression equations. 19 July 2015. https://www.ers‐education.org/lrmedia/2013/pdf/266709.pdf (viewed Apr 2024).
- 21. Collaro AJ, Chang AB, Marchant JM, et al. How do Cormic index profiles contribute to differences in spirometry values between white and First Nations Australian children? Pediatr Pulmonol 2021; 56: 3966‐3974.
- 22. Scanlon PD, Shriver MD. “Race correction” in pulmonary‐function testing. N Engl J Med 2010; 363: 385‐386.
- 23. Burney PGJ, Hooper RL. The use of ethnically specific norms for ventilatory function in African‐American and white populations. Int J Epidemiol 2012; 41: 782‐790.
- 24. Bhakta NR, Bime C, Kaminsky DA, et al. Race and ethnicity in pulmonary function test interpretation: an official American Thoracic Society statement. Am J Respir Crit Care Med 2023; 207: 978‐995.
Abstract
Objectives: To evaluate the suitability of the Global Lung Function Initiative (GLI)‐2012 other/mixed and GLI‐2022 global reference equations for evaluating the respiratory capacity of First Nations Australians.
Design, setting: Cross‐sectional study; analysis of spirometry data collected by three prospective studies in Queensland, the Northern Territory, and Western Australia between March 2015 and December 2022.
Participants: Opportunistically recruited First Nations participants in the Indigenous Respiratory Reference Values study (Queensland, Northern Territory; age, 3–25 years; 18 March 2015 – 24 November 2017), the Healthy Indigenous Lung Function Testing in Adults study (Queensland, Northern Territory; 18 years or older; 14 August 2019 – 15 December 2022) and the Many Healthy Lungs study (Western Australia; five years or older; 10 October 2018 – 7 November 2021).
Main outcome measures: Goodness of fit to spirometry data for each GLI reference equation, based on meanZ ‐score and its standard deviation, and proportions of participants with respiratory parameter values within 1.64 Z ‐scores of the mean value.
Results: Acceptable and repeatable forced expiratory volume in the first second (FEV1) values were available for 2700 First Nations participants in the three trials; 1467 were classified as healthy and included in our analysis (1062 children, 405 adults). Their median age was 12 years (interquartile range, 9–19 years; range, 3–91 years), 768 (52%) were female, and 1013 were tested in rural or remote areas (69%). Acceptable and repeatable forced vital capacity (FVC) values were available for 1294 of the healthy participants (88%). The GLI‐2012 other/mixed and GLI‐2022 global equations provided good fits to the spirometry data; the race‐neutral GLI‐2022 global equation better accounted for the influence of ageing on FEV1 and FVC, and of height on FVC. Using the GLI‐2012 other/mixed reference equation and after adjusting for age, sex, and height, mean FEV1 (estimated difference, –0.34; 95% confidence interval [CI], –0.46 to –0.22) and FVCZ ‐scores (estimated difference, –0.45; 95% CI, –0.59 to –0.32) were lower for rural or remote than for urban participants, but their mean FEV1/FVC Z ‐score was higher (estimated difference, 0.14; 95% CI, 0.03–0.25).
Conclusion: The normal spirometry values of healthy First Nations Australians may be substantially higher than previously reported. Until more spirometry data are available for people in urban areas, the race‐neutral GLI‐2022 global or the GLI‐2012 other/mixed reference equations can be used when assessing the respiratory function of First Nations Australians.