


The known Disparities in the treatment of Aboriginal and non-Aboriginal patients hospitalised with acute coronary syndromes have been reported.
The new After adjusting for age and other factors, Aboriginal status was independently associated with lower coronary angiography rates. Angiography was more likely if family members or Aboriginal liaison officers were present. Revascularisation rates and prescription of medical therapies were similar for Aboriginal and non-Aboriginal patients who had undergone angiography.
The implications The reasons for lower angiography rates among Aboriginal patients are complex, but equality of treatment can be achieved. Improving the hospital experience for Aboriginal patients is needed to reduce disparities in treatment.
Coronary heart disease (CHD) contributes significantly to the 10-year life expectancy gap between Aboriginal and non-Aboriginal Australians.1-3 CHD mortality is estimated to be twice as high among Aboriginal Australians,3 accounting for 14% of all deaths of Aboriginal people.4 A higher incidence of acute coronary syndromes (ACS), particularly of acute myocardial infarctions (AMI), among Aboriginal Australians is a major contributor to premature mortality in this population. In 2006, the Australian Institute of Health and Welfare identified major disparities in the management of Aboriginal and Torres Strait Islander patients hospitalised with ACS between 2002 and 2003, including a 40% lower rate of coronary angiography, a 40% lower rate of percutaneous coronary intervention (PCI), and a 20% lower rate of coronary artery bypass graft surgery (CABG).5
Given the extent of the inequalities related to cardiovascular disease, there is clearly a need to identify and overcome problems that contribute to these health disparities. To expand knowledge in this area, our study examined the in-hospital management of Aboriginal people with an ACS, focusing on explaining these disparities. Our aims were: (i) to assess differences in the rates of angiography and subsequent revascularisation for Aboriginal and non-Aboriginal South Australians presenting with an ACS, taking into account age and other factors; and (ii) to explore the reasons for any disparities by undertaking a detailed review of individual hospital admissions.
Methods
This was an observational study of Aboriginal and non-Aboriginal patients presenting with an ACS to any public tertiary hospital in South Australia between January 2007 and December 2012. We undertook a retrospective analysis of hospital administrative data and a chart review of all admissions of Aboriginal people with an ACS during this period (matched with a control cohort of non-Aboriginal patients).
Establishment of the expert working group
Following the release of Better hospital care for Aboriginal and Torres Strait Islander people experiencing heart attack,6 it was recognised that contemporary SA-specific data were required for evaluating disparities in care in this state. Consequently, the Heart Foundation in SA, in collaboration with the SA Health Cardiology Clinical Network, established a research team to provide the data. The project was overseen by an expert working group with representation from the research team and each SA Health local health service, as well as Aboriginal health professionals.
Administrative data
To investigate differences in diagnostic angiography and revascularisation (PCI/CABG) rates in Aboriginal and non-Aboriginal people, hospital admissions for ACS to all South Australian public tertiary facilities, with separations between 1 January 2007 and 31 December 2012, were obtained from the Integrated South Australian Activity Collection (ISAAC). ISAAC records are coded using International Statistical Classification of Diseases and Related Health Problems, 10th revision, Australian modification (ICD-10-AM) codes. All records were based on separations (episodes of care) rather than individual patients. Records were included in the analysis if the principal diagnosis was AMI (ICD-10-AM, I21.x) or unstable angina (I20.x) and the admission was recorded as an acute episode of care with casualty/emergency department as the source of referral. To avoid contamination of the dataset, records for interhospital transfers were excluded. Records in which Indigenous status was not stated or was inadequately described were also excluded.
Chart review
To further examine the in-hospital management of Aboriginal patients with an ACS, a chart review was undertaken, using 1:1 matching and a standardised case report form. The hospital medical records for each separation recorded in the administrative data of patients who were identified as Aboriginal or Torres Strait Islander were extracted. They were matched as closely as possible with the next admission to the same hospital of a non-Aboriginal patient of the same age (within 10 years) and sex, and with the same principal diagnosis. Documentation of the medical decision-making process about whether the patient received invasive management was also reviewed; influences on this process were categorised as clinical or non-clinical (ie, patient-related factors).7 Data quality for the chart review was ensured by using trained abstractors and record re-abstraction for 10% of cases. Training included a detailed data dictionary and coding instructions, a testing phase with training examples, and individual education sessions on site before and during data collection.
Statistical analysis
Administrative data
Age at admission (mean, standard deviation) for Aboriginal and non-Aboriginal patients was compared with the Student t test. Comparisons of categorical endpoints for Aboriginal and non-Aboriginal patients are presented as percentages, and were assessed by logistic regression. Unadjusted and age-adjusted comparisons are reported as odds ratios with 95% confidence intervals (CIs). The primary outcomes included receiving diagnostic coronary angiography and, for patients for whom angiography was performed, PCI and CABG rates. To explore the association between invasive management and Aboriginal status, logistic regression models were fitted for each outcome. Modelling commenced with fully saturated models that included Aboriginal status and all remaining predictors with P < 0.20 as factors; non-significant variables (P ≥ 0.05) were then systematically removed from the models.
Chart review
Clinical outcomes for Aboriginal and non-Aboriginal patients are presented as percentages and compared by logistic regression as described above. Symptom duration in minutes (median, interquartile range [IQR]) was compared with the Wilcoxon rank-sum test. The primary outcome in the chart review was the prevalence of clinical and non-clinical factors associated with non-invasive management; outcomes for the two groups were compared by logistic regression, with unadjusted and age-adjusted results reported.
All tests were two-tailed (α = 0.05). All analyses were performed in Stata/IC 11.2 for Mac.
Ethics approval
This study was approved by the SA Health Human Research Ethics Committee (reference, HREC-13-SAH-89; 461/07/2014) and the Aboriginal Health Research Ethics Committee (reference, 04-13-516).
Results
Administrative data
During January 2007 – December 2012, a total of 13 843 separations with a principal diagnosis of ACS were recorded. Aboriginal status was not stated or inadequately described in 722 records (5.6%), leaving 13 071 admissions records for analysis, of which 274 (2.1%) referred to Aboriginal patients. The mean age of the Aboriginal patients was about 16 years lower than for non-Aboriginal patients, and a higher proportion were women (Box 1). The age distribution by Aboriginal status and sex is summarised in Appendix 1. Most patients presented with an AMI; the figure was similar for the two groups (57%), despite the younger age profile of the Aboriginal patients. Evaluation of additional diagnosis codes found a higher prevalence among Aboriginal patients of several cardiovascular risk factors and comorbidities, including diabetes, smoking, dyslipidaemia and renal failure (Box 1).
Analysis of hospital procedure codes indicated that 6069 separations (46.4%) included a diagnostic coronary angiogram during the admission for an ACS (Box 2). The proportion was similar for Aboriginal and non-Aboriginal patients, but age-adjusted analyses identified that Aboriginal patients were significantly less likely to undergo the procedure (Box 2). Box 3 shows the prevalence of coronary angiography by age group, indicating a significant disparity for Aboriginal patients in the 45–54 years (P < 0.001) and 55–64 years (P = 0.001) age groups.
For the entire cohort, patients who underwent coronary angiography were significantly younger than those who did not (mean [SD], 64.0 years [12.9] v 73.8 years [13.8]; P < 0.001), and a greater proportion were men (72% v 58%; odds ratio [OR], 1.87; 95% CI, 1.74–2.01; P < 0.001). Multivariable logistic regression identified eight independent factors significantly associated with angiography: Aboriginal status (OR, 0.4; 95% CI, 0.3–0.5; P < 0.001); age (as a continuous variable: OR [for each one-year increase in age], 0.9; 95% CI, 0.9–1.0; P < 0.001); AMI as principal diagnosis (OR, 5.8; 95% CI, 5.3–6.3; P < 0.001); sex (OR [men v women], 1.3; 95% CI, 1.2–1.4; P < 0.001); major cities (OR [v outer regional/remote/very remote area residence], 2.9; 95% CI, 2.3–3.7; P < 0.001); renal failure (OR, 0.5; 95% CI, 0.4–0.6; P < 0.001); heart failure (OR, 0.5; 95% CI, 0.5–0.6); P < 0.01); and airway disease (OR, 0.6; 95% CI, 0.5–0.7; P < 0.001).
After adjustment for age, the odds of Aboriginal patients undergoing PCI were significantly lower than for non-Aboriginal patients (Box 2). The between-groups odds ratios for undergoing CABG were significant in neither the unadjusted nor the age-adjusted analyses. However, when the analysis of interventional procedures was restricted to patients who underwent coronary angiography, PCI rates for Aboriginal and non-Aboriginal patients were similar, as were those of CABG and revascularisation overall (Box 2). For admissions that included a coronary angiogram, multivariable models assessing independent predictors of revascularisation (PCI, CABG) did not find an association with Aboriginal status.
Chart review
We reviewed medical record abstracts for 274 Aboriginal and 274 non-Aboriginal patients. Aboriginal patients were matched for sex with non-Aboriginal patients (57% were men), but were significantly younger (mean age [SD], 53.1 years [10.5] v 59.0 [10.4] years; P < 0.001). The number who arrived at hospital by ambulance was similar for Aboriginal and non-Aboriginal patients (148 [61%] v 149 [60%]; age-adjusted OR, 1.3; 95% CI, 0.9–1.8; P = 0.24), as was symptom duration (median time before hospital presentation [IQR], 160 min [80–415 min] v 165 min [80–419 min]; P = 0.62). The angiography rate among Aboriginal patients was lower than for non-Aboriginal patients in both the unadjusted and age-adjusted analyses (141 [51%] v 169 [62%]; age-adjusted OR, 0.5; 95% CI, 0.4–0.7; P < 0.001). Stratification according to the National Heart Foundation/Cardiac Society of Australia and New Zealand ACS guidelines8 indicated a similar risk burden for the patient groups (Appendix 2). The proportion of Aboriginal patients who underwent angiography was lower in each risk group, but the difference was statistically significant only for patients with high risk non-ST-elevation acute coronary syndrome (NSTEACS; 49% [59 patients] v 60% [64 patients]; age-adjusted OR, 0.5; 95% CI, 0.3–0.9; P = 0.02) (Box 4). Aboriginal patients who received care facilitated by an Aboriginal liaison officer were significantly more likely to have an angiogram (28% [27 patients] v 9% [10 patients]; OR, 3.9; 95% CI, 1.8–8.6; P = 0.001), as were Aboriginal patients who arrived at the hospital with an escort (43% [32 patients] v 24% [25 patients]; OR, 2.4; 95% CI, 1.3–4.6; P = 0.01).
The documentation on the decision not to proceed with angiography for Aboriginal and non-Aboriginal patients is summarised in Box 5. Non-clinical factors were more frequently cited to explain managing an ACS without angiography in documentation for Aboriginal patients than for non-Aboriginal patients. For more than one third of Aboriginal patients, the reason for choosing conservative management was unclear, compared with 10% for non-Aboriginal patients (Box 5).
At discharge, the prescription of guideline-recommended therapies for AMI patients was similar for Aboriginal and non-Aboriginal patients (Box 6). Regardless of Aboriginal status, secondary prevention therapies, including aspirin, β-blockers and cardiac rehabilitation referral, were prescribed significantly less frequently for those who did not undergo coronary angiography than for patients who did (Appendix 3).
Discussion
In this evaluation of patients attending the major tertiary facilities in SA for the treatment of ACS, the mean age of Aboriginal patients was about 15 years lower than for non-Aboriginal patients. Despite their being younger, high risk features were worryingly common, including higher rates of background cardiovascular risk factors and comorbidities. Importantly, we identified that the major difference in the in-hospital treatment of Aboriginal patients with an ACS was the rate of coronary angiography: after correcting for the effects of age, sex, principal diagnosis, comorbidities and remoteness, Aboriginal patients with an ACS were significantly less likely to undergo this diagnostic procedure. However, we also found that revascularisation (PCI or CABG) rates following angiography were similar for Aboriginal and non-Aboriginal patients. Similar to findings in the Northern Territory,9 Aboriginal and non-Aboriginal patients who had undergone angiography were prescribed evidence-based therapies on discharge at comparable rates. These findings show that equivalent treatment for Aboriginal and non-Aboriginal patients is achievable.
The lower age-adjusted odds of Aboriginal patients undergoing diagnostic angiography is concerning, but consistent with previous reports of lower rates of cardiac intervention in national5 and state-based datasets.10 Similar rates of CABG, but not of PCI, among Aboriginal and non-Aboriginal patients have been described.10 We, however, found similar rates of PCI for the two population groups; the reasons for this difference are unclear, but may include advances in PCI technology11 that have expanded the range of Aboriginal patients who can be treated with this intervention. Unlike other studies, we also undertook a restricted analysis of revascularisation rates that included only admissions where a diagnostic angiogram had been performed, thereby differentiating different sources of disparity; this analysis indicated that the major difference involved the decision about diagnostic angiography. Research in the United States exploring racial disparities in treating CHD also found that the greatest disparity was the referral to angiography.12,13
To further examine the causes of the disparity in angiography rates, we undertook a medical record review of all Aboriginal ACS admissions in the hospital data, matched with data for a non-Aboriginal cohort. This information provided insight into the medical decision-making processes for Aboriginal ACS patients and confirmed that a negative hospital experience, bias based on complex comorbidities or presumed adherence to medications that favoured conservative management, and patient choice were implicated in the difference in angiography rates.6,14,15
In 56% of cases in which Aboriginal patients did not undergo angiography, the decision was attributed to patient-related factors or no clear justification was provided, compared with 17% for non-Aboriginal patients. The rate of discharge against medical advice was high among Aboriginal patients who did not receive angiography (10.5%). This raises concerns about barriers to quality care for Aboriginal people, including poor engagement and communication, a lack of coordinated care, and inadequate cultural competence of health care providers.16,17 All of these factors can result in isolation, fear and disengagement by the patient.9
The importance of shared discussions and cultural support structures is highlighted by our findings, as Aboriginal patients who arrived at the hospital with an escort (family member or friend) were more likely to undergo angiography. Encouraging shared decision making and enabling systems that support a companion during the hospital stay are crucial for improving Aboriginal health care.14 Our data also strongly support the involvement of Aboriginal liaison officers, as their presence was associated with an increased likelihood of angiography. Although we cannot presume a direct causative relationship, these interactions are understood to improve communication and coordination, and to assist in alleviating fear.17
It has previously been reported that Aboriginal people with symptoms suggestive of a heart attack may delay presenting to a hospital.9 However, our findings suggest this situation may be improving, as symptom duration at hospital presentation was similar for Aboriginal and non-Aboriginal patients. Strategies that target early response and action may now be having an impact, with a number of culturally appropriate health resources and education tools available to patients and health care providers.
The major limitations to our study were that the data were drawn from one Australian state, and that the assessed records were based on hospital separations rather than individual patients. Further, patients receiving care in non-tertiary facilities were not included in our analysis. An evaluation of these patients, with a particular focus on comparing patients who were subsequently transferred with those who remained in a non-catheterisation facility, would be desirable. Our investigation could thus be strengthened by broader population coverage and by using linked data.
Our study provides important insights into the in-hospital treatment of Aboriginal patients with an ACS. We found a significant health disparity in the rates of coronary angiography for Aboriginal and non-Aboriginal patients that is not explained by the frequency of complex comorbidities in these populations. Hospitalisation for acute cardiovascular care can be distressing, and for Aboriginal patients this problem is compounded by limited understanding by health care workers of factors influencing Aboriginal health, leading to miscommunication that may reinforce negative perceptions, patient disengagement, and fear. In our study, engagement with the patient’s family and care facilitated by Aboriginal liaison officers each had positive impacts. While there are other contributing factors to disparities in treatment, health care workers and systems that facilitate a constructive hospital experience will improve the ability to provide effective care for Aboriginal patients.
Box 1 – Clinical characteristics of Aboriginal and non-Aboriginal patients presenting with an acute coronary syndrome to South Australian tertiary hospitals, 2007–2012
Aboriginal patients |
Non-Aboriginal patients |
Odds ratio for Aboriginal patients |
|||||||||||||
Unadjusted (95% CI) |
P |
Age-adjusted (95% CI) |
P |
||||||||||||
Total number of separations |
274 |
12 797 |
|||||||||||||
Age at admission (years), mean (SD) |
53.1 (10.5) |
69.6 (14.1) |
< 0.001 |
||||||||||||
Sex (women) |
117 (43%) |
4460 (35%) |
1.4 (1.1–1.8) |
0.01 |
2.7 (2.1–3.5) |
< 0.001 |
|||||||||
Location* |
|||||||||||||||
Major cities |
203 (74%) |
10 730 (84%) |
0.6 (0.4–0.7) |
< 0.001 |
0.8 (0.6–1.1) |
0.19 |
|||||||||
Inner regional |
12 (4.4%) |
1615 (13%) |
0.3 (0.2–0.6) |
< 0.001 |
0.2 (0.1–0.4) |
< 0.001 |
|||||||||
Outer regional |
25 (9.2%) |
310 (2.4%) |
4.1 (2.6–6.2) |
< 0.001 |
2.6 (1.7–4.0) |
< 0.001 |
|||||||||
Remote/very remote |
33 (12.1%) |
128 (1.0%) |
14 (9.1–20) |
< 0.001 |
9.2 (5.9–14) |
< 0.001 |
|||||||||
Principal diagnosis |
|||||||||||||||
Unstable angina |
115 (42%) |
5403 (42%) |
0.9 (0.7–1.2) |
0.93 |
0.9 (0.8–1.3) |
0.51 |
|||||||||
Acute myocardial infarction (NSTEMI or STEMI) |
155 (57%) |
7241 (57%) |
1.0 (0.8–1.3) |
0.99 |
1.0 (0.8–1.3) |
0.71 |
|||||||||
Unspecified acute myocardial infarction |
4 (1%) |
153 (1%) |
1.2 (0.5–3.3) |
0.69 |
2.3 (0.8–6.5) |
0.11 |
|||||||||
Cardiovascular risk factors |
|||||||||||||||
Hypertension |
162 (59%) |
7745 (61%) |
0.9 (0.7–1.2) |
0.64 |
1.3 (1.0–1.7) |
0.20 |
|||||||||
Diabetes |
121 (44%) |
2737 (21%) |
2.9 (2.3–3.7) |
< 0.001 |
3.0 (2.4–3.9) |
< 0.001 |
|||||||||
Current smoker |
129 (47%) |
2610 (20%) |
3.5 (2.7–4.4) |
< 0.001 |
1.2 (0.9–1.6) |
0.18 |
|||||||||
Dyslipidaemia |
86 (31%) |
3074 (24%) |
1.4 (1.1–1.9) |
0.01 |
1.1 (0.8–1.4) |
0.56 |
|||||||||
Family history of ischaemic heart disease |
15 (5.5%) |
477 (3.7%) |
1.5 (0.9–2.5) |
0.14 |
0.6 (0.4–1.1) |
0.09 |
|||||||||
Cardiovascular comorbidities |
|||||||||||||||
Cerebrovascular disease |
2 (1%) |
179 (1.4%) |
0.5 (0.1–2.1) |
0.36 |
1.2 (0.3–5.0) |
0.79 |
|||||||||
Peripheral vascular disease |
3 (1%) |
311 (2.4%) |
0.4 (0.1–1.4) |
0.17 |
0.5 (0.2–1.6) |
0.27 |
|||||||||
Cardiomyopathy |
7 (3%) |
169 (1.3%) |
2.0 (0.9–4.2) |
0.09 |
2.0 (0.9–4.3) |
0.09 |
|||||||||
Valvular heart disease |
11 (4.0)% |
791 (6.2%) |
0.6 (0.3–1.2) |
0.14 |
1.4 (0.7–2.6) |
0.30 |
|||||||||
Heart failure |
23 (8.4%) |
1766 (14%) |
0.6 (0.4–0.9) |
0.01 |
1.7 (1.1–2.7) |
0.02 |
|||||||||
Cardiogenic shock |
3 (1%) |
240 (1.9%) |
0.6 (0.2–1.8) |
0.35 |
1.0 (0.3–3.1) |
0.96 |
|||||||||
Non-cardiovascular comorbidities |
|||||||||||||||
Renal failure |
41 (15%) |
1546 (12%) |
1.3 (0.9–1.8) |
0.15 |
3.6 (2.5–5.1) |
< 0.001 |
|||||||||
Malignancy |
3 (1%) |
214 (1.7%) |
0.7 (0.2–2.0) |
0.46 |
1.1 (0.4–3.6) |
0.83 |
|||||||||
Airway disease/asthma |
6 (2%) |
534 (4.2%) |
0.5 (0.2–1.2) |
0.11 |
0.8 (0.4–1.9) |
0.64 |
|||||||||
Liver disease |
2 (1%) |
59 (0.5%) |
1.6 (0.4–6.5) |
0.52 |
1.7 (0.4–7.2) |
0.47 |
|||||||||
NSTEMI = non-ST-elevation myocardial infarction; STEMI = ST-elevation myocardial infarction. * Classified according to Australian Bureau of Statistics, Postcode 2012 to Remoteness Area 2011 concordance (released 31 Jan 2013: http://www.abs.gov.au/AUSSTATS/abs@.nsf/DetailsPage/1270.0.55.006July%202011?OpenDocument). ICD-10 codes for risk factors and comorbidities: hypertension (I10–I15); diabetes (E10–E14); current smoker (Z72); dyslipidaemia (E78); family history of ischaemic heart disease (Z824); cerebrovascular disease (I60–I69); peripheral vascular disease (I70–I74); cardiomyopathy (I42, I43); valvular heart disease (I05–I08, I33–I39); heart failure (I50); cardiogenic shock (R57); renal failure (N17, N18.3, N18.4, N18.5, N18.9, N19, R34); malignancy (C00–C97); asthma (J45–J46); airway disease (J40–J44, J47); liver disease (K70–K77). All percentages are column percentages after excluding missing values. | |||||||||||||||
Box 2 – Coronary angiography and revascularisation rates for Aboriginal and non-Aboriginal patients with an acute coronary syndrome, South Australia, 2007–2012
Aboriginal patients |
Non-Aboriginal patients |
Odds ratio for Aboriginal patients |
|||||||||||||
Unadjusted (95% CI) |
P |
Age-adjusted (95% CI) |
P |
||||||||||||
Total number of separations |
274 |
12 797 |
|||||||||||||
Coronary angiography |
135 (49%) |
5934 (46%) |
1.1 (0.9–1.4) |
0.34 |
0.5 (0.4–0.6) |
< 0.001 |
|||||||||
Interventions (proportion of patients in group) | |||||||||||||||
Percutaneous coronary intervention (PCI) |
87 (32%) |
3831 (30%) |
1.1 (0.8–1.4) |
0.52 |
0.5 (0.4–0.6) |
< 0.001 |
|||||||||
Coronary artery bypass grafting (CABG) |
8 (3%) |
308 (2.4%) |
1.2 (0.6–2.5) |
0.59 |
0.9 (0.5–1.9) |
0.88 |
|||||||||
Total revascularisation (PCI or CABG) |
95 (35%) |
4124 (32%)* |
1.1 (0.9–1.4) |
0.39 |
0.5 (0.4–0.7) |
< 0.001 |
|||||||||
Interventions following coronary angiography (proportion of patients in group who underwent coronary angiography) | |||||||||||||||
PCI |
82 (61%) |
3512 (59%) |
1.1 (0.8–1.5) |
0.72 |
0.8 (0.5–1.1) |
0.18 |
|||||||||
CABG |
7 (5%) |
225 (3.8%) |
1.4 (0.6–3.0) |
0.41 |
1.7 (0.7–3.7) |
0.20 |
|||||||||
Total revascularisation (PCI or CABG) |
89 (66%) |
3725 (63%)* |
1.1 (0.8–1.6) |
0.45 |
0.9 (0.6–1.2) |
0.42 |
|||||||||
All percentages are column percentages after excluding missing values. * Some non-Aboriginal patients underwent both PCI and CABG, but are counted only once in the revascularisation total, so that the sum of the numbers for PCI and CABG exceeds that for total revascularisation interventions. | |||||||||||||||
Box 3 – Unadjusted proportions of Aboriginal and non-Aboriginal patients presenting to South Australian public hospitals with an acute coronary syndrome who underwent coronary angiography, 2007–2012, by age group
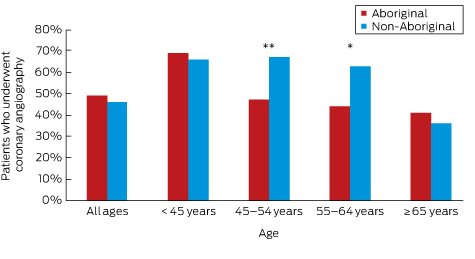
Aboriginal v non-Aboriginal patients: * P = 0.001; **P < 0.001 (logistic regression).
Box 4 – Age-adjusted comparison of Aboriginal and non-Aboriginal patients with acute coronary syndromes who underwent coronary angiography, based on chart review data, according to guideline risk stratification
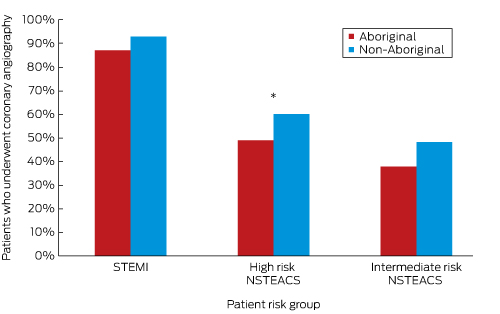
STEMI = ST-elevation myocardial infarction; NSTEACS = non-ST-elevation acute coronary syndrome. Aboriginal v non-Aboriginal patients: * P = 0.02 (logistic regression).
Box 5 – Documentation of clinical and non-clinical factors in treating Aboriginal and non-Aboriginal patients with acute coronary syndromes without coronary angiography, chart review data
Aboriginal patients |
Non-Aboriginal patients |
Odds ratio for Aboriginal patients undergoing coronary angiography |
|||||||||||||
Unadjusted (95% CI) |
P |
Age-adjusted (95% CI) |
P |
||||||||||||
Number of patients |
274 |
274 |
|||||||||||||
Coronary angiography not undertaken |
139 (51%) |
118 (43%) |
1.4 (1.0–1.9) |
0.07 |
1.6 (1.1–2.3) |
0.01 |
|||||||||
Reason for not undertaking angiography |
|||||||||||||||
Patient-related factors |
28 (20%) |
8 (7%) |
3.5 (1.5–8.4) |
0.01 |
3.4 (1.4–8.2) |
0.01 |
|||||||||
Patient decision |
10 |
5 |
|||||||||||||
Discharge against medical advice |
15 |
3 |
|||||||||||||
Known medication non-adherence |
3 |
0 |
|||||||||||||
Clinical/medical factors |
61 (44%) |
98 (83%) |
0.2 (0.1–0.3) |
< 0.001 |
0.1 (0.1–0.3) |
< 0.001 |
|||||||||
Angiography booked |
7 |
10 |
|||||||||||||
Non-invasive test for ischaemia |
11 |
41 |
|||||||||||||
Symptoms deemed non-ischaemic |
22 |
15 |
|||||||||||||
Comorbidities/palliative care |
7 |
14 |
|||||||||||||
Known anatomy, medical management |
14 |
18 |
|||||||||||||
Unclear |
50 (36%) |
12 (10%) |
5.3 (2.5–11) |
< 0.001 |
5.7 (2.7–12.3) |
< 0.001 |
|||||||||
Box 6 – Guideline-recommended therapies at discharge for Aboriginal and non-Aboriginal patients with an acute myocardial infarction, chart review data
Discharge therapy |
Aboriginal patients |
Non-Aboriginal patients |
Odds ratio for Aboriginal patients |
||||||||||||
Unadjusted (95% CI) |
P |
Age-adjusted (95% CI) |
P |
||||||||||||
Number of patients* |
134 |
150 |
|||||||||||||
Aspirin |
119 (90%) |
144 (95%) |
0.5 (0.2–1.2) |
0.12 |
0.5 (0.2–1.2) |
0.11 |
|||||||||
Statin |
118 (89%) |
130 (93%) |
0.6 (0.3–1.5) |
0.32 |
0.6 (0.2–1.4) |
0.24 |
|||||||||
β-Blocker |
71 (54%) |
67 (48%) |
1.3 (0.8–2.1) |
0.30 |
1.3 (0.8–2.0) |
0.34 |
|||||||||
Angiotensin converting enzyme inhibitor or angiotensin receptor blocker |
99 (76%) |
113 (82%) |
0.7 (0.4–1.2) |
0.17 |
0.7 (0.4–1.3) |
0.22 |
|||||||||
Cardiac rehabilitation referral |
52 (50%) |
54 (46%) |
1.2 (0.7–2.0) |
0.57 |
0.9 (0.5–1.6) |
0.79 |
|||||||||
Ejection fraction assessed |
66 (50%) |
65 (44%) |
1.3 (0.8–2.0) |
0.33 |
1.2 (0.7–1.9) |
0.57 |
|||||||||
Received 16 April 2016, accepted 24 June 2016
- Rosanna Tavella1,2
- Katharine McBride3,4
- Wendy Keech3,4
- Janet Kelly3,5
- Amanda Rischbieth1,5
- Christopher Zeitz1,2
- John F Beltrame1,2
- Philip A Tideman6
- Alex Brown3,4
- 1 University of Adelaide, Adelaide, SA
- 2 Central Adelaide Local Health Network, SA Health, Adelaide, SA
- 3 Wardliparingga Aboriginal Research Unit, South Australian Health and Medical Research Institute, Adelaide, SA
- 4 Centre for Population Health Research, University of South Australia, Adelaide, SA
- 5 National Heart Foundation of Australia, Adelaide, SA
- 6 Integrated Cardiovascular Clinical Network, Country Health SA Local Health Network, Adelaide, SA
We acknowledge the funding provided by the National Heart Foundation (South Australian Division) for the case note review, and the detailed work of the case note reviewers at Royal Adelaide Hospital, the Queen Elizabeth Hospital, Lyell McEwin Hospital and Flinders Medical Centre. We acknowledge the contribution of knowledge by the Aboriginal Workforce and Cardiac Coordination Advisory Panel. We are grateful for ongoing advice and guidance throughout the project by representatives of the Council of Aboriginal Elders of SA, the Aboriginal Health Council of SA, and the SA Aboriginal Health Partnership. We acknowledge the ongoing support from SA Health data custodian Tina Hardin.
Alex Brown, Katharine McBride and Wendy Keech are working on a project commissioned by SA Health, the “State of Aboriginal Heart Health”, that includes the development of an SA Aboriginal heart and stroke plan. Through this project, they have access to SA Health hospital data.
- 1. Australian Bureau of Statistics. Experimental life tables for Aboriginal and Torres Strait Islander Australians, 2005–2007 (ABS Cat. No. 3302.055.003). Canberra: ABS, 2009. http://www.abs.gov.au/AUSSTATS/abs@.nsf/Lookup/3302.0.55.003Main+Features12005–2007 (accessed Apr 2016).
- 2. Australian Institute of Health and Welfare. Contribution of chronic disease to the gap in adult mortality between Aboriginal and Torres Strait Islander and other Australians (AIHW Cat. No. IHW 48). Canberra: AIHW, 2011. http://www.aihw.gov.au/publication-detail/?id=10737418878 (accessed Apr 2016).
- 3. Vos T, Barker B, Begg S, et al. Burden of disease and injury in Aboriginal and Torres Strait Islander Peoples: the Indigenous health gap. Int J Epidemiol 2009; 38: 470-477.
- 4. Australian Institute of Health and Welfare. The health and welfare of Australia’s Aboriginal and Torres Strait Islander peoples: 2015 (AIHW Cat. No. IHW 147). Canberra: AIHW, 2015. http://www.aihw.gov.au/publication-detail/?id=60129550168 (accessed Apr 2016).
- 5. Mathur S, Moon L, Leigh S. Aboriginal and Torres Strait Islander people with coronary heart disease: further perspectives on health status and treatment (AIHW Cat. No. CVD 33; Cardiovascular Disease Series No. 25). Canberra: Australian Institute of Health and Welfare, 2006. http://www.aihw.gov.au/publication-detail/?id=6442467898 (accessed Dec 2011).
- 6. National Heart Foundation of Australia; Australian Healthcare and Hospital Association. Better hospital care for Aboriginal and Torres Strait Islander people experiencing heart attack. Melbourne: NHFA, AHHA, 2010. https://ahha.asn.au/sites/default/files/docs/policy-issue/100602_better_hospital_care.pdf (accessed Dec 2011).
- 7. Hajjaj FM, Salek MS, Basra MK, Finlay AY. Non-clinical influences on clinical decision-making: a major challenge to evidence-based practice. J R Soc Med 2010; 103: 178-187.
- 8. Chew DP, Aroney CN, Aylward PE, et al. 2011 Addendum to the National Heart Foundation of Australia/Cardiac Society of Australia and New Zealand Guidelines for the management of acute coronary syndromes (ACS) 2006. Heart Lung Circ 2011; 20: 487-502.
- 9. Brown A. Acute coronary syndromes in indigenous Australians: opportunities for improving outcomes across the continuum of care. Heart Lung Circ 2010; 19: 325-336.
- 10. Coory MD, Walsh WF. Rates of percutaneous coronary interventions and bypass surgery after acute myocardial infarction in Indigenous patients. Med J Aust 2005; 182: 507-512. <MJA full text>
- 11. Erbel R, Wijns W. The year in cardiology 2013: coronary intervention. Eur Heart J 2014; 35: 313-320.
- 12. Schulman KA, Berlin JA, Harless W, et al. The effect of race and sex on physicians’ recommendations for cardiac catheterization. N Engl J Med 1999; 340: 618-626.
- 13. Weintraub WS, Vaccarino V. Explaining racial disparities in coronary outcomes in women. Circulation 2003; 108: 1041-1043.
- 14. Ilton MK, Walsh WF, Brown AD, et al. A framework for overcoming disparities in management of acute coronary syndromes in the Australian Aboriginal and Torres Strait Islander population. A consensus statement from the National Heart Foundation of Australia. Med J Aust 2014; 200: 639-643. <MJA full text>
- 15. Ong MA, Weeramanthri TS. Delay times and management of acute myocardial infarction in indigenous and non-indigenous people in the Northern Territory. Med J Aust 2000; 173: 201-204. <MJA full text>
- 16. Davidson PM, MacIsaac A, Cameron J, et al. Problems, solutions and actions: addressing barriers in acute hospital care for indigenous Australians and New Zealanders. Heart Lung Circ 2012; 21: 639-643.
- 17. Taylor KP, Thompson SC, Smith JS, et al. Exploring the impact of an Aboriginal Health Worker on hospitalised Aboriginal experiences: lessons from cardiology. Aust Health Rev 2009; 33: 549-557.
Abstract
Objectives: To assess differences in the rates of angiography and subsequent revascularisation for Aboriginal and non-Aboriginal South Australians who presented with an acute coronary syndrome (ACS); to explore the reasons for any observed differences.
Design: Analysis of administrative data with logistic regression modelling to assess the relationship between Aboriginal status and the decision to undertake diagnostic angiography. A detailed medical record review of Aboriginal admissions was subsequently undertaken.
Setting: Emergency ACS admissions to SA cardiac catheterisation hospitals, 2007–2012.
Participants: 13 701 admissions of patients with an ACS, including 274 Aboriginal patients (2.1%).
Major outcome measures: Rates of coronary angiography and revascularisation; documentation of justification for non-invasive management.
Results: After adjustment for age, comorbidities and remoteness, Aboriginal patients presenting with an ACS were significantly less likely than non-Aboriginal patients to undergo angiography (odds ratio [OR], 0.4; 95% CI, 0.3–0.5; P < 0.001). There was no significant difference in the rates of revascularisation for Aboriginal and non-Aboriginal patients who had undergone angiography. Reasons for Aboriginal patients not undergoing angiography included symptoms being deemed non-cardiac (16%), non-invasive test performed (8%), and discharge against medical advice (11%); the reasons were unclear for 36% of Aboriginal patients.
Conclusions: After controlling for age and other factors, the rate of coronary angiography was lower among Aboriginal patients with an ACS in SA. The reasons for this disparity are complex, including patient-related factors and their preferences, as well as the appropriateness of the intervention. Improved consideration of the hospital experience of Aboriginal patients must be a priority for reducing health care disparities.