


The known The incidence of some cancers (breast, bowel, prostate, melanoma) is lower among Indigenous Australians than among other Australians, while others (lung, other smoking-related cancers, cervix, liver) are more common.
The new In the Northern Territory, these disparities have become less marked since 1991, but to the disadvantage of Indigenous people: the incidence of several formerly lower incidence cancers increased, but that of higher incidence cancers did not decline.
The implications These changes are consistent with rapid increases in the prevalence of chronic diseases in the NT Indigenous population, with implications for cancer screening and treatment centres with an Indigenous clientele.
Evidence has accumulated over the past 10 years of large disparities between Indigenous and other Australians in cancer incidence, diagnosis, treatment and outcomes. The incidence of some types of cancer, including breast, prostate and bowel cancers, is lower among Indigenous Australians, but the incidence of several high fatality cancers, including lung, other tobacco-related cancers, and liver cancer, is much higher; further, survival is lower for most types of cancer.1-3 Indigenous people with cancer are more likely to be diagnosed with advanced disease, and less likely to receive optimal treatment.1,4
Evidence about whether these disparities are being reduced is lacking, largely because of historical deficiencies in data on Indigenous Australians in cancer registers and other relevant data sources.2 The Northern Territory is the only Australian state or territory where long term trends in Indigenous health can be studied. High quality health data (including life tables) for Indigenous people are available for the NT; Indigenous identification is high, and the willingness to identify as an Indigenous person has been stable over several decades. Increases in the estimated size of the Indigenous population have been consistent with natural increase and low interstate migration. Registration of cases by the NT Cancer Register (NTCR) is close to complete, with reliable data on the Indigenous status of patients since 1991;5 the accuracy of Indigenous status as recorded by the NT Department of Health Client Master Index (the primary source of Indigenous status data for the NTCR) was estimated to be 94% in 1997 and 98% in 2011.6 It is thus possible to monitor cancer trends for the NT Indigenous population over two decades.
In this study, we examined trends in cancer incidence and survival for the Indigenous and non-Indigenous populations of the NT between 1991 and 2012.
Methods
We undertook a retrospective analysis of population-based cancer registration data. The following information on NT residents diagnosed with cancer during 1991–2012 was obtained from the NTCR: date of birth, sex, Indigenous status, location of residence, date of diagnosis, cancer site, date of death, cause of death. Cancer site and cause of death were classified according to the International Classification of Diseases, version 10 (ICD-10). ICD-10 categories C01–C14 were combined as “head and neck cancers”, and C18–C20 as “bowel cancers”. Estimated Resident Population (ERP) statistics for the NT (by year, sex, 5-year age group, and Indigenous status), produced by the Australian Bureau of Statistics, were used for calculating incidence rates.7 Population estimates for the NT non-Indigenous population were calculated by subtracting the Indigenous ERP from the total NT ERP.
Age-adjusted incidence rates for all cancers combined and for specific cancer sites were calculated and analysed according to Indigenous status, sex, and period of diagnosis (1991–1996 or 2007–2012), adjusted for the age distribution of the total Australian population in 2001. Age-adjusted incidence rate ratios (with 95% confidence intervals, CIs) compared cancer incidence rates for the NT Indigenous and NT non-Indigenous populations with that for other Australians (the combined populations of Victoria, Queensland, Western Australia, South Australia and Tasmania; data from the New South Wales and the Australian Capital Territory cancer registries were not available for the full study period) during 2007–2012. The relative changes between 1991–1996 and 2007–2012 in cancer incidence for the two NT populations were also compared with those for other Australians.
Five-year survival (with 95% CIs) was calculated using the cohort relative survival method. Life tables for the total Australian population were used to calculate relative survival for the NT non-Indigenous population;8 life tables for the NT Indigenous population were calculated from NT Indigenous death data and population estimates.9 Poisson regression was used to model excess cancer mortality (calculated by the relative survival method10) for Indigenous patients (relative to non-Indigenous patients) for individual cancer sites, adjusted for follow-up time, period of diagnosis, age at diagnosis, and sex, and to model time trends in excess mortality for all cancers combined, adjusted for age at diagnosis, sex, and cancer site. Statistical analyses were performed in Stata 13 (StataCorp).
Ethics approval
The study was approved by the Human Research Ethics Committee of the NT Department of Health and the Menzies School of Health Research (reference, 2014-2286).
Results
Incidence
Case numbers for nine cancer sites were sufficient for analysing time trends in the NT between 1991 and 2012. The incidence of cancer in the NT non-Indigenous population during 2007–2012 was similar to that for other Australians for most cancer sites (Box 1). Exceptions included the moderately higher incidence of cervical cancer and smoking-related cancers (lung, head and neck), and the moderately lower incidence of prostate cancer. The incidence of lung cancer had decreased since 1991–1996, but remained higher than for other Australians. The decline in the incidence of cervical cancer was similar to that for other Australians. There was no statistically significant change in the incidence of other cancers (Box 1, Box 2).
For the NT Indigenous population, the incidence of all cancers combined increased between 1991–1996 and 2007–2012, but was still slightly lower than for other Australians during 2007–2012. The incidence of cervical cancer in the NT Indigenous population decreased by 65%, but remained more than twice that for other Australians. In contrast, the incidence of breast cancer more than tripled, from a very low level in the early 1990s to an incidence only moderately lower than that for other Australians during 2007–2012. The incidence of lung cancer among Indigenous NT people was higher than for other Australians during both periods, and had not changed since 1991–1996. The incidence of head and neck cancers more than doubled, and was more than four times that for other Australians during 2007–2012. Bowel cancer incidence had doubled, but remained much lower than for other Australians in 2007–2012. The incidence of prostate cancer was also much lower than for other Australians in 2007–2012; it had increased since the early 1990s, but only 57 cases over 22 years had been reported. Melanoma is very uncommon among Indigenous people; its incidence during 2007–2012 was less than one-tenth of that for other Australians, and only 15 cases had been recorded over 22 years. The incidence of liver cancer was four times higher for the NT Indigenous population than for other Australians during 2007–2012, and had not declined over the two decades examined (Box 1, Box 2).
The incidence of cancer of unknown primary site decreased between the two periods for both Indigenous and non-Indigenous people in the NT, but remained higher for both NT populations than for other Australians during 2007–2012 (Box 1, Box 2).
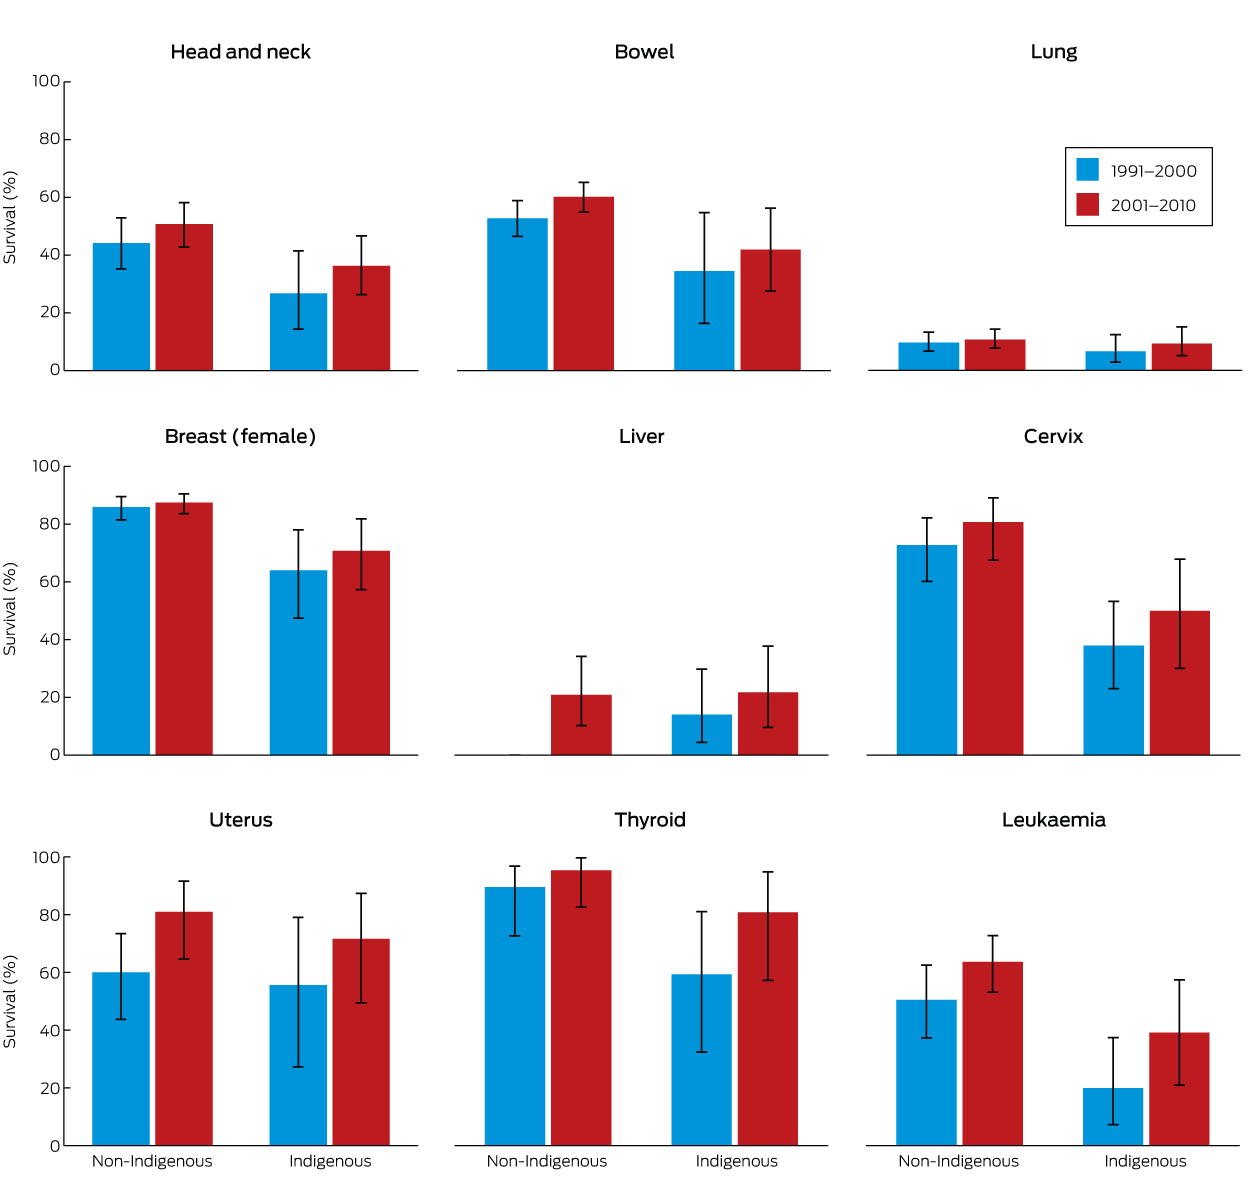
Survival
Mortality during the 5 years after diagnosis was higher for NT Indigenous than for NT non-Indigenous patients for all cancer sites examined, with the exception of liver cancer (Box 3). The excess hazard ranged from 40% for lung cancer to mortality that was four times as high for thyroid cancer and leukaemia. There was a consistent increase in survival for both Indigenous and non-Indigenous people between 1991–2000 and 2001–2010 for all cancer sites examined, but none of the differences were statistically significant (Box 4). In multivariable regression analysis of all cancer sites combined (adjusted for age, sex, and site), excess mortality in the 5 years after diagnosis was lower for those diagnosed during 2001–2010 than for those diagnosed during 1991–2000 (NT Indigenous patients: excess hazard ratio [EHR], 0.82; 95% CI, 0.72–0.93; NT non-Indigenous patients: EHR, 0.77; 0.71–0.83).
Discussion
The incidence of cancer and survival for patients with cancer was similar for the NT non-Indigenous population and people elsewhere in Australia. This is not surprising, as the lifestyles and socio-economic conditions of NT non-Indigenous residents are similar to those of Australians elsewhere, and there is a high degree of migration of non-Indigenous people between the NT and other parts of Australia. An exception is the higher prevalence of smoking in the NT non-Indigenous population,11 and this is reflected in their higher incidence of some smoking-related cancers.
The incidence of cervical cancer decreased between 1991–1996 and 2007–2012 among both Indigenous and non-Indigenous women in the NT, as it did among Australian women elsewhere. The reduction was greater for NT Indigenous than for NT non-Indigenous women (65% v 45%), although the difference was not statistically significant. Participation in cervical screening was very low (about 30%) among Indigenous women in remote areas (which includes two-thirds of the NT Indigenous population) during the late 1990s, but increased during the early 2000s to more than 45% by 2009–2010, and exceeded 70% in some remote regions.12 Screening participation rates for urban Indigenous women are unknown. The introduction of the human papillomavirus (HPV) vaccine in 2007 will also reduce the incidence of cervical cancer, although vaccination coverage in 2007 was 17% lower for Indigenous than for non-Indigenous girls in the NT.13
For the NT Indigenous population, the incidence and outcomes of cancer are very different to those for other Australians. As has been documented in the NT14 and nationally,2 the incidence of some cancers (lung and other smoking-related cancers, liver and cervical cancers) is much higher in Indigenous than in non-Indigenous people, while the incidence of other cancers (breast, bowel, prostate, melanoma of the skin) is much lower. Some of these differences lessened in the NT between 1991–1996 and 2007–2012, but, with the exception of cervical cancer, the changes have all been negative for Indigenous people: the incidence of breast, bowel and prostate cancers increased, while the incidence of liver and smoking-related cancers did not.
Breast, prostate and bowel cancers are among the most common cancers in Australia. The NT Indigenous population had a very low incidence of these cancers in 1991–1996, but the incidence of breast, bowel and, possibly, prostate cancers has risen markedly during the past two decades. Elsewhere in Australia, the incidence of these cancers is lower among Indigenous than among non-Indigenous Australians (breast cancer, 30% lower; prostate cancer, 40% lower; bowel cancer, 20% lower), but these differences are smaller than in the NT.2 The very low incidence of these cancers in the NT Indigenous population will probably not persist, and the incidence of breast cancer is already close to overall Australian rates. Mammographic screening commenced in the NT in the mid-1990s, but with low participation by Indigenous women (18% in 1997–1998, 24% in 2009–2010),12 so the increased number of women diagnosed with breast cancer in recent years probably does not reflect asymptomatic cases being diagnosed soon after the screening program commenced.
On the other hand, the incidence of most cancers more common among Indigenous than among other Australians (lung, other smoking-related cancers, liver cancer) did not decline in the NT Indigenous population over the study period. Smoking is much more common in the NT Indigenous population than among Indigenous people elsewhere or among other Australians; in 2012, 66% of NT Indigenous men and 47% of NT women were current smokers, compared with about 40% of Indigenous people nationally and 18% of all Australians.11 The prevalence of smoking among Indigenous people has started falling, but remains higher in the NT than elsewhere.11,15
The very high incidence of liver cancer in NT Indigenous people is largely explained by the high prevalence of chronic hepatitis B virus infection.16 Universal childhood vaccination against hepatitis B commenced in the NT in 1990 and should eventually reduce the burden of liver cancer; as most liver cancer is diagnosed in people over 50 years of age, however, the protective effect of childhood vaccination is not yet apparent. There are also concerns that the vaccine is less effective in the NT Indigenous population because the vaccine is not matched to the dominant hepatitis B virus genotype in this population (C4).17
Cancer survival increased between 1991–1996 and 2007–2010 for both Indigenous and non-Indigenous cancer patients in the NT. The NTCR does not include data on stage at diagnosis, so it is not known whether improved survival is a result of earlier diagnosis (ie, more people being diagnosed with localised disease), more effective treatment, or a combination of the two factors. Despite the improvement, survival is still lower for Indigenous than for non-Indigenous patients. A study of NT residents diagnosed with five common cancers during the 1990s found that Indigenous patients were less likely to be diagnosed with localised disease, to commence curative treatment, and to complete curative treatment if they commenced it.18 Chronic disease comorbidity is also more common among Indigenous than other Australians, particularly in the NT, but there have been no studies of the effect of comorbidity on differences in cancer survival. Studies that compared survival of Indigenous and non-Indigenous patients with other serious conditions (acute myocardial infarct, stroke, kidney failure)19-21 have found that the higher prevalence of comorbid chronic diseases is partly responsible for lower survival among Indigenous patients. It is likely that the higher prevalence of chronic diseases in Indigenous people with cancer has a similar effect on their survival.
It cannot be assumed that findings for Indigenous people in the NT can be generalised to Indigenous people elsewhere. The NT is home to only 13% of the Australian Indigenous population, with about two-thirds living in remote areas (compared with 21% for the total Australian Indigenous population). Social and economic disadvantage is even greater for Indigenous people in the NT than elsewhere.15 Semi-national estimates indicate that the incidence of cancers of the bowel and prostate, for instance, is not as low for Indigenous people elsewhere in Australia.2,14 It appears that their low incidence in the NT Indigenous population was an historical advantage that is dissipating, while the high incidence of smoking-related and other cancer types is not declining.
Why is this so? The lifestyle changes of Indigenous people, from nomadic hunter–gatherers to sedentary consumers, occurred later in the NT than in most of the rest of Australia, as late as the 1950s and 1960s for many people. This was followed by the introduction of the cash-based welfare economy during the 1970s, which increased the quantity and changed the composition of the food they consumed, and also increased their consumption of tobacco and alcohol. The lifestyle of many Indigenous people now in their 50s and 60s, particularly during their younger years, was dramatically different from that of their parents. Further, the lifetime cumulative exposure to cancer risk factors related to lifestyle and behaviour for Indigenous people who are currently middle-aged and older may be very different to that of the previous generation. No detailed data on cancer risk factors for the NT Indigenous population before the mid-1990s are available, so it is not possible to investigate the impact of major changes that occurred from the 1950s to 1970s on their exposure to such factors.
That cancer has a greater impact on Indigenous than on other Australians has been documented in the NT and elsewhere. We found that trends in cancer incidence over the past two decades have not been positive for the NT Indigenous population, except that the incidence of cervical cancer has declined. The improved cancer survival that we detected is a sign of progress, although from a low starting point. While recent developments in NT cancer services — most notably the opening of a specialised radiation and chemotherapy centre in Darwin in 2010 — may further improve cancer treatment and survival, the excess burden of cancer in NT Indigenous Australians (higher incidence and lower survival) will persist until exposure to lifestyle risks is reduced, particularly the extraordinarily high prevalence of smoking.
Box 1 – Incidence of cancer, 1991–1996 and 2007–2012, by cancer site, for Northern Territory Indigenous and non-Indigenous Australians, and for other Australians*
Cancer site |
NT Indigenous |
NT non-Indigenous |
Other Australians |
Incidence rate ratio (95% CI) (v other Australians) |
|||||||||||
Cases |
Rate† |
Cases |
Rate† |
Rate† |
NT Indigenous |
NT non-Indigenous |
|||||||||
1991–2012 |
1991–1996 |
2007–2012 |
1991–2012 |
1991–1996 |
2007–2012 |
1991–1996 |
2007–2012 |
2007–2012 |
2007–2012 |
||||||
Head and neck |
196 |
16.2 |
41.4 |
373 |
16.6 |
16.4 |
9.6 |
9.7 |
4.25 (3.34–5.40) |
1.68 (1.38–2.04) |
|||||
Bowel |
110 |
9.5 |
20.8 |
994 |
66.7 |
60.6 |
65.3 |
62.0 |
0.34 (0.24–0.47) |
0.98 (0.87–1.10) |
|||||
Liver |
103 |
21.2 |
27.3 |
90 |
5.4 |
6.2 |
2.9 |
5.9 |
4.66 (3.34–6.51) |
1.07 (0.78–1.46) |
|||||
Lung |
359 |
79.0 |
80.9 |
897 |
77.5 |
54.9 |
46.8 |
43.9 |
1.84 (1.52–2.23) |
1.25 (1.10–1.42) |
|||||
Melanoma of skin |
15 |
0.2 |
3.4 |
1010 |
37.6 |
44.3 |
42.5 |
48.8 |
0.07 (0.03–0.17) |
0.91 (0.80–1.03) |
|||||
Breast (women) |
196 |
24.2 |
90.5 |
1087 |
96.3 |
104.5 |
108.2 |
116.9 |
0.77 (0.61–0.98) |
0.89 (0.80–1.00) |
|||||
Cervix |
86 |
44.4 |
15.6 |
147 |
17.8 |
9.9 |
11.9 |
7.0 |
2.22 (1.30–3.80) |
1.40 (1.02–1.92) |
|||||
Prostate |
57 |
23.4 |
50.5 |
1064 |
131.7 |
131.3 |
149.0 |
180.0 |
0.28 (0.19–0.41) |
0.73 (0.65–0.81) |
|||||
Unknown primary |
169 |
39.7 |
22.0 |
325 |
32.4 |
17.2 |
17.8 |
11.8 |
1.87 (1.32–2.65) |
1.46 (1.14–1.88) |
|||||
Non-Hodgkin lymphoma |
56 |
6.3 |
12.5 |
296 |
14.8 |
16.4 |
17.0 |
19.8 |
0.64 (0.38–1.06) |
0.83 (0.66–1.04) |
|||||
All cancers |
2057 |
303.5 |
435.9 |
8621 |
498.9 |
456.1 |
461.2 |
486.6 |
0.90 (0.83–0.97) |
0.94 (0.90–0.98) |
|||||
* All other states, except New South Wales and the Australian Capital Territory. † Age-adjusted incidence rate per 100 000 person-years. | |||||||||||||||
Box 2 – Percentage change in age-adjusted cancer incidence between 1991–1996 and 2007–2012 (with 95% CIs), by cancer site, for Northern Territory Indigenous and non-Indigenous Australians, and for other Australians*
Cancer site |
NT Indigenous |
NT non-Indigenous |
Other Australians |
||||||||||||
Head and neck |
156% (60 to 311%) |
–2% (–31 to 39%) |
1% (–2 to 5%) |
||||||||||||
Bowel |
120% (13 to 329%) |
–9% (–27 to 13%) |
–5% (–6 to –4%) |
||||||||||||
Liver |
29% (–35 to 157%) |
16% (–43 to 137%) |
101% (91 to 112%) |
||||||||||||
Lung |
2% (–26 to 41%) |
–29% (–43 to –13%) |
–6% (–8 to –5%) |
||||||||||||
Melanoma of skin |
1460% (83 to 13 198%) |
18% (–6 to 48%) |
15% (13 to 17%) |
||||||||||||
Breast (female) |
274% (111 to 563%) |
9% (–11 to 33%) |
8% (7 to 9%) |
||||||||||||
Cervix |
–65% (–83 to –27%) |
–45% (–66 to –11%) |
–41% (–43 to –38%) |
||||||||||||
Prostate |
116% (–30 to 568%) |
0 (–22 to 27%) |
21% (19 to 22%) |
||||||||||||
Unknown primary |
–45% (–66 to –11%) |
–47% (–62 to –25%) |
–34% (–36 to –32%) |
||||||||||||
Non-Hodgkin lymphoma |
99% (–14 to 361%) |
11% (–28 to 71%) |
16% (14 to 19%) |
||||||||||||
All cancers |
44% (23 to 68%) |
–9% (–15 to –1%) |
6% (5 to 6%) |
||||||||||||
* Based on age-adjusted incidence rate ratios. | |||||||||||||||
Box 3 – Excess hazard ratios for cancer death within 5 years for cancers diagnosed in the Northern Territory during 1991–2010 (Indigenous v non-Indigenous patients)*
Cancer site |
Excess hazard ratio (95% CI) |
||||||||||||||
Head and neck |
2.1 (1.6–2.7) |
||||||||||||||
Bowel |
2.2 (1.6–3.0) |
||||||||||||||
Lung |
1.4 (1.2–1.6) |
||||||||||||||
Breast (women) |
3.1 (2.1–4.6) |
||||||||||||||
Liver |
1.1 (0.8–1.6) |
||||||||||||||
Cervix |
3.2 (2.0–5.2) |
||||||||||||||
Uterus |
2.2 (1.0–4.6) |
||||||||||||||
Thyroid |
4.5 (1.3–15) |
||||||||||||||
Leukaemia |
4.0 (2.6–6.1) |
||||||||||||||
* Estimated by Poisson regression, adjusted for follow-up time, period of diagnosis, age at diagnosis, and sex. | |||||||||||||||
Received 17 May 2016, accepted 26 August 2016
- John R Condon1
- Xiaohua Zhang1
- Karen Dempsey2
- Lindy Garling1
- Steven Guthridge1
- 1 Health Gains Planning Branch, Northern Territory Department of Health, Darwin, NT
- 2 Menzies School of Health Research, Charles Darwin University, Darwin, NT
The study was conducted by the Northern Territory Department of Health without external funding. We acknowledge the support services (coding, data management and quality assurance) provided to the Northern Territory Cancer Registry by the South Australian Cancer Registry, the South Australian Department of Health, and the Clinical Registries Branch, South Australian Health and Medical Research Institute.
We are all current or recent employees of the Northern Territory Department of Health, which provides cancer prevention, diagnosis and treatment services for the people of the NT, and are currently or have recently been involved in the operation of the NT Cancer Registry.
- 1. Cunningham J, Rumbold AR, Zhang X, Condon JR. Incidence, aetiology, and outcomes of cancer in Indigenous peoples in Australia. Lancet Oncol 2008; 9: 585-595.
- 2. Australian Institute of Health and Welfare. Cancer in Australia: an overview 2014. Canberra: AIHW, 2015. http://www.aihw.gov.au/publication-detail/?id=60129550047 (accessed May 2016).
- 3. Condon JR, Zhang X, Baade P, et al. Cancer survival for Aboriginal and Torres Strait Islander Australians: a national study of survival rates and excess mortality. Popul Health Metr 2014; 12: 1.
- 4. Roder D, Webster F, Zorbas H, Sinclair S. Breast screening and breast cancer survival in Aboriginal and Torres Strait Islander women of Australia. Asian Pac J Cancer Prev 2012; 13: 147-155.
- 5. Condon JR, Zhao Y, Armstrong B, Barnes A. Northern Territory Cancer Registry: data quality, 1981–2001. Darwin: Northern Territory Department of Health and Community Services, 2004. http://digitallibrary.health.nt.gov.au/dspace/bitstream/10137/99/1/cancer_register_data_quality_1981_2001.pdf (accessed July 2016).
- 6. Foley M, Zhao Y, Condon JR. Demographic data quality assessment for Northern Territory public hospitals 2011. Darwin: Northern Territory Department of Health, 2012. http://digitallibrary.health.nt.gov.au/prodjspui/handle/10137/513 (accessed July 2016).
- 7. Australian Bureau of Statistics. 3238.0 Estimates and projections, Aboriginal and Torres Strait Islander Australians, 2001 to 2026. Canberra: ABS, 2015. http://www.abs.gov.au/AUSSTATS/abs@.nsf/Lookup/3238.0Main+Features12001%20to%202026?OpenDocument (accessed July 2016).
- 8. Australian Bureau of Statistics. 3302.0.55.001. Life tables, states, territories and Australia. Canberra: ABS, 2016. http://www.abs.gov.au/AUSSTATS/abs@.nsf/Lookup/3302.0.55.001Main+Features12012-2014?OpenDocument (accessed May 2016).
- 9. Wilson T, Condon JR, Barnes T. Northern Territory indigenous life expectancy improvements, 1967–2004. Aust N Z J Public Health 2007; 31: 184-188.
- 10. Dickman PW, Sloggett A, Hills M, Hakulinen T. Regression models for relative survival. Stat Med 2004; 23: 51-64.
- 11. Chondur R, Coffey P, Guthridge S. Smoking prevalence Northern Territory — 1994 to 2013. Darwin: Northern Territory Department of Health, 2014. http://digitallibrary.health.nt.gov.au/prodjspui/handle/10137/603 (accessed July 2016).
- 12. Zhang X, Condon JR, Douglas F, et al. Women’s cancers and cancer screening in the Northern Territory. Darwin: Northern Territory Department of Health, 2012. http://digitallibrary.health.nt.gov.au/prodjspui/handle/10137/540 (accessed May 2016).
- 13. Brotherton JM, Murray SL, Hall MA, et al. Human papillomavirus vaccine coverage among female Australian adolescents: success of the school-based approach. Med J Aust 2013; 199: 614-617. <MJA full text>
- 14. Zhang X, Condon JR, Dempsey KE, Garling L. Cancer in the Northern Territory 1991–2010: incidence, mortality and survival. Darwin: Northern Territory Department of Health, 2014. http://digitallibrary.health.nt.gov.au/prodjspui/handle/10137/617 (accessed May 2016).
- 15. Australian Bureau of Statistics. 4714.0. National Aboriginal and Torres Strait Islander social survey, 2014–15. Canberra: ABS, 2016. http://www.abs.gov.au/AUSSTATS/abs@.nsf/mf/4714.0 (accessed May 2016).
- 16. Parker C, Tong SY, Dempsey K, et al. Hepatocellular carcinoma in Australia’s Northern Territory: high incidence and poor outcome. Med J Aust 2014; 201: 470-474. <MJA full text>
- 17. Littlejohn M, Davies J, Yuen L, et al. Molecular virology of hepatitis B virus, sub-genotype C4 in northern Australian Indigenous populations. J Med Virol 2014; 86: 695-706.
- 18. Condon JR, Armstrong BK, Barnes A, et al. Stage at diagnosis and cancer survival of Indigenous Australians in the Northern Territory. Med J Aust 2005; 182: 277-280. <MJA full text>
- 19. Zhao Y, Condon J, You J, et al. Assessing improvements in survival for stroke patients in the Northern Territory 1992–2013: a marginal structural analysis. Aust Health Rev 2015; 39: 437-443.
- 20. Condon JR, You J, McDonnell J. Performance of comorbidity indices in measuring outcomes after acute myocardial infarction in Australian Indigenous and non-Indigenous patients. Intern Med J 2012; 42: e165-e173.
- 21. Lawton PD, Cunningham J, Zhao Y, et al. Survival of Indigenous Australians receiving renal replacement therapy: closing the gap? Med J Aust 2015; 202: 200-204. <MJA full text>
Abstract
Objective: To assess trends in cancer incidence and survival for Indigenous and non-Indigenous Australians in the Northern Territory.
Design: Retrospective analysis of population-based cancer registration data.
Setting: New cancer diagnoses in the NT, 1991–2012.
Main outcome measures: Age-adjusted incidence rates; rate ratios comparing incidence in NT Indigenous and non-Indigenous populations with that for other Australians; 5-year survival; multivariable Poisson regression of excess mortality.
Results: The incidence of most cancers in the NT non-Indigenous population was similar to that for other Australians. For the NT Indigenous population, the incidence of cancer at several sites was much higher (v other Australians: lung, 84% higher; head and neck, 325% higher; liver, 366% higher; cervix, 120% higher). With the exception of cervical cancer (65% decrease), incidence rates in the Indigenous population did not fall between 1991–1996 and 2007–2012. The incidence of several other cancers (breast, bowel, prostate, melanoma) was much lower in 1991–1996 than for other Australians, but had increased markedly by 2007–2012 (breast, 274% increase; bowel, 120% increase; prostate, 116% increase). Five-year survival was lower for NT Indigenous than for NT non-Indigenous patients, but had increased for both populations between 1991–2000 and 2001–2010.
Conclusion: The incidence of several cancers that were formerly less common in NT Indigenous people has increased, without a concomitant reduction in the incidence of higher incidence cancers (several of which are smoking-related). The excess burden of cancer in this population will persist until lifestyle risks are mitigated, particularly by reducing the extraordinarily high prevalence of smoking.