


Concerns are increasing in Australia and internationally that the supply of medical oncologists (MOs) is insufficient to meet the rising demand.1-5 The only study of the medical and haematological oncology workforce in Australia was published in 2001.6 This study found that there were 180 MOs in active practice in Australia (0.9 per 100 000 population), and an estimated shortfall of at least 40 medical and haematological oncologists.
The best estimate of the number of MOs in Australia in 2009 was 311, based on the membership of the Medical Oncology Group of Australia (MOGA), the peak representative body for MOs in Australia. This equates to 1.4 MOs per 100 000 population. Despite the increase since 2001, this figure is still well below comparable international figures, such as the 3.5 MOs per 100 000 population reported in the United States in 2005.7
nature of the practice (public, private or other; metropolitan or rural)
current workforce (number and sex of MOs; full-time equivalent [FTE] MOs [filled and unfilled positions]; additional clinical appointments)
workload (new patients; new patients who received chemotherapy; new chemotherapy courses)
future supply of MOs (advanced training positions; overseas-trained physicians [OTPs]; MOs expected to retire between 2009 and 2014).
The number of FTE MOs describes the number of full-time equivalent staff members each working 40 hours per week. We distinguished chemotherapy agents from other anticancer agents according to the SEER*Rx Interactive Antineoplastic Drug Database.8 “Rural” included all non-metropolitan locations by the rural, remote and metropolitan areas classification.9
Data were obtained from the Royal Australasian College of Physicians (RACP) about the numbers of medical oncology advanced trainees registered with the RACP and trainees awarded fellowship between 2005 and 2009. The number of new cases of cancer reported in Australia in 2008 was obtained from state and territory cancer registries.10 The projected number of new cases of cancer in Australia during 2014 assumed a growth of 2% per year.10 The populations of each state and territory in June 2009 were obtained from the Australian Bureau of Statistics.11 An optimal chemotherapy utilisation rate of 51% was based on previous modelling.12 Optimal workloads of 150 and 180 new patients seen per FTE MO per year were based on Canadian and Australian benchmarks.1,13
Descriptive statistics were used to summarise the responses to the survey at state, territory and national levels. Calculations excluded practices that reported missing data for the relevant item. The chemotherapy utilisation rate was calculated as the ratio of the number of new patients reported in the survey to be receiving chemotherapy, and the new cases of cancer reported to state and territory cancer registries.
Most practices surveyed were in metropolitan areas, a minority were private practices and there were few solo practitioners. Sixty-five MOs (14%) attended rural outreach clinics (Box 1).
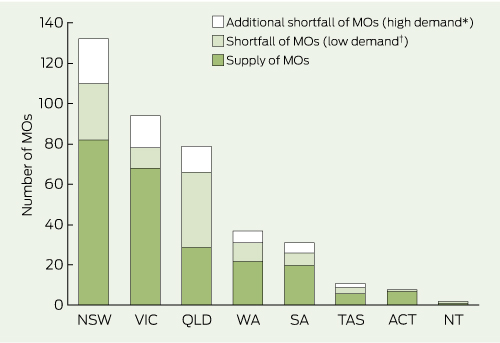
Of 476 medical oncology positions, 49% comprised FTE MOs (Box 2). Three-quarters of the FTE MOs were found in the three most populous states or territories (New South Wales, Victoria and Queensland). The national average FTE per medical oncology position was 0.5, and almost one-third of the medical oncology positions (29%) were filled by women. There were more medical oncology positions in public than private practices. Few medical oncology positions were located in rural centres.
49 073 new patients with cancer were reported to have been seen in 2008, 43% of the 115 126 estimated new cases of cancer.10 An average of 270 new patients were reported to have been seen per FTE MO. 21 954 new patients seen in 2008 (45%) received at least one course of chemotherapy, with an average of 160 (ranging from 94 in South Australia to 198 in NSW) new patients receiving chemotherapy per FTE MO. The national chemotherapy utilisation rate was 19%.
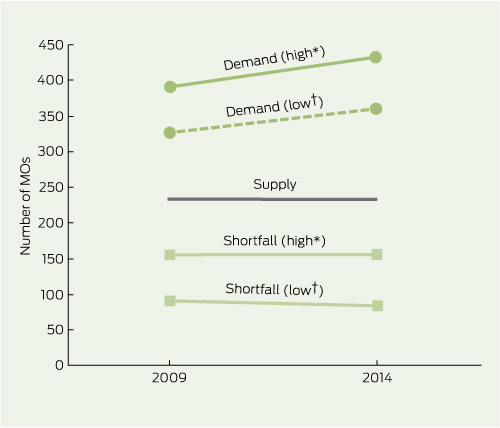
For an optimal workload of 150 new patients/FTE MO/year, the demand for FTE MOs was 391 in 2009 and 432 in 2014 (Box 3). For an optimal workload of 180 new patients, the demand was 326 in 2009 and 361 in 2014. The highest demand (over optimal workload) for FTE MOs was in NSW.
MOs in Australia in 2008 had a high clinical workload compared with international benchmarks. The average number of new patients per FTE MO of 270 is well above Canadian recommendations of 160 to 1751 and the suggested Australian benchmark of 150 new patients per year.13 Reduction of this clinical workload requires training more than double the estimated shortage of FTE MOs, given that the average FTE per MO was 0.5 (Box 2). The increasing diversification of MOs into non-clinical roles will only increase the demand on clinical responsibilities should the shortage not be addressed.
The national chemotherapy utilisation rate was surprisingly low, and well below the evidence-based Australian standard of 51%.12 This is of concern because it implies that some patients who may benefit from chemotherapy are not receiving it. Possible explanations for a low chemotherapy utilisation rate include suboptimal referral rates of patients with cancer, patients referred with advanced rather than early stage cancer, and low prescribing rates of chemotherapy to new patients with cancer. We suspect that we have underestimated the chemotherapy utilisation rate, because only one-third of centres (representing about 60% of the total national MO workload) reported the number of new patients who received chemotherapy. However, even correcting for the underestimate, it is unlikely that chemotherapy utilisation in Australia approximates expected standards.
Although not directly comparable, our findings are similar to the results of the most recent study of the oncology workforce in the US,7 and studies of the medical workforce in other oncology specialties such as radiation oncology14 and palliative care.15 The US study found that demand for MOs is expected to rise by 48% between 2005 and 2020, but supply will only rise 14%, translating into a shortfall of 2550 to 4080 oncologists (about one-quarter to one-third of the 2005 supply).
Despite these limitations, we provide a snapshot of the current medical oncology workforce in Australia, and an estimate of the current and future workforce shortages. Addressing the shortage needs a multilevel approach aimed at increasing the supply of MOs by increasing recruitment, training and participation rates, improving clinical practice efficiency, and the introduction of innovative methods of service delivery through involvement of other health professionals and use of models of shared care.
Received 28 March 2011, accepted 5 September 2011
- Prunella L Blinman1
- Peter Grimison2
- Michael B Barton3
- Sally Crossing4
- Euan T Walpole5
- Nora Wong6
- Kay Francis6
- Bogda Koczwara7
- 1 Medical Oncology, Concord Repatriation General Hospital, Sydney, NSW.
- 2 Medical Oncology, Sydney Cancer Centre, Sydney, NSW.
- 3 Faculty of Medicine, University of New South Wales, Sydney, NSW.
- 4 Cancer Voices NSW, Sydney, NSW.
- 5 Cancer Services, Princess Alexandra Hospital, Brisbane, QLD.
- 6 Medical Oncology Group of Australia, Sydney, NSW.
- 7 Medical Oncology, Flinders Medical Centre, Flinders University, Adelaide, SA.
No relevant disclosures.
- 1. Systemic Therapy Task Force. STTF Report. Ontario: Cancer Care Ontario, 2000. https://www.cancercare.on.ca/common/pages/UserFile.aspx?fileId=14436 (accessed Nov 2011).
- 2. Erikson C, Salsberg E, Forte G, et al. Future supply and demand for oncologists: challenges to assuring access to oncology services. J Oncol Pract 2007; 3: 79-86.
- 3. Hortobagyi GN; American Society of Clinical Oncology. A shortage of oncologists? The American Society of Clinical Oncology workforce study. J Clin Oncol 2007; 25: 1468-1469.
- 4. Warren JL, Mariotto AB, Meekins A, et al. Current and future utilization of services from medical oncologists. J Clin Oncol 2008; 26: 3242-3247.
- 5. Barrett J. Building for the future. Clin Oncol (R Coll Radiol) 2009; 21: 573-574.
- 6. Australian Medical Workforce Advisory Committee. The specialist medical and haematological oncology workforce in Australia: supply, requirements and projections, 2001–2011. Sydney: AMWAC, 2001. http://www.ahwo. gov.au/publications.asp (accessed Nov 2011).
- 7. Association of American Medical Colleges Center for Workforce Studies. Forecasting the supply of and demand for oncologists: a report to the American Society of Clinical Oncology. Alexandria, Va: ASCO, 2007. http://www.asco. org/ASCO/Downloads/Cancer%20Research/Oncology%20Workforce%20Report%20FINAL.pdf (accessed Nov 2011).
- 8. National Cancer Institute, Division of Cancer Control and Population Sciences, Surveillance Research Program. SEER*Rx Interactive Antineoplastic Drugs Database, version 1.5.0. Bethesda, Md: NCI, 2010. http://www.seer. cancer.gov/tools/seerrx/ (accessed Nov 2011).
- 9. Australian Institute of Health and Welfare. Rural, Remote and Metropolitan Area (RRMA) classification. Canberra: AIHW, 2011. http://www. aihw.gov.au/rural-health-rrma-classification/ (accessed Dec 2011).
- 10. Australian Institute of Health and Welfare, Australasian Association of Cancer Registries. Cancer in Australia 2010: an overview. Canberra: AIHW, 2010. (AIHW Cat. No. CAN 56; Cancer Series No. 60.) http://www.aihw.gov.au/publication-detail/?id=6442472459 (accessed Dec 2011).
- 11. Australian Bureau of Statistics. Australian demographic statistics, Jun 2009. Canberra: ABS, 2009. http://www.abs.gov.au/AUSSTATS/abs@.nsf/allprimarymainfeatures/EB76EA379A 44E842CA2576F0001C70C9?opendocument (accessed Dec 2011).
- 12. Ng WL, Jacob S, Delaney G, et al. Optimal chemotherapy utilization rate in cancer care: setting an evidence-based benchmark for quality improvement. J Clin Oncol 2010; 28 (15 Suppl): abstract 6099.
- 13. Barton M, Gabriel GS, Shafiq J. Overview of cancer treatment services in Western Australia July 2008. Perth: Cancer Council Western Australia, 2008. http://www.cancerwa.asn.au/resources/Overview_of_cancer_treatment_services_in_Western_Australia.pdf (accessed Dec 2011).
- 14. Morgan G, Wigg D, Childs J. Projected requirements for radiation oncologists and trainees in Australia and New Zealand to 2007. Australas Radiol 2000; 44: 88-97.
- 15. Chiarella M, Duffield C. Workforce issues in palliative and end-of-life care. J Hosp Palliat Nurs 2007; 9: 334-341.
Abstract
Objective: To determine current and projected supply, demand and shortfall of medical oncologists (MOs) and the Australian chemotherapy utilisation rate.
Design, setting and participants: A 2009 cross-sectional observational study of Australian adult medical oncology practice work patterns.
Instrument: Electronic or paper self-administered questionnaire.
Main outcome measures: The 2009 and projected (2014) supply, demand and shortfall of full-time equivalent (FTE) MOs, and the chemotherapy utilisation rate.
Results: 476 medical oncology positions comprising 234 FTE MOs were identified. Of the 150 medical oncology practices, 117 (78%) were in metropolitan locations and 33 (22%) were in rural locations. The average number of new patients seen per FTE MO was 270 patients (ranging by state from 191 to 343). The demand for FTE MOs was estimated at 326 to 391 in 2009 and 361 to 432 in 2014. The shortfall of FTE MOs was estimated at 92 to 157 in 2009 and 84 to 156 in 2014. The chemotherapy utilisation rate was 19%.
Conclusions: The current shortage of MOs is expected to persist in the future. National strategies are needed to increase the capacity of the medical oncology workforce and the chemotherapy utilisation rate.