


The known: Overdiagnosis of some common cancers is a problem in developed countries, including Australia.
The new: After analysing changes in absolute lifetime risks for prostate, breast, renal, thyroid cancers and melanoma between 1982 and 2012, we estimated that 18% of all cancers diagnosed in women (ie, 11 000 diagnoses each year), and 24% of those in men (18 000 each year) are overdiagnosed cancers.
The implications: Cancer overdiagnosis is a substantial problem that urgently requires changes in public health policy.
The burden of cancer is increasing rapidly,1 including in Australia,2 partly because of ageing populations, reduced competing mortality from cardiovascular disease, and changes in exposure to risk factors for cancer. A further contributor is overdiagnosis, or the diagnosis of cancer in people who would never have experienced symptoms or harm had the cancer remained undetected and untreated.3,4 Overdiagnosis of certain screen‐detected cancers is common,5 including 20–50% of prostate cancer6 and 11–19% of breast cancer diagnoses.7
Cancer can also be overdiagnosed outside screening programs. Overdiagnosis of thyroid cancer8 is attributable to incidental detection during investigations of unrelated problems;9 overdiagnosis of renal cancer and melanoma is less well investigated.10
Overdiagnosis is important because of the associated iatrogenic harms and costs.3,11 Harms include the psychosocial impact of unnecessary cancer diagnoses, such as the increased suicide risk for men after being diagnosed with prostate cancer.12,13 Cancer treatments such as surgery, radiotherapy, endocrine therapy, and chemotherapy can cause physical harm, but the risks are considered acceptable if diagnosis is appropriate. When someone is unnecessarily diagnosed with cancer, however, they can only be harmed by treatment, not helped.4
Concerns about the overdiagnosis and overtreatment of cancer have led to calls to investigate the problem.5,14 To facilitate the evaluation of interventions for reducing overdiagnosis, we estimated overdiagnosis levels in Australia for five of the seven cancers for which overdiagnosis has been documented:4 melanoma, and breast, prostate, thyroid and renal cancers. Neuroblastoma was not included because neuroblastoma screening is not undertaken in Australia, and lung cancer was excluded because declines in smoking rates and the unquantified uptake of screening complicate the assessment of overdiagnosis.
Methods
We aimed to estimate the proportion of cancer diagnoses in Australia that might reasonably be attributed to overdiagnosis by calculating and comparing current and past lifetime risks of cancer, a method we developed for assessing prostate cancer overdiagnosis.15
Excess lifetime risk for five cancers with recognised overdiagnosis potential
We analysed data routinely collected by the Australian Institute of Health and Welfare.16 We extracted data on cancer‐specific diagnoses, cancer‐specific deaths, all deaths, and population numbers to calculate, separately for women and men, differences in the lifetime risks of being diagnosed with specific cancers during in 1982 and in 2012. The comparator year (1982) was the first for which publicly available national data were available; further, there was no breast cancer screening program in 1982, little informal screening for prostate cancer or melanoma, and ultrasound and computed tomography (CT) screening that could detect incidental thyroid and renal cancers was infrequent. The index year (2012) was the most recent year for which data on the included cancers (invasive and in situ) were available. We assumed that by 2012 older people were exposed to early detection (screening or incidental detection on imaging) when younger, so that any effects of early detection in preventing clinical presentation at an older age would be apparent. The AIHW data we analysed included only diagnoses of primary cancer, and only the first such diagnosis for a cancer type in an individual, consistent with international practice.
We estimated lifetime risks using the Devcan 6.7.6 software of the United States National Cancer Institute (https://surveillance.cancer.gov/devcan). Devcan applies the statistical methods described by Fay and colleagues,17 estimating lifetime risk by summing the estimated probabilities of new cancer‐specific diagnoses for each age group, adjusted for the competing risk of dying from other causes. We analysed data by 5‐year age group (0–85 years, and 85 years or more). To account for changes in mortality between 1982 and 2012, we applied the 2012 mortality distribution (cancer‐specific and all‐cause mortality data) to the 1982 cancer incidence data, increasing the estimated lifetime risk of a cancer diagnosis in 1982 to reflect the general increase in longevity between 1982 and 2012. The proportion (percentage) of cancers deemed to have been overdiagnosed was estimated as:

where PY = lifetime probability of cancer diagnosis in year Y.
To estimate 95% confidence intervals (CIs) for our estimates of numbers overdiagnosed, we assumed Poisson distributions for the population estimates of cancers in 2012 and 1982. For example: for prostate cancer, as the number of cancers in 2012 was 20 759 and the estimated number in 1982 was 12 123, the estimated number of overdiagnoses was 8636 and the standard error √(20 979 + 12 123), or 181.3; the 95% CI was consequently 8636 ± 1.96 × 181.3 (or 8281–8991).
Adjusting for in situ cancers and changed prevalence of risk factors
For breast cancer, we adjusted the 1982 lifetime risk for changes in the prevalence of risk factors (primarily changes in reproductive factors) between 1982 and 2012. An adjustment factor was calculated from changes in the probability of diagnosis in women under 45 years of age, assuming that any changes in this age group would not be substantially affected by screening:

where P< 45, Y = probability of breast cancer diagnosis in women under 45 in year Y. We applied this adjustment factor to the lifetime probability of a breast cancer diagnosis (including in situ cancers) in 1982 to estimate the lifetime probability of breast cancer diagnosis in 1982, assuming 2012 risk factor levels. To account for in situ cancers likely to have been diagnosed but not recorded in registries in 1982 we multiplied the adjusted 1982 estimate by 1.02.18,19
For melanoma, we multiplied the 1982 lifetime risk by 1.126 for women and by 1.101 for men to account for in situ cancers likely to have been diagnosed but not recorded in registries.20 We then multiplied these estimates by an adjustment factor for changes in cumulative sun exposure between 1982 and 2012, using two methods:
- adjusted according to published annual proportional changes in age‐standardised rates of thick melanomas (thickness greater than 1 mm), reported as yearly increases of 2.7% for women and 4.3% for men for the 12 years 1982–9420 and 0.7% for women and 1.1% for men for the 17 years 1995–2012;21 and
- as a sensitivity analysis, adjusted according to changes in mortality from 1975–79 to 1985–89.22
The final adjustment factors for our primary method (thick melanomas) were:


We applied these adjustment factors to the lifetime probability of a melanoma diagnosis (including in situ cancers) in 1982 to estimate the lifetime probability of melanoma diagnosis in 1982, assuming 2012 risk factor levels.
Total excess lifetime risk of cancer (overdiagnosis)
To estimate the proportion of all cancer diagnoses in 2012 that might reasonably be deemed overdiagnosis, we first estimated the numbers of overdiagnosed breast, prostate, renal, thyroid cancers and melanoma (total number of specific cancer diagnoses multiplied by estimated overdiagnosis proportion for each cancer) and divided the sum of these estimates by the total number of cancer diagnoses of any type. We assumed that other cancer types were not overdiagnosed.
Other invasive cancers
In a further analysis, we estimated the change in risk of other invasive cancers (ie, invasive cancers other than prostate, breast, renal, thyroid cancers and melanoma) between 1982 and 2012 by subtracting the combined lifetime probability of the five specific invasive cancers from the overall lifetime probability of any invasive cancer, then applying the formula for deriving the proportion of cancers deemed to have been overdiagnosed.
Sensitivity analyses
For breast cancer, we repeated our calculations with different age criteria (< 40 years, < 50 years). For melanoma, we applied an alternative adjustment for changes in the incidence of risk factors (eg, ultraviolet radiation exposure), based on changes in melanoma mortality between 1975–79 and 1985–89, during which period a beneficial effect of informal screening was unlikely.
Potential effects of changes in body mass index
For breast,23 prostate,24 renal,25 and thyroid cancers,26 we estimated the expected impact of obesity by including estimates of changes in relative risk with increasing body mass index (BMI), based on Australian mean BMI data.27
Ethics approval
In this negligible risk research study, we analysed publicly available datasets of non‐identifiable aggregated data, and our investigation was therefore exempt from formal ethics review.
Results
Cancer diagnoses in women
The absolute lifetime risk of diagnosis increased between 1982 and 2012 by 3.4 percentage points for breast cancer (invasive breast cancer, 1.7 percentage points), 0.6 percentage point for renal cancer, 1.0 percentage point for thyroid cancer, and 5.1 percentage points for melanoma (invasive melanoma, 0.7 percentage point). We estimated that 22% of breast cancers (invasive breast cancer, 13%), 58% of renal cancers, 73% of thyroid cancers, and 54% of melanomas (invasive melanoma, 15%) were overdiagnosed, or 18% of all cancer diagnoses in women in 2012 (8% of all invasive cancer diagnoses) (Box 1).
The lifetime absolute risk of any invasive cancer for women increased by 8.6 percentage points (Box 2). Overdiagnosis of invasive breast, renal, thyroid cancer and melanoma explained 47% of this increase. The remaining 53% was explained by increases in other invasive cancers (most notably, the 3.8 percentage point increase in lifetime risk of lung cancer; Supporting Information, table 1).
Cancer diagnoses in men
The absolute lifetime risks of being diagnosed with cancer increased by 8.2 percentage points for prostate cancer, 0.8 percentage point for renal cancer, 0.4 percentage point for thyroid cancer, and 8.0 percentage points for melanoma (invasive melanoma, 1.5 percentage points). We estimated that 42% of prostate cancers, 42% of renal cancers, 73% of thyroid cancers, and 58% of melanomas (22% of invasive melanomas) were overdiagnosed, or 24% of all cancer diagnoses in men in 2012 (16% of all invasive cancer diagnoses) (Box 3).
The absolute lifetime risk of any invasive cancer increased by 10.9 percentage points (Box 2). Overdiagnosis of invasive prostate, renal, and thyroid cancers and of melanoma explained 97% of this increase.
Sensitivity analyses
Estimates of breast cancer overdiagnosis after adjusting for increased breast cancer incidence in women under 40, 45, or 50 years of age ranged between 16% and 28% when including ductal carcinomas in situ, and between 6% and 19% for invasive cancers (Supporting Information, table 2). Estimates for invasive melanoma overdiagnosis adjusted for earlier trends in mortality (instead of concurrent trends in thick lesions) were 5 percentage points higher for both men and women (Supporting Information, table 3).
Potential effects of changes in body‐mass index
The risk of post‐menopausal breast cancer has been reported to increase by 12% per 5 kg/m2 rise in BMI;23 from 1989 to 2012, the mean BMI for Australian women increased by 1.8 kg/m2.27 Consequently, the expected increase in postmenopausal breast cancers would be 1.12 × 1.8/5 or 1.04, a 4% relative increase; and the overdiagnosis rate would be smaller: about 19% (100 × [0.153 – 0.119 × 1.04]/0.153) rather than 22%.
For prostate cancer, the UK Biobank study24 found that relative risk for prostate cancer declined by 10% per 5 kg/m2 rise in BMI, although it noted that the finding might be explained by prostate‐specific antigen being assessed less frequently in obese men. Were this estimate used for the expected change in lifetime probability, overdiagnosis would be greater than the 42% we report.
For renal cancer, the relative risk has been reported to increase by 56% per standard deviation rise in BMI, but this finding may have been influenced by investigation rates.25 Based on changes in mean BMI in Australia from 1989 to 2012,27 this yields relative risks of 1.56 × 1.8/7.5 or 1.13 for women and 1.56 × 1.8/5.2 or 1.19 for men. Were these estimates used for the expected increase in lifetime probability, overdiagnosis rates would be modestly smaller than the 58% (women) and 42% (men) we report.
For thyroid cancer, six of nine studies26 found that thyroid cancer prevalence rose with increasing BMI, but the magnitude of the increase was generally less than that we calculated for renal cancer, so that the impact on estimated overdiagnosis rates would be negligible.
Discussion
We estimated that overdiagnosis accounted for about 18% of cancer diagnoses in women in Australia during 2012, and about 24% of diagnoses in men. That is, about 11 000 cancers in women and 18 000 in men may be overdiagnosed each year. Although proportional rates of overdiagnosis were highest for renal and thyroid cancers and for melanoma, absolute numbers of overdiagnosis were greatest for breast cancer and prostate cancer because of their higher baseline prevalence.
Studies in other countries have found similar rates of overdiagnosis of specific cancer types.10 However, ours is the first study to estimate overall cancer overdiagnosis on a national level. A recent British analysis did not estimate an overall figure, but found that the “incidence of 10 of the 20 most common cancers in the UK has increased by more than 50% in both sexes since the 1980s.”28 These cancers included breast, kidney, prostate, thyroid cancers and melanoma, but also non‐Hodgkin lymphoma, oral, cervical, liver, and uterine cancers. In Australia, the incidence of cervical and oral cancers has declined, while the incidence and mortality of liver cancer have increased,29 suggesting these cancers are not overdiagnosed. Although the incidence of non‐Hodgkin lymphoma and uterine cancer has each increased (and mortality has declined),29 this may be explained by factors other than overdiagnosis. We therefore estimated overdiagnosis only for cancers with the typical epidemiologic signature of overdiagnosis: breast, prostate, kidney, thyroid cancers and melanoma (for which lifetime mortality has changed little in absolute terms; Supporting Information, table 4).30 UK cancer statistics released in January 2019 show very high survival rates for people with early stage cancers of these types, providing further evidence of probable overdiagnosis: 5‐year survival of 99% for stage 1 breast cancer, 100% for stage 1 prostate cancer, 100% for stage 1 melanoma, 89% for stage 1 kidney cancer, and 88% for thyroid cancer of any stage.31
The reason for overdiagnosis differs by cancer type. Overdiagnosis of breast cancers is largely attributable to the national screening program, that of prostate cancers and melanoma to opportunistic but extensive screening in Australia. Renal cancer overdiagnosis appears to be largely linked with cancers detected as incidental findings during abdominal imaging for an unrelated reason (incidentalomas). Overdiagnosis of thyroid cancer is related to both incidentalomas and to excessive investigation of thyroid function test abnormalities. Different approaches to reducing rates of overdiagnosis are therefore required for different cancer types.
We recognise that eliminating overdiagnosis altogether is unlikely, but reduction is feasible. For example, the number of thyroid cancer diagnoses in South Korea was reduced by one‐third by discouraging ultrasound screening;32 several countries have reduced prostate cancer incidence and overdiagnosis with more targeted and less frequent prostate screening.33 However, the potential benefits of changes to early detection practices for breast and prostate cancer, for example, need to be balanced against harms, and clinical and community input should be encouraged. A complementary solution would be tests that identify only clinically important cancers, or at least correctly identify low risk cancers as being such.
Limitations
Despite the robustness of our data — mandatory, national registration of all cancers in Australia since 1982 provided us with a nationally representative longitudinal dataset — our analysis was subject to limitations. First, we assumed no overdiagnosis in 1982, a reasonable assumption given the lower levels of screening. However, the incidence of prostate cancer increased slightly in New South Wales during 1972–1982 without a change in mortality,34 suggesting some overdiagnosis. Second, we assumed no overdiagnosis of cancers other than the five we specified. The lifetime probability for men of all other invasive cancers increased slightly, and declines for specific cancers (such as lung cancer) may have offset increases in others, some of which may be overdiagnosed. For women, there was a modest increase for other invasive cancers, largely explained by the increased diagnosis of lung cancer (unlikely to be overdiagnosis), but other cancers may have been overdiagnosed. To estimate the total excess risk for all cancers we summed the risks for the individual and other cancers, and for people with more than one type of cancer each was counted separately.
We adjusted for some risk factor changes known to have increased the risk of the included cancers during the period of our study, and we acknowledge the uncertainty inherent in this process. Our adjusted estimate of breast cancer overdiagnosis (22%), however, is consistent with the findings of an independent panel assessment analysing data from randomised trials,7 and lies in the middle of the range of estimates provided by observational studies.10 Melanoma overdiagnosis has not been estimated in randomised trials or observational studies,35 but analysis of population data suggests it is probably substantial4,36 and that in situ melanomas account for most overdiagnosed melanomas, consistent with our findings.
Conclusion
Despite the uncertainties in our estimates, the estimated rates of cancer overdiagnosis have important implications for health policy. First, rates of avoidable overdiagnosis need to be reduced to the lowest level compatible with targeted screening and appropriate investigation. We also need to examine strategies for reducing overtreatment of low risk prostate, breast and thyroid cancers. Our analysis provides a method for deriving baseline estimates of the total burden of cancer overdiagnosis in Australia against which the effectiveness of such interventions could be measured. A second, and perhaps more important implication is that health services need to be alert to new areas of overdiagnosis and to detect them early. This could be an important role for the Australian Institute of Health and Welfare and state cancer registries; increased test, incidence, or treatment rates, without corresponding rises in mortality, could indicate emerging areas of overdiagnosis.37
Box 1 – Estimated number of cancer overdiagnoses in women, Australia, 2012
|
Cancer |
Lifetime probability of diagnosis |
Change in probability, 1982–2012 |
Overdiagnosis proportion† |
Cancer diagnoses, 2012 |
Estimated overdiagnoses, 2012 (95% CI) |
||||||||||
|
1982* |
2012 |
||||||||||||||
|
|
|||||||||||||||
|
Breast |
|
|
|
|
|
|
|||||||||
|
Including ductal carcinomas in situ |
0.119 |
0.153 |
0.034 |
22% |
17 825 |
3957 (3601–4313) |
|||||||||
|
Invasive only |
0.117 |
0.134 |
0.017 |
13% |
15 348 |
1949 (1610–2288) |
|||||||||
|
Melanoma |
|
|
|
|
|
|
|||||||||
|
Including in situ carcinomas |
0.044 |
0.095 |
0.051 |
54% |
10 492 |
5634 (5386–5882) |
|||||||||
|
Invasive only |
0.039 |
0.046 |
0.007 |
15% |
5088 |
774 (580–968) |
|||||||||
|
Thyroid |
0.0038 |
0.0140 |
0.0102 |
73% |
1168 |
851 (774–928) |
|||||||||
|
Renal |
0.0046 |
0.0110 |
0.0064 |
58% |
1143 |
665 (584–746) |
|||||||||
|
Other invasive cancers |
0.290 |
0.335 |
0.045 |
— |
32 401 |
— |
|||||||||
|
All cancers |
|
|
|
|
|
|
|||||||||
|
Including in situ carcinomas (breast cancer, melanoma)‡ |
|
|
|
|
63 029 |
11 107 (18%) |
|||||||||
|
Invasive only |
|
|
|
|
55 148 |
4239 (8%) |
|||||||||
|
|
|||||||||||||||
|
CI = confidence interval. * After applying 2012 mortality age distribution and adjustment for changes in risk factor levels for breast cancer and melanoma. † Change in probability (1982–2012)/probability (2012). ‡ Assuming no overdiagnosis for other cancers. |
|||||||||||||||
Box 2 – Changes in lifetime risks of cancer, adjusted for changes in competing mortality
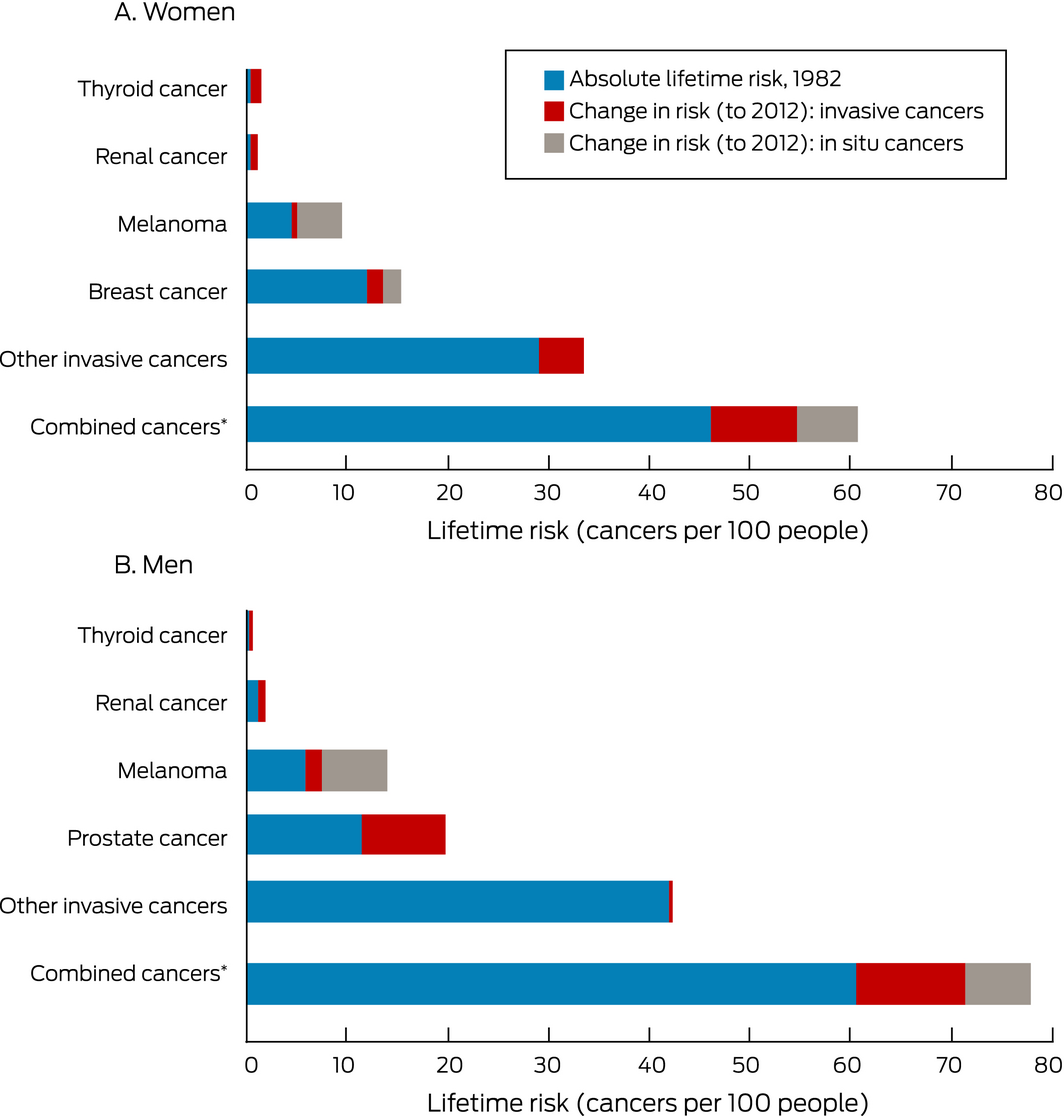
For “Combined cancers”, the numbers for the individual cancers are summed; that is, people with more than one type of cancer are counted more than once.
Box 3 – Estimated number of cancer overdiagnoses in men, Australia, 2012
|
Cancer |
Lifetime probability of diagnosis |
Change in probability, 1982–2012 |
Overdiagnosis proportion† |
Cancer diagnoses, 2012 |
Estimated overdiagnoses, |
||||||||||
|
1982* |
2012 |
||||||||||||||
|
|
|||||||||||||||
|
Prostate |
0.115 |
0.197 |
0.082 |
42% |
20 759 |
8636 (8281–8991) |
|||||||||
|
Melanoma |
|
|
|
|
|
|
|||||||||
|
Including in situ carcinomas |
0.059 |
0.139 |
0.080 |
58% |
14 436 |
8315 (8034–8596) |
|||||||||
|
Invasive only |
0.054 |
0.069 |
0.015 |
22% |
7151 |
1552 (1331–1773) |
|||||||||
|
Thyroid |
0.0014 |
0.0052 |
0.0038 |
33% |
661 |
483 (426–540) |
|||||||||
|
Renal |
0.011 |
0.019 |
0.008 |
42% |
2045 |
861 (749–973) |
|||||||||
|
Other invasive cancers |
0.420 |
0.423 |
0.003 |
— |
39 452 |
— |
|||||||||
|
All cancers |
|
|
|
|
|
|
|||||||||
|
Including in situ carcinomas (melanoma)‡ |
|
|
|
|
77 353 |
18 295 (24%) |
|||||||||
|
Invasive only |
|
|
|
|
70 068 |
11 531 (16%) |
|||||||||
|
|
|||||||||||||||
|
* After applying 2012 mortality age distribution and adjustment for changes in risk factor levels for melanoma. † Change in probability (1982–2012)/probability (2012). ‡ Assuming no overdiagnosis for other cancers. |
|||||||||||||||
Received 15 April 2019, accepted 27 September 2019
- Paul P Glasziou1
- Mark A Jones1
- Thanya Pathirana2
- Alexandra L Barratt3
- Katy JL Bell3
- 1 Institute for Evidence‐Based Healthcare, Bond University, Gold Coast, QLD
- 2 Griffith University, Sunshine Coast, QLD
- 3 Sydney School of Public Health, University of Sydney, Sydney, NSW
We received funding from the Australian National Health and Medical Research Council (NHMRC Fellowship 1080042; Centres of Research Excellence grant 1104136 [Creating sustainable health care: ensuring new diagnostics avoid harms, improve outcomes and direct resources wisely], and Program grant 1113532 [Using healthcare wisely: reducing inappropriate use of tests and treatments]).
No relevant disclosures.
- 1. Bray F, Ferlay J, Soerjomataram I, et al. Global cancer statistics 2018: GLOBOCAN estimates of incidence and mortality worldwide for 36 cancers in 185 countries. CA Cancer J Clin 2018; 68: 394–424.
- 2. Australian Institute of Health and Welfare. Australia's health 2018 (Cat No. AUS 221; Australia's health series no. 16). Canberra: AIHW, 2018.
- 3. Brodersen J, Schwartz LM, Heneghan C, et al. Overdiagnosis: what it is and what it isn't. BMJ Evid Based Med 2018; 23: 1–3.
- 4. Welch HG, Black WC. Overdiagnosis in cancer. J Natl Cancer Inst 2010; 102: 605–613.
- 5. Esserman LJ, Thompson IM, Reid B, et al. Addressing overdiagnosis and overtreatment in cancer: a prescription for change. Lancet Oncology 2014; 15: E234–E242.
- 6. Draisma G, Boer R, Otto SJ, et al. Lead times and overdetection due to prostate‐specific antigen screening: estimates from the European randomized study of screening for prostate cancer. J Natl Cancer Inst 2003; 95: 868–878.
- 7. Marmot MG, Altman DG, Cameron DA, et al. The benefits and harms of breast cancer screening: an independent review. Br J Cancer 2013; 108: 2205–2240.
- 8. Vaccarella S, Franceschi S, Bray F, et al. Worldwide thyroid‐cancer epidemic? The increasing impact of overdiagnosis. N Engl J Med 2016; 375: 614–617.
- 9. Davies L, Ouellette M, Hunter M, et al. The increasing incidence of small thyroid cancers: where are the cases coming from? Laryngoscope 2010; 120: 2446–2451.
- 10. Carter JL, Coletti RJ, Harris RP. Quantifying and monitoring overdiagnosis in cancer screening: a systematic review of methods. BMJ 2015; 350: g7773.
- 11. Carter SM, Doust J, Degeling C, et al. A definition and ethical evaluation of overdiagnosis: response to commentaries. J Med Ethics 2016; 42: 722–724.
- 12. Fang F, Keating NL, Mucci LA, et al. Immediate risk of suicide and cardiovascular death after a prostate cancer diagnosis: cohort study in the United States. J Natl Cancer Inst 2010; 102: 307–314.
- 13. Smith DP, Calopedos R, Bang A, et al. Increased risk of suicide in New South Wales men with prostate cancer: analysis of linked population‐wide data. PLoS One 2018; 13: e0198679.
- 14. Moynihan R, Barratt AL, Buchbinder R, et al. Australia is responding to the complex challenge of overdiagnosis. Med J Aust 2018; 209: 332–334. https://www.mja.com.au/journal/2018/209/8/australia-responding-complex-challenge-overdiagnosis.
- 15. Pathirana TI, Hayden A, Doust J, et al. The lifetime risk of prostate cancer overdiagnosis in Australia. BMJ Open 2019; 9: e022457.
- 16. Australian Institute of Health and Welfare. Cancer data in Australia (CAN 122): ACIM books and ACD pivot table. Updated Jan 2019. https://www.aihw.gov.au/reports/cancer/cancer-data-in-australia/acim-books; (viewed Feb 2019).
- 17. Fay MP, Pfeiffer R, Cronin KA, et al. Age‐conditional probabilities of developing cancer. Stat Med 2003; 22: 1837–1848.
- 18. Virnig BA, Tuttle TM, Shamliyan T, et al. Ductal carcinoma in situ of the breast: a systematic review of incidence, treatment, and outcomes. J Natl Cancer Inst 2010; 102: 170–178.
- 19. Jacklyn G, Morrell S, McGeechan K, et al. Carcinoma in situ of the breast in New South Wales, Australia: current status and trends over the last 40 year. Breast 2018; 37: 170–178.
- 20. Coory M, Baade P, Aitken J, et al. Trends for in situ and invasive melanoma in Queensland, Australia, 1982–2002. Cancer Causes Control 2006; 17: 21–27.
- 21. Aitken JF, Youlden DR, Baade PD, et al. Generational shift in melanoma incidence and mortality in Queensland, Australia, 1995–2014. Int J Cancer 2018; 142: 1528–1535.
- 22. Giles GG, Armstrong BK, Burton RC, et al. Has mortality from melanoma stopped rising in Australia? Analysis of trends between 1931 and 1994. BMJ 1996; 312: 1121–1125.
- 23. Renehan AG, Tyson M, Egger M, et al. Body‐mass index and incidence of cancer: a systematic review and meta‐analysis of prospective observational studies. Lancet 2008; 371: 569–578.
- 24. Perez‐Cornago A, Key TJ, Allen NE, et al. Prospective investigation of risk factors for prostate cancer in the UK Biobank cohort study. Br J Cancer 2017; 117: 1562–1571.
- 25. Johansson M, Carreras‐Torres R, Scelo G, et al. The influence of obesity‐related factors in the etiology of renal cell carcinoma: a mendelian randomization study. PLoS Med 2019; 16: e1002724.
- 26. Harikrishna A, Ishak A, Ellinides A, et al. The impact of obesity and insulin resistance on thyroid cancer: a systematic review. Maturitas 2019; 125: 45–49.
- 27. Gearon E, Tanamas SK, Stevenson C, et al. Changes in waist circumference independent of weight: implications for population level monitoring of obesity. Prev Med 2018; 111: 378–383.
- 28. Oke JL, O'Sullivan JW, Perera R, Nicholson BD. The mapping of cancer incidence and mortality trends in the UK from 1980–2013 reveals a potential for overdiagnosis. Sci Rep 2018; 8: 14663.
- 29. Australian Institute of Health and Welfare. Cancer in Australia 2019 (Cat. no. CAN 123; Cancer series no. 119). Canberra: AIHW, 2019.
- 30. Welch HG, Kramer BS, Black WC. Epidemiologic signatures in cancer. N Engl J Med 2019; 381: 1378–1386.
- 31. Office for National Statistics (United Kingdom). Cancer survival in England: national estimates for patients followed up to 2017. Jan 2019. https://www.ons.gov.uk/releases/cancersurvivalinenglandadultstageatdiagnosisandchildhoodpatientsfollowedupto2017; (viewed Oct 2019).
- 32. Culp MB, Soerjomataram I, Efstathiou JA, et al. Recent global patterns in prostate cancer incidence and mortality rates. Eur Urol 2020; 77: 38–52.
- 33. Ahn HS, Welch HG. South Korea's thyroid‐cancer “epidemic”: turning the tide. N Engl J Med 2015; 373: 2389–2390.
- 34. Smith DP, Supramaniam R, Marshall VR, et al. Prostate cancer and prostate‐specific antigen testing in New South Wales. Med J Aust 2008; 189: 315–318. https://www.mja.com.au/journal/2008/189/6/prostate-cancer-and-prostate-specific-antigen-testing-new-south-wales;
- 35. Wernli KJ, Henrikson NB, Morrison CC, et al. Screening for skin cancer in adults: updated evidence report and systematic review for the US Preventive Services Task Force. JAMA 2016; 316: 436–447.
- 36. Welch HG, Woloshin S, Schwartz LM. Skin biopsy rates and incidence of melanoma: population based ecological study. BMJ 2005; 331: 481.
- 37. Bell KJL, Doust J, Glasziou P, et al. Recognizing the potential for overdiagnosis: are high‐sensitivity cardiac troponin assays an example? Ann Intern Med 2019; 170: 259–261.
Abstract
Objectives: To estimate the proportion of cancer diagnoses in Australia that might reasonably be attributed to overdiagnosis by comparing current and past lifetime risks of cancer.
Design, setting, and participants: Routinely collected Australian Institute of Health and Welfare national data were analysed to estimate recent (2012) and historical (1982) lifetime risks (adjusted for competing risk of death and changes in risk factors) of diagnoses with five cancers: prostate, breast, renal, thyroid cancers, and melanoma.
Main outcome measure: Difference in lifetime risks of cancer diagnosis between 1982 and 2012, interpreted as probable overdiagnosis.
Results: For women, absolute lifetime risk increased by 3.4 percentage points for breast cancer (invasive cancers, 1.7 percentage points), 0.6 percentage point for renal cancer, 1.0 percentage point for thyroid cancer, and 5.1 percentage points for melanoma (invasive melanoma, 0.7 percentage point). An estimated 22% of breast cancers (invasive cancers, 13%), 58% of renal cancers, 73% of thyroid cancers, and 54% of melanomas (invasive melanoma, 15%) were overdiagnosed, or 18% of all cancer diagnoses (8% of invasive cancer diagnoses). For men, absolute lifetime risk increased by 8.2 percentage points for prostate cancer, 0.8 percentage point for renal cancer, 0.4 percentage point for thyroid cancer, and 8.0 percentage points for melanoma (invasive melanoma, 1.5 percentage points). An estimated 42% of prostate cancers, 42% of renal cancers, 73% of thyroid cancers, and 58% of melanomas (invasive melanomas, 22%) were overdiagnosed, or 24% of all cancer diagnoses (16% of invasive cancer diagnoses). Alternative assumptions slightly modified the estimates for overdiagnosis of breast cancer and melanoma.
Conclusions: About 11 000 cancers in women and 18 000 in men may be overdiagnosed each year. Rates of overdiagnosis need to be reduced and health services should monitor emerging areas of overdiagnosis.