


Australia's national health insurance scheme, Medicare (introduced in 1975 as Medibank), was envisioned to deliver the “most equitable and efficient means of providing health insurance coverage for all Australians”.1 Questions have been raised as to whether, 40 years after its introduction, Medicare is equitable, particularly in terms of access to mental health services.2,3 Investigations over more than 70 years in various parts of the world, including Australia, have consistently found greater levels of psychiatric disorder in areas with greater socioeconomic disadvantage.4-6
In November 2006, the Australian Government introduced the Better Access to Mental Health Care initiative (Better Access), consisting of new Medicare Benefits Schedule (MBS) items to improve access to psychiatrists, psychologists and general practitioners.7 Evaluation of the program, supported by Commonwealth government funding, highlighted the success of Better Access in increasing psychological service use. For example, the number of allied mental health services accessed almost doubled in the first year, and most users were new (68% in 2008 and 57% in 2009).8,9 The report by Harris and colleagues also commented: “Uptake rates for Psychological Therapy Services items … decreased as levels of socio-economic disadvantage increased”.8 Findings from Bettering the Evaluation and Care of Health data also suggested possible inequity, with less service provision going to more disadvantaged areas.3
Another concern is whether Better Access is reaching rural and remote communities as well as the metropolitan areas.3,10,11 Here, a primary driver may be provider availability, as the problem of securing specialist health care and other service delivery to non-metropolitan areas of Australia is well recognised.11
We obtained Medicare data on the Better Access program and related mental health care items, following a freedom of information request by one of the authors (R G) on behalf of Transforming Australia's Mental Health Service Systems.
We aimed to determine whether adult use of mental health services subsidised by Medicare varies by measures of socioeconomic and geographic disadvantage. We hypothesised that services would be particularly inequitable where delivered by mental health professionals with higher gap payments. We conjectured that services provided by GPs, general psychologists and allied health practitioners would be relatively equitable, while services generally provided by psychiatrists and clinical psychologists would be less equitably delivered. We focused separately on item 291 (GP mental health care plan preparation by a psychiatrist), hypothesising that this item might differ in pattern from other psychiatry items.
Methods
We performed a secondary analysis of national Medicare data from 1 July 2007 to 30 June 2011. Data included all mental health services subsidised by Better Access and Medicare. Providers included GPs, psychiatrists, clinical psychologists and allied mental health practitioners.
Main outcome measures were service use rates and equity measures of concentration indexes and curves.
Data and linkage to area characteristics
Data included MBS items with associated postcode data but without other identifying information. The total number of services across all 4 years was 25 146 558. Unique records of data (consisting of unique sets of item number, consumer postcode and financial year) were suppressed to ensure confidentiality if the total of services in an area was less than 20. Based on the number of suppressed records, we estimated that a maximum of 3 084 023 service contacts could have been censored. However, the actual number of suppressed service contacts was likely to be about half this figure, and is unlikely to have caused any significant bias in analyses.
We grouped MBS items into the following categories (specific item numbers are available in Appendix 1 and Box 1):
- GP mental health services created or significantly altered by Better Access;
- consultant psychiatry items created or significantly altered by Better Access;
- psychiatrist services in rooms. (CP+);
- creation of a shared care plan by a psychiatrist (item 291);
- psychological therapy services provided by a clinical psychologist; and
- focused psychological strategies — allied mental health items:
- general psychologist services;
- occupational therapist services; and
- social worker services.
Consumer residential postcodes were linked to area characteristics available from public census information from the Australian Bureau of Statistics. These characteristics were remoteness area category12 and Socio-Economic Indexes for Areas (SEIFA).13 If a postcode had been assigned to more than one remoteness category, then it was allocated to the remoteness category having the greatest proportion of the population in that postcode. The SEIFA measures were the Index of Relative Socio-Economic Advantage and Disadvantage, Index of Relative Socio-Economic Disadvantage, Index of Education and Occupation, and the Index of Economic Resources.
Local implications
Variations within closely located yet differing socioeconomic status regions were examined by looking at four local government areas in major capital cities. We chose two regions ranked in the top decile for socioeconomic advantage (City of Bayside in Melbourne and North Sydney Council in Sydney) and two regions from disadvantaged areas (City of Greater Dandenong in Melbourne and City of Blacktown in Sydney).14 Postcode areas bounded entirely within each catchment were used in the service rate calculations.
Statistical analysis
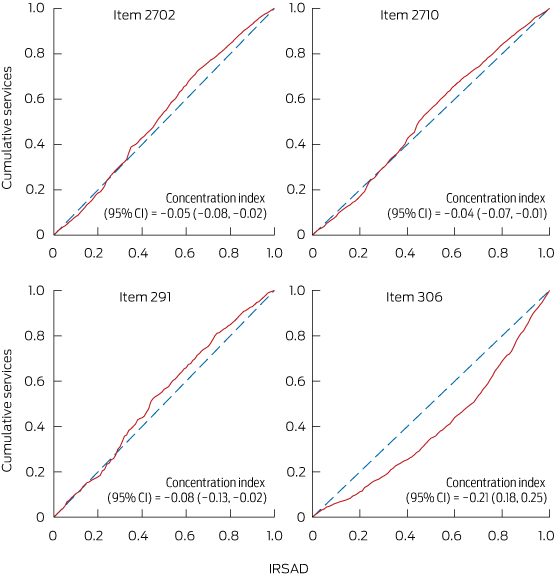
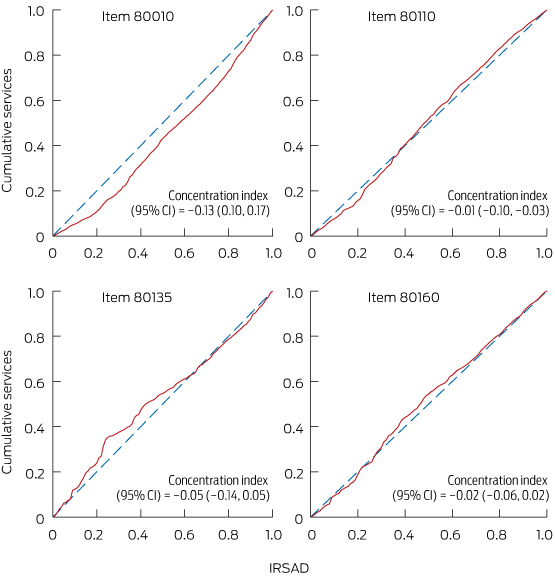
To measure inequity, we plotted concentration curves and determined concentration indexes.15 Concentration indexes lie between − 1 and + 1. Negative indexes and curves above the 45° equity line represented greater usage in lower socioeconomic regions. Positive concentration indexes corresponded to curves below the equity line, and represented greater usage in higher socioeconomic regions.
We followed a convention of using an index threshold of 0.2 (or − 0.2) as indicating a high level of inequality;16,17 an index of 0.2 would result from the richest half of the population accessing 50% more services than the poorest half. For further details on our statistical methods, see Appendix 2.15,16,18
The equity line, derived from raw population rates, may underestimate need in deprived areas if greater needs are associated with lower socioeconomic status. However, in the absence of accurate and contemporary information on such associations, we did not adjust for this influence. Hence, where the curve was below the line and the index was positive, provision was judged inequitable. Where the curve was above the line and the index was negative, the finding was more suggestive but not conclusive of equitable delivery.
SEIFA
Of the four SEIFA variables, the Index of Relative Socio-Economic Advantage and Disadvantage was preferred for these analyses based on performance in calculating concentration indexes most consistently representative in direction and magnitude of values from the other indexes.
Ethics approval
Monash University Human Research Ethics Committee reviewed the study protocol and granted an exemption from ethics review because the non-identifiable data satisfied the requirements of the National Statement on Ethical Conduct in Human Research.
Results
Data were associated with 98.6% of Australian postcodes. Activity rates by year and postcode characteristics are shown in Box 2 (for absolute numbers, see Appendix 3). Most rates almost doubled across the 4 years, whereas consultant psychiatrist items predating Better Access (CP+) did not increase. Increasing remoteness was consistently associated with lower activity rates. Strong trends indicated higher use rates in less socioeconomically disadvantaged areas for most consultant psychiatry items and for clinical psychologist services; trends for other items were typically less marked.
Concentration curves are presented in Box 3 and Box 4; note that the scale (and hence the derived index) represents the population, not postcodes as in Box 2 and Appendix 3, so the pattern of results differs slightly. For key medical items shown in Box 3, the trend could be compatible with equity for items provided by GPs and for item 291. For item 306 (consultant psychiatry, 45–75 minutes), the poorest 20% of the population used about 10% of these services, while the richest 20% used over 30% (ie, more than three times the use rate). Concentration curves for key psychology and allied health items are presented in Box 4, which shows inequity for item 80010 (clinical psychology). The poorest 20% of the population by area characteristics used about 10% of these services, while the richest 20% used over 25% (ie, more than 2.5 times the use rate).
Concentration indexes for individual items are presented in Box 1. Significant negative index values were found for GP and allied health items. For reasons given earlier, related to population need, our findings suggested but do not confirm equity; area-based rates (Box 2) suggested some inequity for GP and allied health items, although less than for longer and widely used items from psychiatrists and clinical psychologists. Also of note, there were a number of index values for consultant psychiatry items with magnitude above 0.2, showing high inequity in favour of more advantaged areas. Negative indexes below − 0.2 were most common for focused psychological strategy items serviced by general psychologists, occupational therapists and social workers. Compared with psychiatrist and clinical psychologist services, these allied health services demonstrated better provision in disadvantaged areas.
Our examination of specific areas illustrates the differences that might be found in local planning exercises. We drew on examples from within the two largest Australian capital cities (Appendix 4). In Melbourne, the Dandenong area has high socioeconomic disadvantage, while the Bayside area is at the opposite extreme. However, it was the Bayside area that had much higher service use rates, with the exception of item 291, even though illness rates are likely to be much higher in Dandenong. In Sydney, there was a similar pattern of higher service activity in the North Sydney Council area compared with the more disadvantaged Blacktown area, although higher activity in Blacktown for GP items was an important exception.
Discussion
Our findings confirm previous findings19 of inequity in services provided by psychiatrists. Better Access activity rates are typically greater in more advantaged areas. There is variability between provider disciplines and items; within Better Access, this association is most strongly observed with high-volume clinical psychology services. Activity rates for Better Access and related mental health care MBS items decline with increasing remoteness across all types, reinforcing findings from previous work.8,9,20
Examination of the latest national survey did not suggest that areas of higher socioeconomic status were characterised by high use rates of Better Access items among people without disorders,7 but this may not be how inequity manifests. Rather, among people with comparable levels of diagnosable mental health problems, it may be easier for the socioeconomically advantaged to pass through the filters to specialist care.21 In other words, the criteria for stepping up a level of care may be different, and the disadvantaged may need higher levels of distress or disturbance to secure entry to care.
These results are consistent with a multitier system, where people living in more disadvantaged and more rural areas will typically receive a service model in response to mental health needs that is characterised by lower volumes of services, provided possibly by less highly trained providers. Item 291 is something of an exception among Better Access items but at a very low absolute rate.
Medicare provision through Better Access does not then conform to the kind of equitable delivery that would merit characterisation as universality. While we are not offering specific solutions to such a complex issue, we note that our key hypotheses were formulated with consideration of the likely influence of copayments as a disincentive and structural deterrence to accessing care. These findings would be compatible with a situation in which higher-paid professionals practise in areas closer to home, and where this spatial distribution aligns with direct considerations of affordability, it reduces access by people from more disadvantaged areas.
Our study has some limitations. The Medicare data do not take into account the Access to Allied Psychological Services initiative or the public mental health services provided by states and territories. Including these would require further data sources and analyses.22 Regarding funding models to public mental health services in Australia's most populated states, Victorian public mental health services adopted transparent resource distribution processes in the late 1990s,23 including a correction to state funding based on level of private activity. In New South Wales, a special commission of enquiry recommended introducing a resource distribution formula to take into account socioeconomic factors and substitutable private services; however, this has not yet happened.24
Our data span financial years 2007–08 to 2010–11; changes to the scheme from late 201125 may have led to some changes in usage.
Without controlling for area-based need disparities,5,22 it seems most likely that our analyses may have underestimated rather than overestimated inequity.
Our findings, confirming previously demonstrated inequity in private psychiatric service activity, show that the Better Access initiative is not providing universality or consistent equity of delivery in mental health care. We hope that the findings may contribute to debate and discussion around policy incentives and strategies that work towards universal and equitable delivery of mental health care for all Australians.
1 Concentration index calculated using Index of Relative Socio-Economic Advantage and Disadvantage ranking for areas and national Medicare data, 1 July 2007 to 30 June 2011
Provider group | Consultation time (min) | Item no. | No. of patients | Concentration index* (95% CI) | |||||||||||
General practitioner | Not timed | 2702 | 317 117 | − 0.05 (− 0.08, − 0.02) | |||||||||||
Not timed | 2710 | 2 181 945 | − 0.04 (− 0.07, − 0.01) | ||||||||||||
Not timed | 2712 | 930 248 | − 0.03 (− 0.06, − 0.001) | ||||||||||||
> 20 | 2713 | 3 019 386 | − 0.08 (− 0.11, − 0.05) | ||||||||||||
Consultant psychiatry | > 45 | 291 | 22 258 | − 0.08 (− 0.13, − 0.02) | |||||||||||
30–45 | 293 | 963 | − 0.18 (− 0.34, − 0.02) | ||||||||||||
> 45 | 296 | 303 240 | 0.03 (− 0.01, 0.06) | ||||||||||||
> 45 | 297 | 14 499 | 0 (− 0.07, 0.07) | ||||||||||||
> 45 | 299 | 285 | 0.34 (0.01, 0.7) | ||||||||||||
< 15 | 300 | 126 179 | − 0.13 (− 0.23, − 0.03) | ||||||||||||
15–30 | 302 | 944 908 | − 0.07 (− 0.14, − 0.002) | ||||||||||||
30–45 | 304 | 1 871 116 | 0.04 (0.002, 0.08) | ||||||||||||
45–75 | 306 | 2 572 228 | 0.21 (0.18, 0.25) | ||||||||||||
> 75 | 308 | 111 875 | 0.05 (− 0.01, 0.10) | ||||||||||||
< 15 | 310 | 0 | na | ||||||||||||
15–30 | 312 | 210 | − 0.20 (− 0.29, − 0.12) | ||||||||||||
30–45 | 314 | 1430 | 0.10† (− 0.07, 0.26) | ||||||||||||
45–75 | 316 | 62 523 | 0.22 (0.15, 0.28) | ||||||||||||
> 75 | 318 | 906 | 0.08 (− 0.04, 0.20) | ||||||||||||
> 45 | 319 | 264 437 | 0.22 (0.15, 0.28) | ||||||||||||
Psychological therapy services | |||||||||||||||
Clinical psychologist | 30–50 | 80000 | 39 262 | − 0.07 (− 0.15, 0.01) | |||||||||||
30–50 | 80005 | 1535 | − 0.07† (− 0.31, 0.18) | ||||||||||||
> 50 | 80010 | 3 754 815 | 0.13 (0.10, 0.17) | ||||||||||||
> 50 | 80015 | 24 882 | − 0.08 (− 0.15, 0) | ||||||||||||
> 60 | 80020 | 14 436 | − 0.07† (− 0.27, 0.13) | ||||||||||||
Focused psychological strategies | |||||||||||||||
General psychologist | 20–50 | 80100 | 108 723 | − 0.26 (− 0.33, − 0.18) | |||||||||||
20–50 | 80105 | 9027 | − 0.26 (− 0.42, − 0.10) | ||||||||||||
> 50 | 80110 | 6 325 499 | − 0.01 (− 0.04, 0.03) | ||||||||||||
> 50 | 80115 | 194 844 | − 0.14 (− 0.20, − 0.08) | ||||||||||||
> 60 | 80120 | 25 819 | − 0.02 (− 0.08, 0.04) | ||||||||||||
Occupational therapist | 20–50 | 80125 | 4236 | − 0.20 (− 0.33, − 0.08) | |||||||||||
20–50 | 80130 | 849 | − 0.08 (− 0.22, 0.06) | ||||||||||||
> 50 | 80135 | 72 607 | − 0.05 (− 0.14, 0.05) | ||||||||||||
> 50 | 80140 | 7326 | − 0.06 (− 0.16, 0.04) | ||||||||||||
> 60 | 80145 | 422 | − 0.11 (− 0.24, 0.03) | ||||||||||||
Social worker | 20–50 | 80150 | 3850 | − 0.04† (− 0.19, 0.12) | |||||||||||
20–50 | 80155 | 2228 | − 0.14 (− 0.43, 0.15) | ||||||||||||
> 50 | 80160 | 472 353 | − 0.02 (− 0.06, 0.02) | ||||||||||||
> 50 | 80165 | 25 211 | − 0.15 (− 0.23, − 0.07) | ||||||||||||
> 60 | 80170 | 331 | − 0.25 (− 0.44, − 0.07) | ||||||||||||
* A positive concentration index indicates inequality of service use in favour of advantaged regions. † Concentration curve with significant areas on either side of equity line. | |||||||||||||||
2 Medicare-subsidised mental health and related services: use rates per 1000 population per year, 1 July 2007 to 30 June 2011
FPS | |||||||||||||||
Variable | Population | GP | CP | CP-291 | CP+ | PTS | Total | FPS-GenP | FPS-OT | FPS-SW | |||||
No. of MBS items | 6 448 696 | 341 245 | 22 258 | 6 297 057 | 3 834 930 | 7 253 325 | 6 663 912 | 85 440 | 503 973 | ||||||
Use rate | |||||||||||||||
Financial year | |||||||||||||||
2007–08 | 21 249 199 | 55 | 4 | 0.1 | 74 | 30 | 60 | 56 | 0.5 | 3 | |||||
2008–09 | 21 691 653 | 71 | 4 | 0.2 | 72 | 41 | 77 | 72 | 0.8 | 5 | |||||
2009–10 | 22 031 750 | 79 | 4 | 0.3 | 71 | 48 | 92 | 84 | 1.2 | 7 | |||||
2010–11 | 22 340 024 | 90 | 4 | 0.4 | 71 | 56 | 102 | 93 | 1.4 | 8 | |||||
Region* | |||||||||||||||
Major cities | 15 104 517 | 79 | 5 | 0.3 | 92 | 52 | 92 | 85 | 1.2 | 6 | |||||
Inner regional | 3 991 501 | 76 | 3 | 0.3 | 37 | 32 | 81 | 74 | 0.6 | 6 | |||||
Outer regional | 1 897 121 | 50 | 1 | 0.2 | 13 | 14 | 46 | 42 | 0.7 | 4 | |||||
Remote | 267 159 | 25 | 0 | 0.0 | 4 | 5 | 11 | 10 | 0.0 | 1 | |||||
Very remote | 177 561 | 8 | 0 | 0.0 | 2 | 2 | 5 | 5 | 0.0 | 0 | |||||
Socioeconomic disadvantage*† | |||||||||||||||
Quintile 5 | 5 900 995 | 74 | 6 | 0.1 | 117 | 68 | 95 | 86 | 1.5 | 7 | |||||
Quintile 4 | 4 480 536 | 74 | 4 | 0.3 | 74 | 44 | 88 | 82 | 0.7 | 5 | |||||
Quintile 3 | 4 298 715 | 78 | 3 | 0.3 | 55 | 40 | 83 | 77 | 0.9 | 6 | |||||
Quintile 2 | 3 508 187 | 77 | 3 | 0.4 | 44 | 29 | 76 | 70 | 0.9 | 5 | |||||
Quintile 1 | 3 249 398 | 69 | 3 | 0.3 | 45 | 23 | 69 | 63 | 0.7 | 5 | |||||
MBS = Medicare Benefits Schedule. GP = general practitioner mental health services created or significantly altered by Better Access to Mental Health Care services. CP = consultant psychiatry items created or significantly altered by Better Access. CP-291 = initial assessment for a GP shared care plan by a psychiatrist (MBS item no. 291). CP+ = all/most psychiatry items. PTS = psychological therapy provided by a clinical psychologist. FPS = focused psychological strategies: allied health items; GenP = general psychological services; OT = occupational therapy services; SW = social worker services. * Mean, 2007–2011. † Ranked by Index of Relative Socio-Economic Advantage and Disadvantage; quintile 1 = most disadvantaged. | |||||||||||||||
Received 10 March 2014, accepted 16 September 2014
- Graham N Meadows1,2
- Joanne C Enticott1
- Brett Inder1
- Grant M Russell1,3
- Roger Gurr4
- 1 Monash University, Melbourne, VIC.
- 2 University of Melbourne, Melbourne, VIC.
- 3 Southern Academic Primary Care Research Unit, Melbourne, VIC.
- 4 University of Western Sydney, Sydney, NSW.
The Public Interest Advocacy Centre, a Sydney-based group actively concerned with social and political issues such as equity of service delivery and transparency of government, assisted with our freedom of information request for non-identifiable national Medicare data. Martin Knapp at the London School of Economics and Political Science introduced some of us to the use of the concentration index for such analyses.
No relevant disclosures.
- 1. Parliament of Australia. Medicare - background brief. Canberra: Commonwealth of Australia, 2003. http://www.aph.gov.au/About_Parliament/Parliamentary_Departments/Parliamentary_Library/Publications_Archive/archive/medicare (accessed Feb 2014).
- 2. Rosenberg SP, Hickie IB. Better outcomes or better access - which was better for mental health care [letter]? Med J Aust 2012; 197: 619-620; author reply 620. <MJA full text>
- 3. Harrison CM, Britt HC, Charles J. Better Outcomes or Better Access - which was better for mental health care? Med J Aust 2012; 197: 170-172. <MJA full text>
- 4. Faris REL, Dunham HW. Mental disorders in urban areas: an ecological study of schizophrenia and other psychoses. Chicago: University of Chicago Press, 1939.
- 5. Meadows G, Burgess P, Bobevski I. Distributing mental health care resources: strategic implications from the National Survey of Mental Health and Wellbeing. Aust N Z J Psychiatry 2002; 36: 217-223.
- 6. Meadows GN, Tylee AT. Socioeconomic disadvantage and psychotherapy. Br J Psychiatry 2013; 202: 86-88.
- 7. Harris MG, Burgess PM, Pirkis JE, et al. Policy initiative to improve access to psychological services for people with affective and anxiety disorders: population-level analysis. Br J Psychiatry 2011; 198: 99-108.
- 8. Harris M, Pirkis J, Burgess P, et al. Evaluation of the Better Access to Psychiatrists, Psychologists and GPs through the Medicare Benefits Schedule initiative. Component B: an analysis of Medicare Benefits Schedule (MBS) and Pharmaceutical Benefits Scheme (PBS) administrative data. Melbourne: Melbourne School of Population Health, University of Melbourne, 2011.
- 9. Pirkis J, Harris M, Hall W, Ftanou M. Evaluation of the Better Access to Psychiatrists, Psychologists and General Practitioners through the Medicare Benefits Schedule initiative: summative evaluation. Melbourne: University of Melbourne, 2010.
- 10. Bassilios B, Pirkis J, Fletcher J, et al. The complementarity of two major Australian primary mental health care initiatives. Aust N Z J Psychiatry 2010; 44: 997-1004.
- 11. Byles JE, Dolja-Gore X, Loxton DJ, et al. Women's uptake of Medicare Benefits Schedule mental health items for general practitioners, psychologists and other allied mental health professionals. Med J Aust 2011; 194: 175-179. <MJA full text>
- 12. Pink B. Australian Statistical Geography Standard (ASGS): Volume 3 – Non ABS Structures. Canberra: Australian Bureau of Statistics, 2011. (ABS Cat. No. 1270.0.55.003.) http://www.ausstats.abs.gov.au/ausstats/subscriber.nsf/0/469CDA45CE2B94CCCA257937000D966F/$File/1270055003_oct%202011.pdf (accessed Feb 2014).
- 13. Pink B. Socio-Economic Indexes for Areas (SEIFA) 2011. Technical paper. Canberra: Australian Bureau of Statistics, 2011. (ABS Cat. No. 2033.0.55.001.) http://www.ausstats.abs.gov.au/ausstats/subscriber.nsf/0/22CEDA8038AF7A0DCA257B3B00116E34/$File/2033.0.55.001%20seifa%202011%20technical%20paper.pdf (accessed Feb 2014).
- 14. Australian Bureau of Statistics. QuickStats: a simple at-a-glance summary of Census statistics for your selected area - 2011. Canberra: ABS, 2013. http://www.abs.gov.au/websitedbs/censushome.nsf/home/quickstats?opendocument&navpos=220 (accessed Feb 2014).
- 15. Mangham L. ACT consortium guidance on health equity analysis. London: ACT Consortium Core Group, 2009. http://www.actconsortium.org/data/files/resources/80/Health-equity-analysis-ACT-Consortium-guidance.pdf (accessed Feb 2014).
- 16. Abdelkrim A, Duclos JY. DASP: Distributive Analysis Stata Package. Quebec: PEP, World Bank, UNDP and Université Laval, 2007.
- 17. Asgeirsdóttir TL, Ragnarsdóttir DO. Determinants of relative and absolute concentration indices: evidence from 26 European countries. Int J Equity Health 2013; 12: 53. doi: 10.1186/1475-9276-12-53.
- 18. Clarke P, Smith L. More or less equal? Comparing Australian income-related inequality in self-reported health with other industrialised countries. Aust N Z J Public Health 2000; 24: 370-373.
- 19. Meadows G, Singh B, Burgess P, Bobevski I. Psychiatry and the need for mental health care in Australia: findings from the National Survey of Mental Health and Wellbeing. Aust N Z J Psychiatry 2002; 36: 210-216.
- 20. Harris MF. Who gets the care in Medicare? Med J Aust 2012; 197: 598-599. <MJA full text>
- 21. Goldberg D, Huxley P. Mental illness in the community: the pathway to psychiatric care. London: Tavistock Publications, 1980.
- 22. Burgess P, Pirkis J, Buckingham B, et al. Mental health needs and expenditure in Australia. Canberra: Mental Health and Special Programs Branch, Commonwealth Department of Health and Ageing, 2002.
- 23. Meadows G. Geographical resource allocation for public mental health services in Victoria. Aust N Z J Psychiatry 1997; 31: 95-104.
- 24. Garling P. Final report of the special commission of inquiry into acute care services in NSW public hospitals. Sydney: NSW Department of Premier and Cabinet, 2008. http://www.lawlink.nsw.gov.au/Lawlink/Corporate/ll_corporate.nsf/pages/attorney_generals_department_acsinquiry (accessed Sep 2014).
- 25. Australian Government. Questions and answers: transition arrangements for the allied mental health services available under the Better Access Initiative. Canberra: Department of Health and Ageing, 2012. http://www.health.gov.au/internet/main/publishing.nsf/Content/mental-ba-fact-transqa (accessed Feb 2014).
Abstract
Objectives: To examine whether adult use of mental health services subsidised by Medicare varies by measures of socioeconomic and geographic disadvantage in Australia.
Design, setting and participants: A secondary analysis of national Medicare data from 1 July 2007 to 30 June 2011 for all mental health services subsidised by Better Access to Mental Health Care (Better Access) and Medicare — providers included general practitioners, psychiatrists, clinical psychologists and mental health allied health practitioners.
Main outcome measures: Service use rates followed by measurement of inequity using the concentration curve and concentration index.
Results: Increasing remoteness was consistently associated with lower service activity; eg, per 1000 population, the annual rate of use of GP items was 79 in major cities and 25 and 8 in remote and very remote areas, respectively. Apart from GP usage, higher socioeconomic disadvantage in areas was typically associated with lower usage; eg, per 1000 population per year, clinical psychologist consultations were 68, 40 and 23 in the highest, middle and lowest advantaged quintiles, respectively; and non-Better Access psychiatry items were 117, 55 and 45 in the highest, middle and lowest advantaged quintiles, respectively.
Conclusions: Our results highlight important socioeconomic and geographical disparities associated with the use of Better Access and related Medicare services. This can inform Australia's policymakers about these priority gaps and help to stimulate targeted strategies both nationally and regionally that work towards the universal and equitable delivery of mental health care for all Australians.