


Non-melanoma skin cancer (NMSC), which includes basal cell carcinoma (BCC) and squamous cell carcinoma (SCC), is the most common and expensive cancer in Australia1,2 and places a high burden on the population, health care system and government. Australia has the highest incidence of NMSC in the world;3 2% of the Australian population (364 000 people) were treated for NMSC in 2001, with a total expenditure of $264 million making it the most expensive cancer.1 In comparison, colorectal cancer was the second most common cancer in Australia in 2001, with 12 701 new cases and a cost of $235 million.1 The risk of NMSC increases with age, and the ageing of the Australian population may increase the burden of NMSC on the Australian health system.
Unlike other cancers, the two subtypes of NMSC are not reportable to cancer registries in Australia.2 Estimates of the number of treatments and cost of NMSC in Australia have been based on incidence data. The Australian Institute of Health and Welfare (AIHW) used these data to estimate health system expenditures,1 but incidence data count only one instance of NMSC per year for an individual, whereas individuals diagnosed with NMSC tend to have multiple NMSCs.4 Therefore, we were interested in the absolute number of treatments in 1 year and the associated costs.
For general information purposes, Medicare Australia publishes the total numbers of claims made and the benefits paid according to the Medicare Benefits Schedule (MBS) with respect to each individual Medicare item number. We sourced these freely available data from the Medicare Australia website for all item numbers that relate to treatment of NMSC.5 We obtained the total number of claims and the total MBS benefit paid for claims for the period 1997 to 2010 by year, sex, age group, state and territory. We collected data pertaining to item numbers for the treatment of NMSC by excision, curettage, laser, or liquid nitrogen cryotherapy. The selected item numbers were: 30196, 30197, 30202, 30203, 31255, 31256, 31257, 31258, 31260, 31261, 31262, 31263, 31265, 31266, 31267, 31268, 31270, 31271, 31272, 31273, 31275, 31276, 31277, 31278, 31280, 31281, 31282, 31283, 31285, 31286, 31287, 31288, 31290, 31291, 31292, 31293 and 31295.
We formatted and analysed the data using Stata version 11.0 (StataCorp).
We calculated age-specific rates of services for each year using population data from the Australian Bureau of Statistics (ABS).6 We fitted separate linear regression models to the age-specific rates of services and extrapolated these rates to 2015. The age-specific rates of services were multiplied by the projected population data (Series B), which were also obtained from the ABS,6 to estimate the number of NMSC treatments for the years 2011 to 2015. We calculated the standard error of the linear predictions (using Stata’s “predict” command) and used these standard errors to calculate the corresponding 95% confidence intervals. Linear extrapolation is the option of choice for short-term predictions of most cancers.7 We assumed that after 1997 no abrupt change in awareness and behaviour among the population occurred, as it did in the 1980s as a result of the start of the Australian Government-funded national skin cancer prevention campaign, “SunSmart”, and that consequently the predictions would be more accurate using data from 1997 onward.8
The total benefit is the contribution of Medicare Australia for the service. However, rules regarding multiple procedures performed on the same day reduce the benefit paid for the second procedure by 50% and the third and subsequent procedures by 75%. While patients frequently make copayments to the treating doctor, the cost to Medicare is the specific cost of an NMSC treatment to the Australian health system. To estimate the total treatment cost for the years 2002 to 2010 we used the AIHW estimate for total treatment cost in 2001, which takes into account costs related to admitted patients, out-of-hospital medical claims, pharmaceuticals requiring a prescription, pathology testing and consultations with general practitioners and specialists.1 The total treatment cost for subsequent years was calculated, with and without inflation, by multiplying the unit cost of a single NMSC treatment by the total annual number of NMSC treatments identified by Medicare. To calculate the unit cost of a single NMSC treatment, we divided the total cost in 2001 estimated by the AIHW1 by the total number of treatments in 2001 identified by Medicare Australia. To account for inflation, we adjusted the unit cost of a single NMSC treatment with the average annual growth rate for health inflation (ie, 3.2% per year).9 We then multiplied the unit cost of a single NMSC treatment by the predicted number of NMSC treatments to obtain the predicted total cost of NMSC treatment for the years 2011 to 2015.
In 1997 and 2010, Medicare claims were made for 412 493 and 767 347 NMSC treatments, respectively, representing an increase of 86%. We calculated that by 2015 the number of NMSC treatments will be 938 991 (95% CI, 901 047–976 934) (Box 1). This represents an increase of 22% between 2010 and 2015 and a doubling in the number of NMSC treatments between 1997 and 2015. The total number of treatments for each state and territory in Australia are provided as an Appendix.
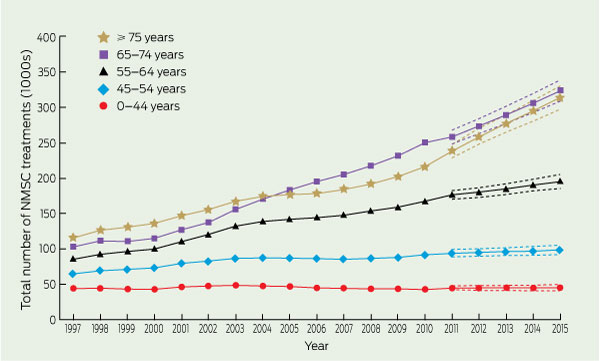
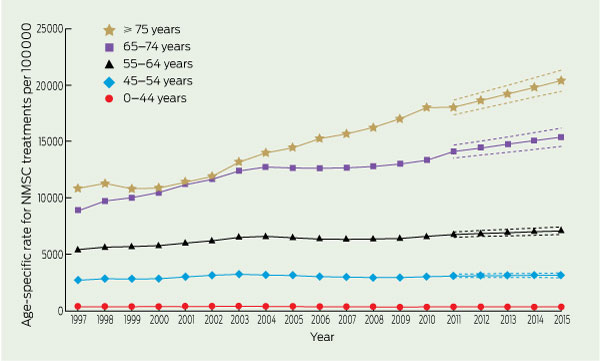
In 2010, 83% of NMSC treatments were administered in people aged 55 years and over, and nearly two-thirds of NMSC treatments were administered in people aged 65 years and over. Examination of the total number of NMSC treatments by year and age (Box 2) indicates that in 2015 most treatments will be provided to people aged 65–74 years (313 795 NMSC treatments; 95% CI, 297 209–330 389) and aged 75 years and over (324 151 NMSC treatments; 95% CI, 309 335–338 967). From 1997 to 2015, NMSC treatments provided to those aged 65–74 years and 75 years and over will have increased by 171% and 215%, respectively. In contrast, people aged less than 45 years will receive fewer than 50 000 treatments in 2015. NMSC treatments provided to those aged less than 45 years will show only a modest increase of 3% (1259 treatments) from 1997 to 2015. The age-specific rates for the years 1997 and 2010 were 355 per 100 000 and 310 per 100 000, respectively, for the youngest age group and 10 849 per 100 000 and 18 036 per 100 000 for those aged 75 years and over (Box 3). The age-specific rates are expected to increase to 318 per 100 000 and 20 398 per 100 000 for the youngest and oldest age groups, respectively, in 2015.
In 2010, the total MBS benefit for NMSC treatments was $93.5 million. We estimated that the total MBS benefit for NMSC treatments will be $109.8 million (95% CI, $105.9–$113.7 million) in 2015 (Box 1). The Appendix shows the predicted MBS benefit for each state; Queensland and New South Wales account for most of the cost.
The total treatment cost, adjusting for health inflation, was $511.0 million in 2010 (Box 1). We estimated that this amount will increase to $703.0 million (95% CI, $674.6–$731.4 million) in 2015. The gap between the total MBS benefit and the total treatment cost with health inflation rose from $213.0 million in 2001 to $417.5 million in 2010 and will rise to $593.2 million in 2015 (Box 1).
We also estimate that the number of NMSC treatments in those aged 55 years and over will continue to rise significantly while the number of NMSC treatments in those aged less than 55 years will only rise modestly. These findings are consistent with previous Australian findings that showed no significant increase in the incidence of SCC among people aged less than 50 years and no significant increase in the incidence of BCC among people under 60 years of age.3
The increase in NMSC treatments could be explained in part by population growth; from 1997 to 2015 the number of people aged 65–74 years will increase by around 57% and the number of people ≥ 75 years by 68%,6 compared with the predicted increase in NMSC treatments in these age groups of 171% and 215%, respectively. In contrast, the 3% increase in NMSC treatments between 1997 and 2015 among people aged less than 45 years coincides with a predicted 15% increase in this population,6 indicating a relative decrease in the number of treatments for this age group.
The increase in the total MBS benefit and total cost of NMSC reflects both population growth and the predicted increase in the total number of services. With 7.20 million residents in 2011, NSW has a larger population than other states in Australia and the highest number of NMSC treatments, and yet Qld, with a total population of 4.56 million in 2011, has a similar MBS benefit cost due to a higher incidence of NMSC.3
1 Total number of services, total MBS benefit and total cost of non-melanoma skin cancer treatment in Australia, 1997–2015
Received 17 April 2012, accepted 3 October 2012
- Marloes Fransen1,2,3
- Amalia Karahalios3,4
- Niyati Sharma1,2,3
- Dallas R English3,4
- Graham G Giles3,4
- Rodney D Sinclair1,5,6
- 1 Department of Medicine, University of Melbourne, Melbourne, VIC.
- 2 Department of Dermatology, St Vincent’s Hospital, Melbourne VIC.
- 3 Cancer Epidemiology Centre, Cancer Council Victoria, Melbourne VIC.
- 4 Centre for Molecular, Environmental, Genetic and Analytic Epidemiology, School of Population Health, University of Melbourne, Melbourne VIC.
- 5 Epworth Hospital, Melbourne VIC.
- 6 Department of Dermatology, St Vincent’s Hospital, Melbourne, VIC.
We thank Sean McGuigan, Biostatistician, Epworth HealthCare for critical review of the manuscript. N S thanks the Cancer Council of Victoria for scholarship support. R D S acknowledges salary support from the Skin and Cancer Foundation of Victoria.
No relevant disclosures.
- 1. Australian Institute of Health and Welfare. Health system expenditures on cancer and other neoplasms in Australia, 2000–01. Canberra: AIHW, 2005. (AIHW Cat. No. HWE 29; Health and Welfare Expenditure Series No. 22.) http://www.aihw.gov.au/publications/hwe/hsecna00-01/hsecna00-01.pdf (accessed May 2011).
- 2. Australian Institute of Health and Welfare, Cancer Australia. Non-melanoma skin cancer: general practice consultations, hospitalisation and mortality. Canberra: AIHW, 2008. (AIHW Cat. No. 39; Cancer Series No. 43.) http://www.aihw.gov.au/WorkArea/DownloadAsset. aspx?id=6442454591 (accessed May 2011).
- 3. Staples MP, Elwood M, Burton RC, et al. Non-melanoma skin cancer in Australia: the 2002 national survey and trends since 1985. Med J Aust 2006; 184: 6-10. <MJA full text>
- 4. Raasch BA, Buettner PG. Multiple nonmelanoma skin cancer in an exposed Australian population. Int J Dermatol 2002; 41: 652-658.
- 5. Medicare Australia. Medicare Benefits Schedule item statistics reports. https: //www.medicareaustralia.gov.au/statistics/mbs_item.shtml (accessed May 2011).
- 6. Australian Bureau of Statistics. Population projections, Australia, 2006 to 2101. Canberra: ABS, 2008. (ABS Cat. No. 3222.0.) http://www.abs.gov.au/Ausstats/abs@.nsf/mf/3222.0 (accessed May 2011).
- 7. Dyba T, Hakulinen T. Do cancer predictions work? Eur J Cancer 2008; 44: 448-453.
- 8. Montague M, Borland R, Sinclair C. Slip! Slop! Slap! and SunSmart, 1980-2000: skin cancer control and 20 years of population-based campaigning. Health Educ Behav 2001; 28: 290-305.
- 9. Australian Institute of Health and Welfare. Health expenditure Australia 2008-09. Canberra: AIHW, 2010. (AIHW Cat. No. HWE 51; Health and Welfare Expenditure Series No. 42.) http://www.aihw.gov.au/publication-detail/?id=6442472450 (accessed May 2011).
Abstract
Objectives: To report the burden and cost of non-melanoma skin cancer (NMSC) treatments in Australia and to project estimates of numbers and costs to 2015.
Design and setting: Retrospective study of data obtained from Medicare Australia for NMSC treated by excision, curettage, laser or cryotherapy between 1 January 1997 and 31 December 2010, by year, sex, age group and state or territory.
Main outcome measures: Total number, total Medicare Benefits Schedule (MBS) benefit and total cost in Australian dollars of NMSC treatments.
Results: The total number of NMSC treatments increased from 412 493 in 1997 to 767 347 in 2010, and we estimated that the number of treatments would increase to 938 991 (95% CI, 901 047–976 934) by 2015. The total MBS benefit for NMSC treatments in 2010 was $93.5 million, and we estimated that this will increase to $109.8 million (95% CI, $105.9–$113.7 million) by 2015, whereas the total cost with inflation (ie, cost which includes diagnosis, treatment and pathology) was $511.0 million in 2010, estimated to increase to $703.0 million (95% CI, $674.6–$731.4 million) by 2015.
Conclusion: NMSC treatments increased by 86% between 1997 and 2010. We anticipate that the number and the total cost without inflation of NMSC treatments will increase by a further 22% between 2010 and 2015. NMSC will remain the most costly cancer and place an increasing burden on the Australian health care system.